Backtesting/Verification
Forecast ability definition
Backtesting/Verification is a procedure that helps to understand quickly how well our projection line is able to forecast the future. I.e. it is a method to evaluate visually how the projection line forecasts the future price movement when the forecast is already made and a new piece of the price history is not arrived yet. You should always make a difference between the understanding of how your model explains the past (post factum explanation) and how that same model forecasts the future.
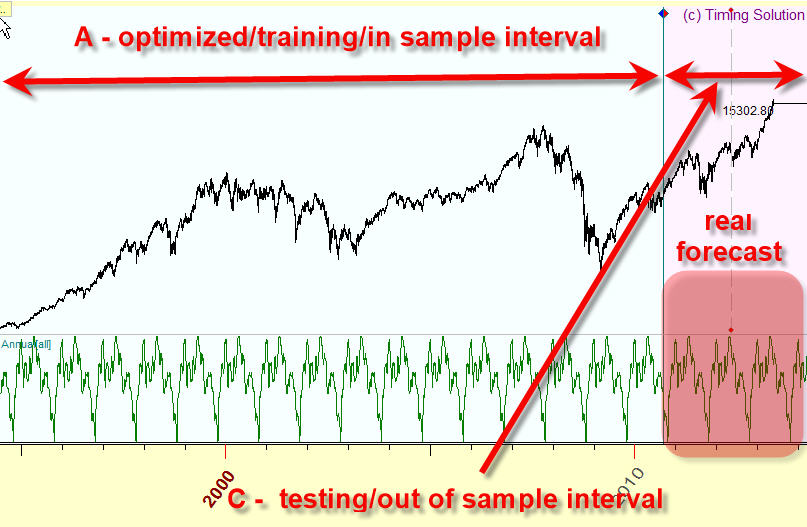
Below is the explanation how to perform backtesting/verification of techniques available in Timing Solution. Mostly, we will work with different variations of projection lines. To conduct the verification procedure you must split the analyzed price history data on two parts. Look at this chart:
It is divided on two parts. The first part of the price chart, A, is called optimized/training/in sample interval of the price history. In our example, it covers a portion of data up to the end of the year 2010. The second part C is called testing/out of sample interval of the price history. This is a piece of the price history since the end of the year 2010. You can use any model here. The important fact is: the program uses only A portion of the price history to calculate the projection line and does not use the C portion of the price history, this is an "untouched" territory.
Forecast ability is the ability of the model to forecast the price movement on C interval. Pay attention, usually the fit between the price (to be exact, price oscillator) and the projection line is very good on A interval, and it does not mean that the forecast ability of the model used to generate this projection line is good. The projection line always looks good on A interval due to math optimization procedure - this is post factum explanation, it shows only good programming skills of the software designer, and it does not mean that the forecast ability of our model and the projection line is good.
So once again. forecast ability is a measure of how the projection line forecasts the future on testing/out of sample interval. So, when somebody shows you some forecast, you should always ask when this forecast was made, and how this forecast works on a testing/out of sample interval. In other words you should always make sure that you have established a difference between a post factum explanation and a real forecast.
Learning Border Cursor (LBC) definition
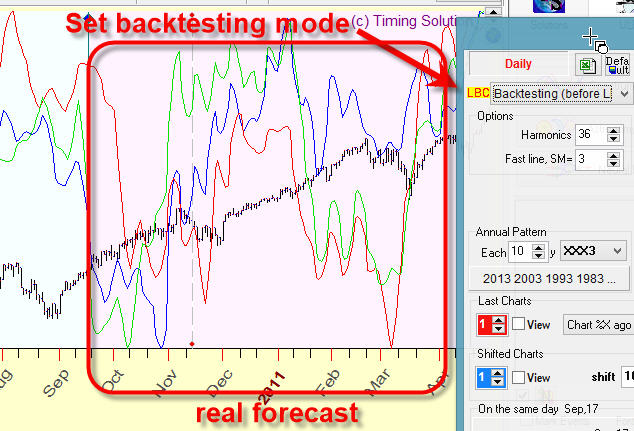
The border between these two parts of the price history is called Learning Border Cursor, or LBC:
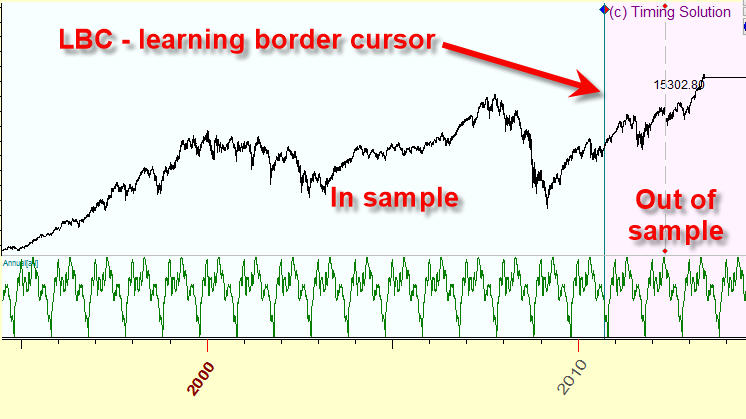
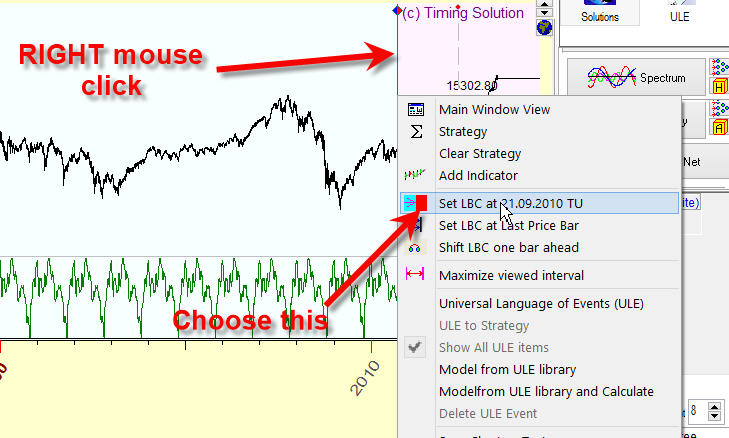
So you always should examine how your technique works after LBC. To set LBC to any position, click RIGHT mouse button and highlight this menu item:
Examples of visual verification of different models available in Timing Solution
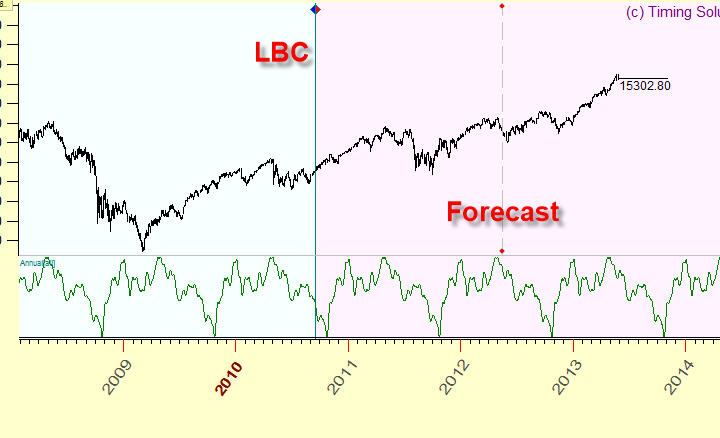
Composite module: simply set LBC on some random date and watch how well the projection line fits the price after LBC. The projection line after LBC is a real forecast:
For your convenience you may display a projection line overlaying the price chart (not in separate panel as is shown on the picture above). In order to do that, press this button:
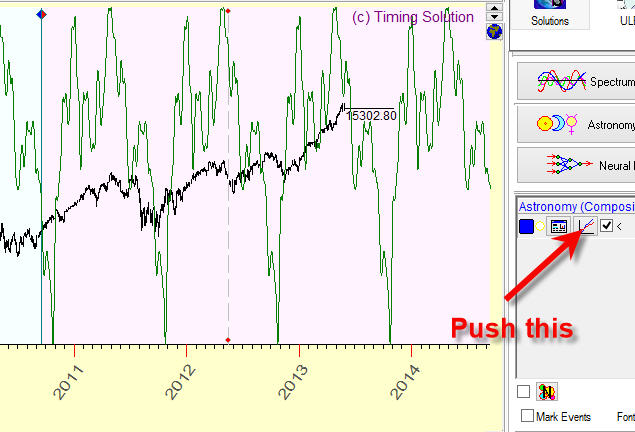
Also pay attention to a correlation coefficient between the projection line and the price (to be exact, price oscillator); it is displayed in the left top corner of the composite module:
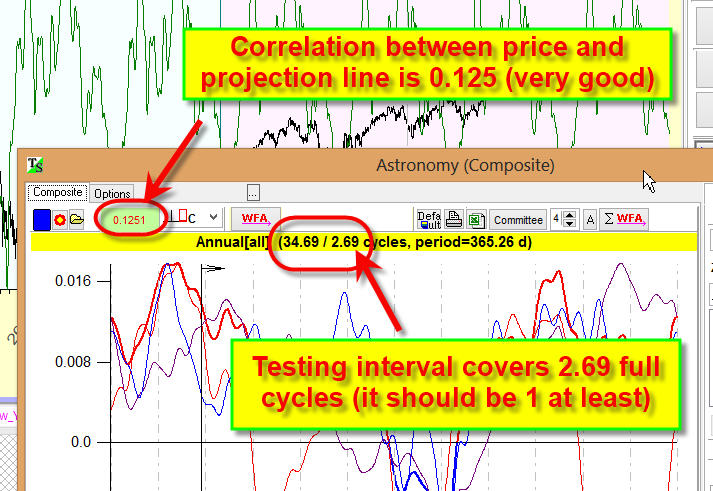
Also always check the length of the analyzed interval, how many cycles are covered by the testing interval. In this example we analyze Annual 365 days cycle, the testing interval here covers 2.69 years of the price history. In other words, the testing interval covers 2.69 years of the price history, we have 2.69 years of the price history after LBC. This is enough, the testing interval should cover at least one full cycle; otherwise the correlation coefficient can not be calculated correctly.
The typical correlation for astro cycles is 0.05-0.15 (5-15%).
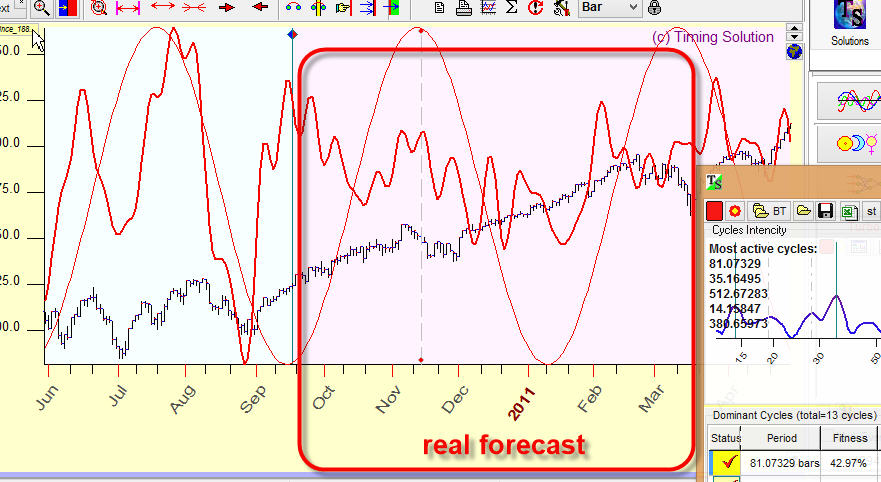
Turbo Cycles module: this module works in the same manner as the previous one; the forecast after LBC is a real forecast i.e. it shows the real workability of the analyzed cyclical model:
Pattern->Similarity module: In similarity module you will find a special option that allows to switch to backtesting mode:
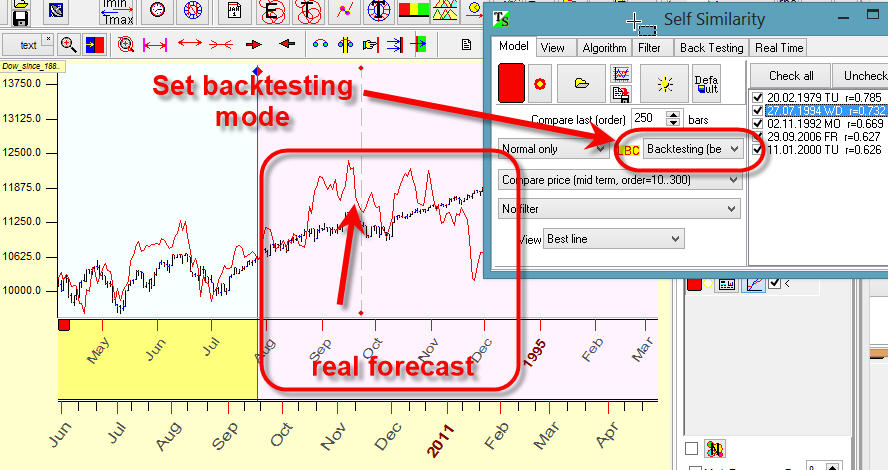
In this case the program will not use the price history after LBC for calculations and this way you can check the real workability of your model.
Natural Cycles module: simply Natural Cycles module allows to calculate the most important natural cycles like Annual, weekly, diurnal cycles etc. It is here:
By default it works in final mode, i.e. uses the whole available price history to calculate these cycles. You can switch to backtesting mode this way:
and projection line after LBC will be a real forecast. This is the same approach as employed in similarity module.
Random LBC module
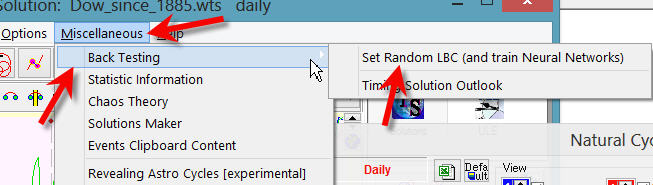
To quickly preview how your models work, "Random LBC" module is recommended, it is in "Miscellaneous" section:
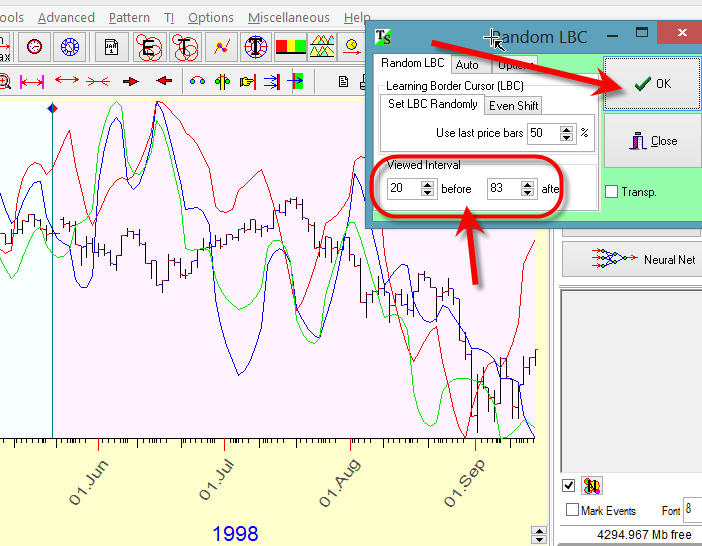
The idea of this module is very simple: clicking OK button there you set the LBC position randomly on different dates, the program automatically recalculates all analyzed models with the new LBC position and adjusts the Main screen to make some bars of the price history before and after LBC visible for you, so you will see immediately how well your models work after LBC (i.e. how they really work):
Very often I perform this semi automated backtesting procedure this way: run several modules like Turbo Cycles and Similarity (set Similarity in backtesting mode); choose there the best models; after that run "Random LBC" module and clicking OK button many time watch how these models (two or more) work in different stock market conditions. Thus with one mouse click you will set LBC randomly and adjust Main screen to make the price history after LBC visible for you. This way you can preview very quickly how the analyzed models work.
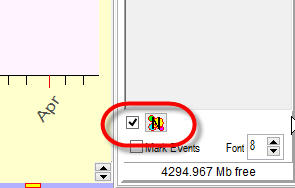
These options  allow to adjust the amount of visible price bars before and after LBC.
Verification of non formal techniques:
Non formal techniques are techniques where the formal math approach cannot be applied. For example, let's consider Neural Network (NN) model. This is a formal model, it has some steps we need to do to get a projection line based on this NN model. There are not any subjective factors here, there are only the formal steps that we should do. For these models we can conduct Walk Forward Analysis and obtain the formal math criteria to evaluate the quality of this projection line.
The techniques like planetary lines, charting tools, market profile etc. are non formal techniques. They are non formal because the subjective factors dominate here: we do not have formal rules how to draw trend lines, Gann fans etc., we have no formal rules how to choose some planetary line among thousands and thousands of them. There are some recommendations; these recommendations implement knowledge/experience or something else. The decision here comes not from formal algorithms, this is a human made decision. Obviously the formal backtesting approach is not applicable here though we can recommend some steps to check yourselves.
Here are the steps we recommend:
- set LBC standard way, like this:
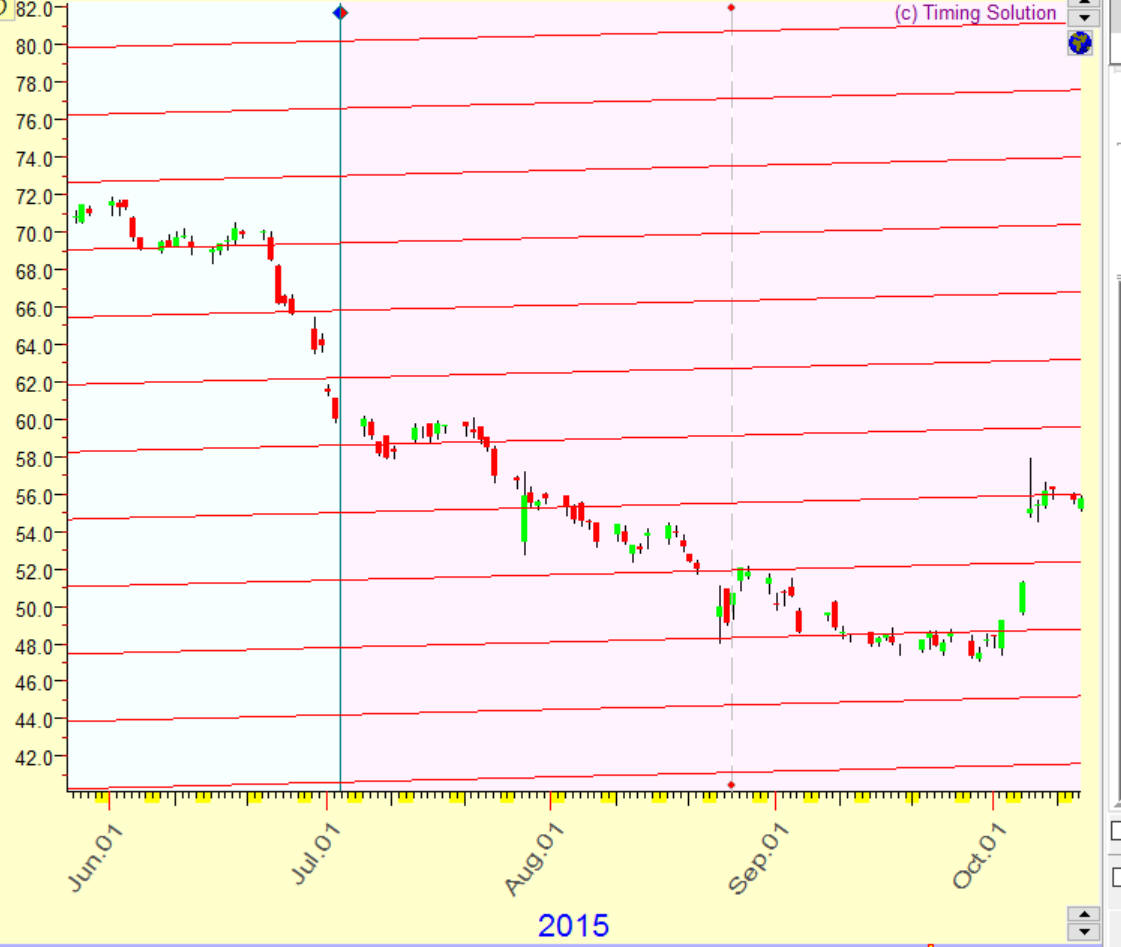
We set LBC here at the beginning of July 2015. In other words we send ourselves to the beginning of July 2015 and try to forecast what may happenthe next 5 months, till December 2015.
- Next step is: push this button to make the price history after LBC invisible:
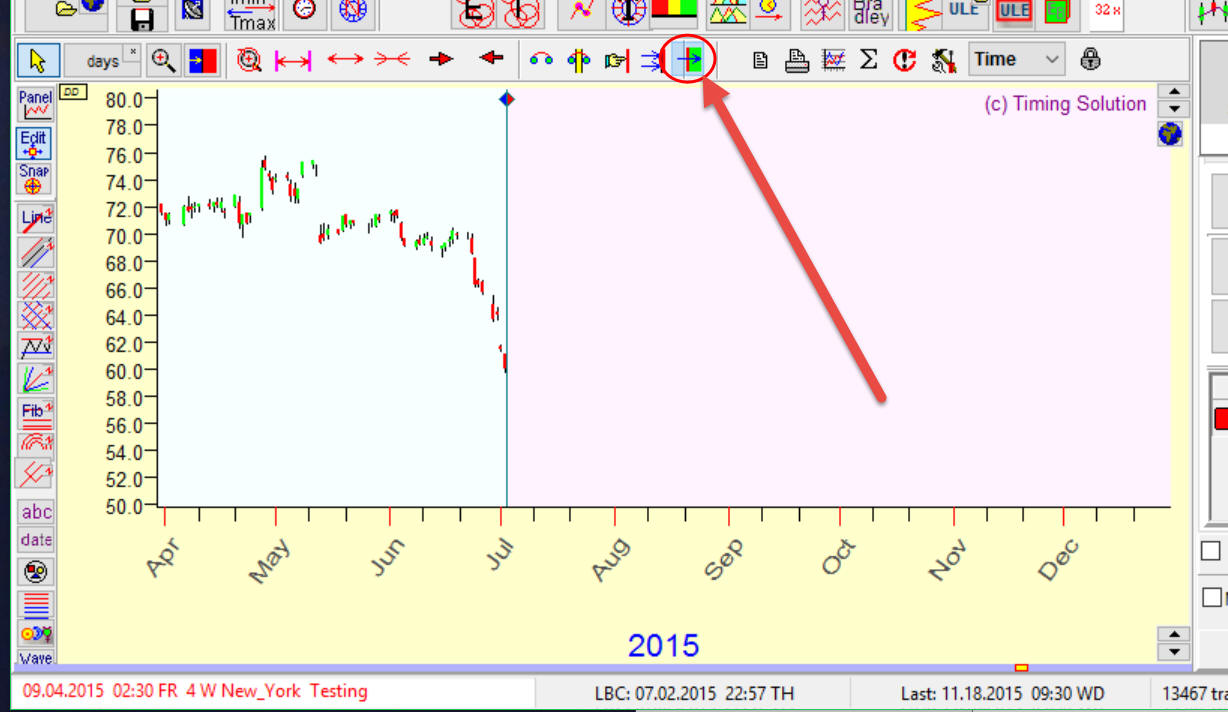
- Now you can run the planetary line module, draw any charting tool etc. and try to make a forecast based on the visible chart (before the beginning of July 2015).
For example, you think that this planetary line for your particular stock looks promising, it hits important turning points:
- Push this button once again and it will make the price history after LBC visible, you can see how these planetary lines work after LBC:
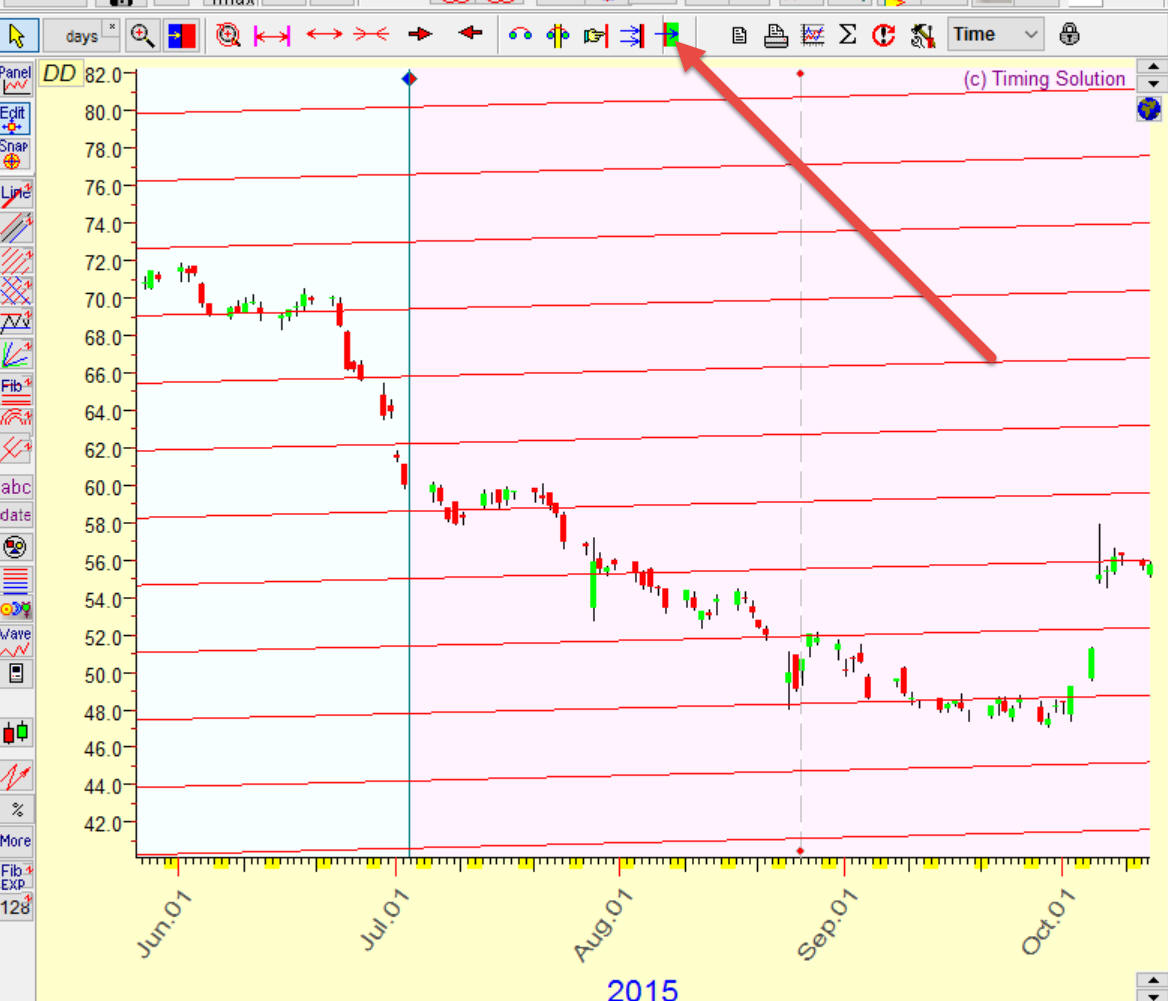
In other words you send yourself back to July 2015, try to make a forecast based on available at that moment price history, and then you can see how the price really has moved after July and how accurate your forecast is.
Afterwards
Now, I would like to point out some important thing. We have discussed here a qualitative, visual way of analyzing the forecast ability of our models. Timing Solution software has some other modules where we can provide a quantitative analysis as well - like Turbo Cycle backtesting and Composite Work Forward Analysis. They are automated procedures focused on finding a best optimized model. When a model is found, I always recommend to make first its visual evaluation as described above. This way you will be able to decide how well this model fits you, how comfortable you are with it, before applying that model to your trading.
Sergey Tarassov
June 30, 2013
November 19, 2015
Georgian Bay, Canada