Projection line - definitions
Our main product is a verified projection line calculated for any financial instrument. This approach is totally different from the popular approach based on Technical Analysis, and I believe that the discussion of the basics would be helpful here.
Definition
A projection line prolongs the price chart into the future beyond the magical "Now" point. It can be called "a forecast" as well. Here are some examples:
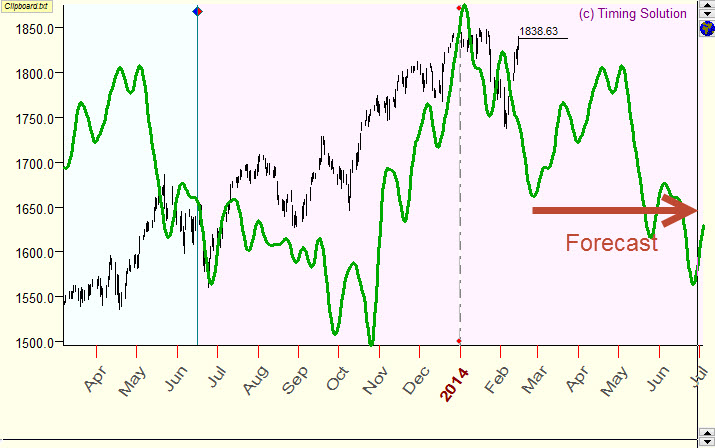
Annual cycle for S&P500:
As you see, this forecast is made on February 14, 2014, as the last price bar here is February 14, 2014. The projection line prolongs this price chart further, and it gives us some hints regarding future price movements.
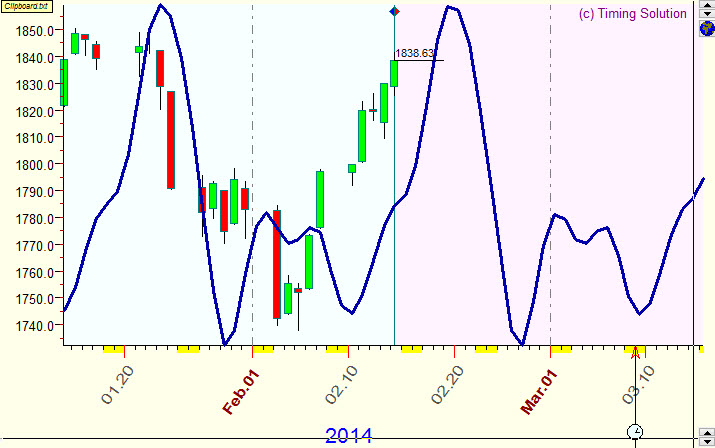
Another example is the projection line based on one of the Moon based cycles, the Moon tropical cycle:
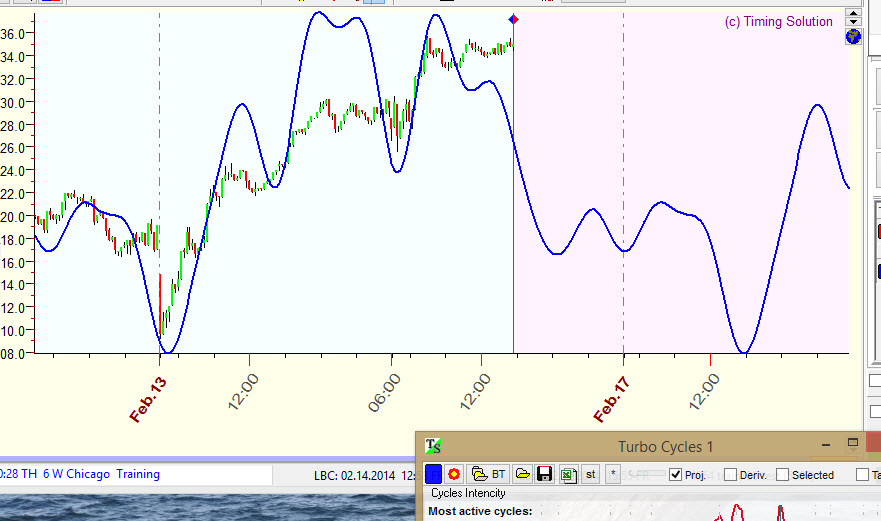
One more example, the projection line based on dominant cycles calculated for 5 min S&P. This is done by Turbo Cycle module of Timing Solution software; it conducts sophisticated cyclical analysis fantastically fast in real time mode:
And this is the more specific example: the projection line calculated by Similarity module. The program searches the most similar period in the past, and this chart can be used as a future forecast tool. In this example there is some similarity between the price movement in 2014 and in 2004. We do know the actual price movement in 2004, so we can use this price chart as a forecast tool:
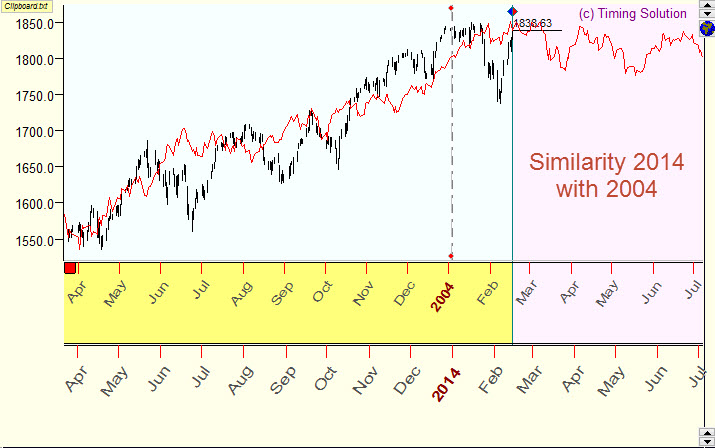
In brief, the projection line is based on some idea or pattern or cycle that can be traced in initial price chart. We prolong it into the future in the hope that the same idea/pattern/cycle still can be present in the future market moves. This is our approach.
Timing Solution software provides a great variety of different projection lines based on different models. Plus we provide a tool for verification of these projection lines.
Projection line forecasts not price itself but turning points
In most cases the projection line forecasts not the price itself; it forecasts turning points mostly. As an example, let us consider the projection line based on Annual cycle and the price chart for the last five years:
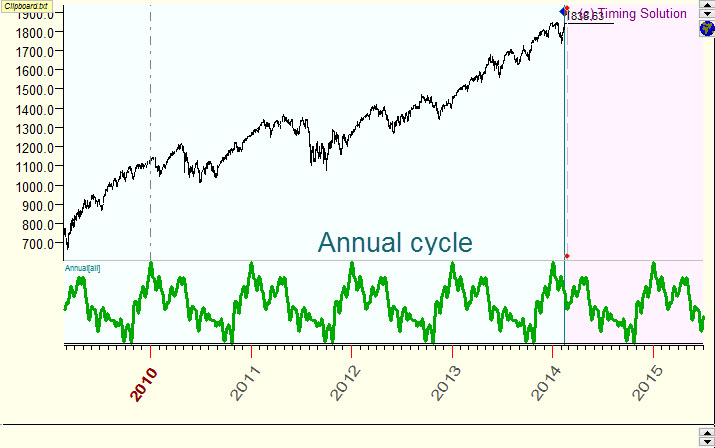
You see the projection line looks very different from the price chart. The projection line looks like an oscillation around zero level while the initial price chart has a trend. To be able to apply math methods and use different types of analysis, we have to normalize the price chart (i.e. to remove the trend). It means that we will work with the price oscillators, not the price itself (mostly). Therefore, the projection line is more suitable to forecast turning points than price levels. In other words, the projection line is more about timing than pricing. To deal with the pricing, Timing Solution software has other methods.
How to use the projection line
What is the accuracy of a forecast provided by some projection line? It is not a simple question as the projection line is not much used in financial analysis yet. When the projection line is mentioned, we often are faced with two opposite opinions regarding its forecasting ability.
The first opinion represents hopes of the followers; it takes a projection line as a kind of Holy Grail in financial analysis. Its adepts like to show samples of nice looking projection lines together with the actual price.
The second opinion is a total denial. You can hear it from skeptics and from disappointed believers who tried to work with the projection line and did not find their Holy Grail. They state that nobody knows the future, so the forecast in finance is impossible.
We believe that (as always) the Truth is somewhere in the middle. The typical forecast ability of a verified projection line is 10%. In other words, the typical projection line allows to explain 10% of the price movement. The rest 90% of the stock market movement is moved by other forces.
There is one more issue regarding the use of projection lines for trading is their reliability. It is very important because it is possible to find a piece of price history for any forecast model where this model works very well, while in reality this model practically does not work. It may happen as a result of some occasional coincidence. So, before using any projection line, it should be verified some way. We have tried several approaches for that purpose. We believe that the best way is applying Walk Forward Analysis (WFA) for the verification of projection lines. This method (WFA) helps to separate really working models from those that only look good.
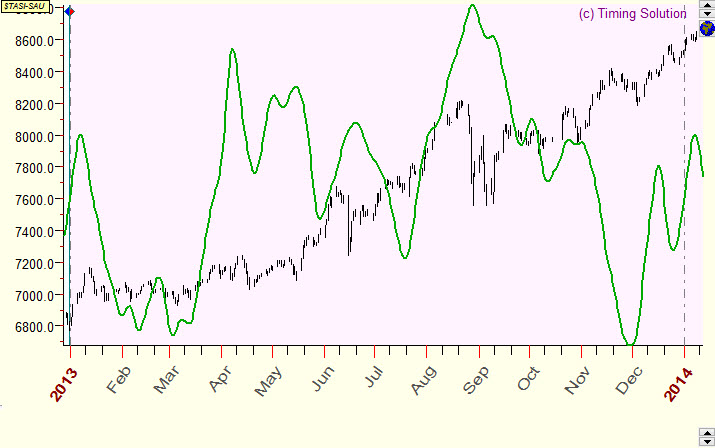
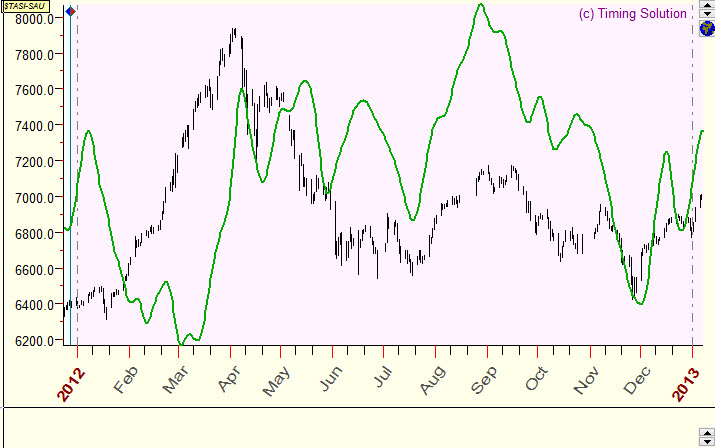
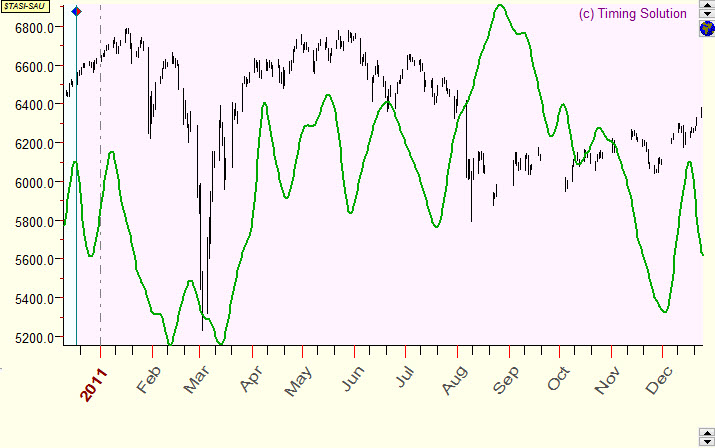
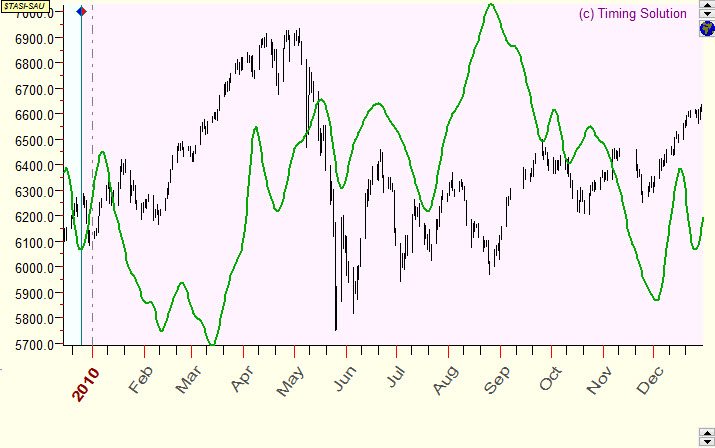
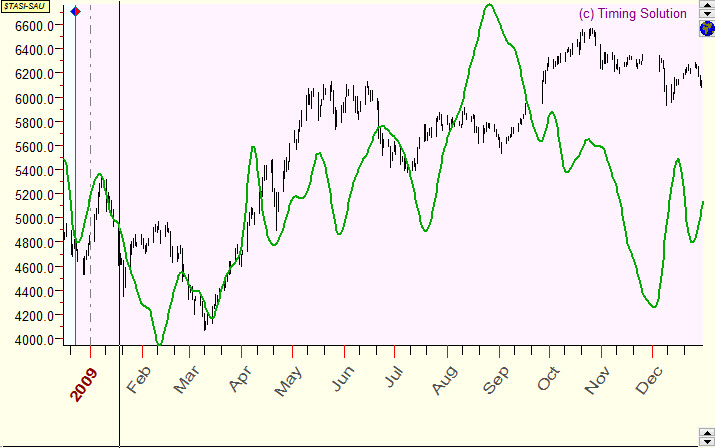
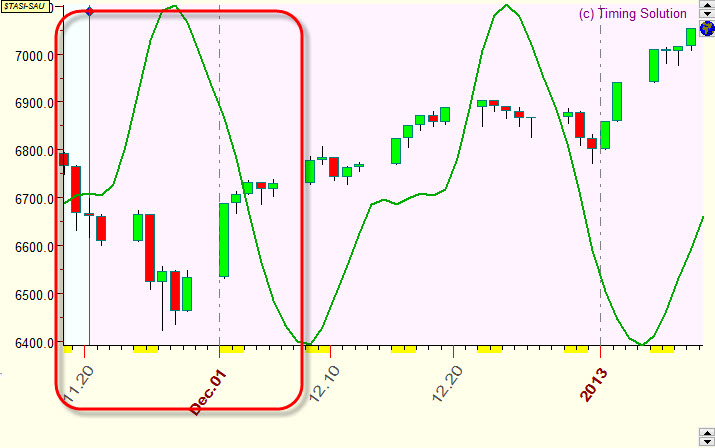
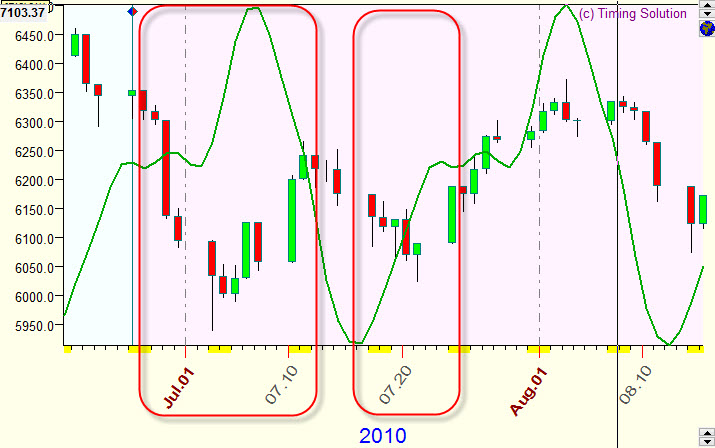
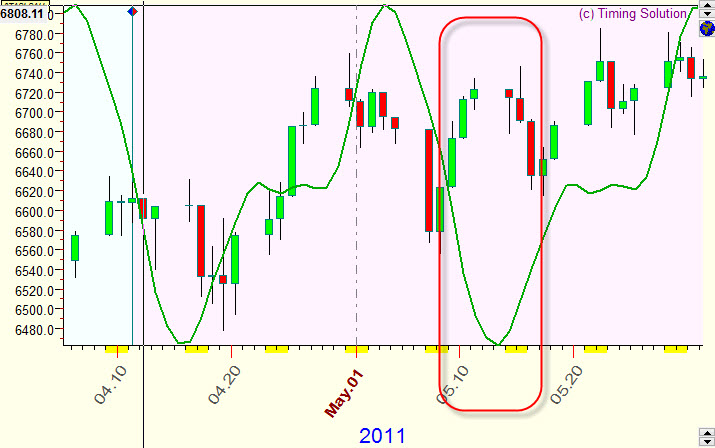
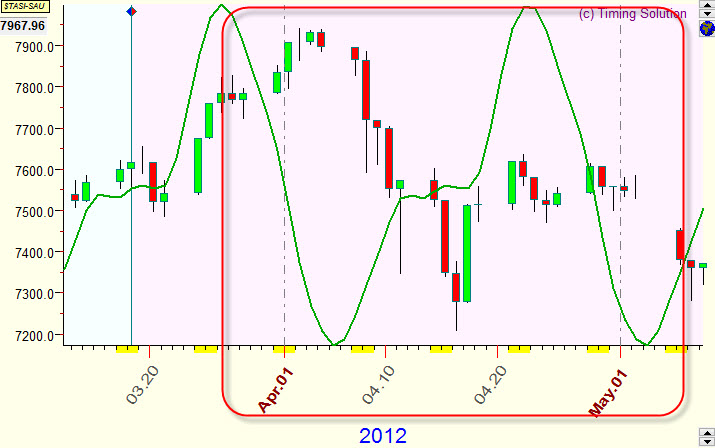
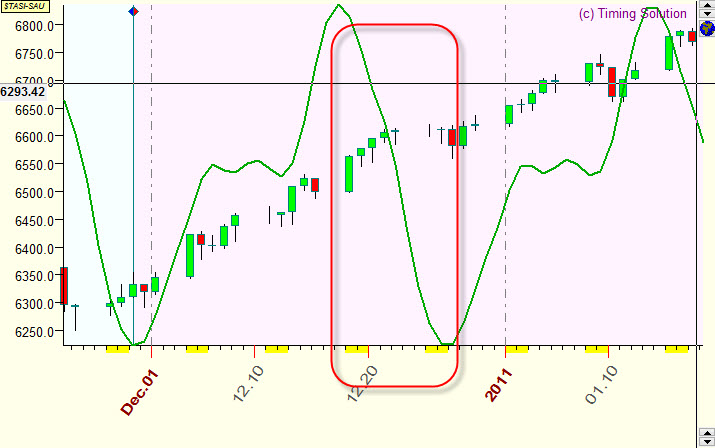
Below are random examples of verified projection lines together with corresponding price charts. Samples are done for Saudi Arabia All share index (TASI), and as a model for projection lines the Moon based cycle is used. The average forecast ability of this cyclic model is 10% (correlation=0.1). Usually, though they do not explain everything, such projection lines (with the correlation around 0.1) reflect some market movements that can be seen on the price chart. This info alone is not enough for successful trading; however, it contains a unique information that cannot be obtained by other methods of analysis.
So, see now what can be achieved with this model. The periods when the model does not work are framed with red:
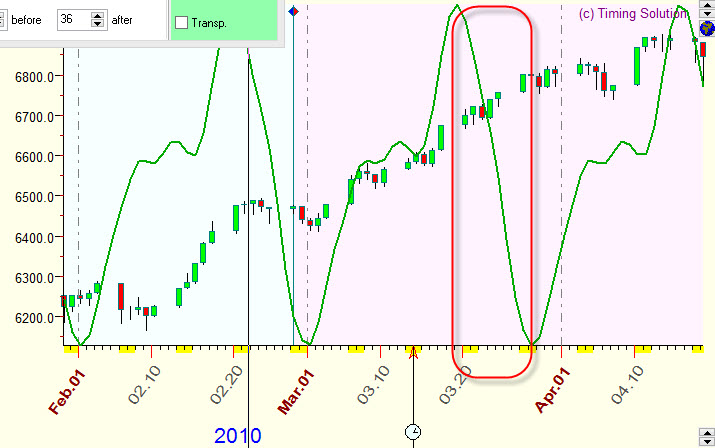
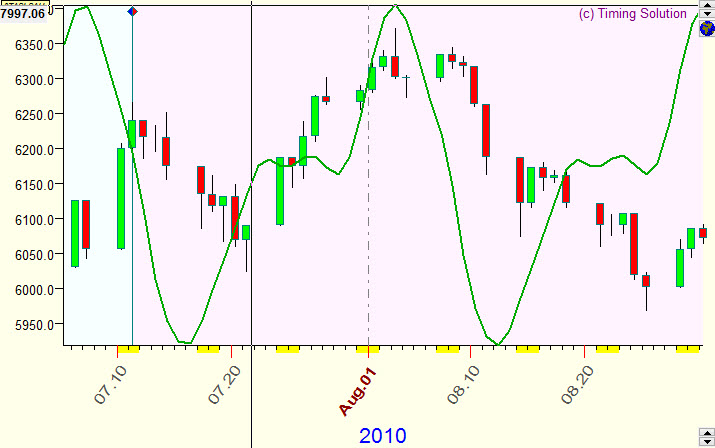
Please see another model. It is based on Annual cycle: