Intermarket Analysis' Interpretation by Timing Solution
technology description
written by Sergey Tarassov
Intermarket analysis is quite a popular thing. Here is a definition of it, on the website http://www.investopedia.com/
In other words, when we conduct intermarket analysis, we consider here the stock market not as an isolated phenomenon that exists in itself and by itself and does not depend on other phenomena. Instead, we consider the stock market as a part of Big World involved in different relationships with other parts of this World.
In Timing Solution this approach (I call it classical) is presented by "Intermarket analysis" module. The description of this module is here: http://www.timingsolution.com/TS/Programs/pr/#A100
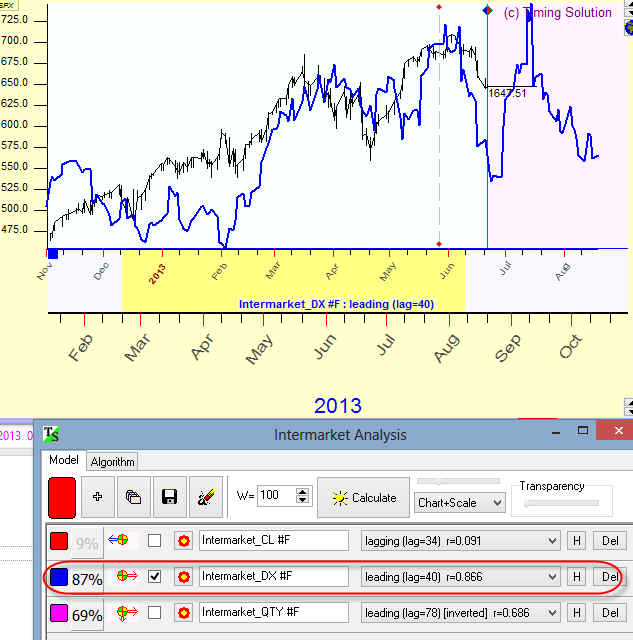
Let me show how it works. We will create an intermarket forecasting model for Dow Jones Industrial index. It will be based on other financial instruments: futures for crude oil, dollar index and 10 years bonds. At some periods of time, DJII follows crude oil futures; then it follows dollar index or bonds. So, we may assume that it is possible to reconstruct DJII curve using similar pieces of bonds' or futures' charts, in the same manner as we can reconstruct some puzzle from different blocks and pieces. These financial instruments represent the pieces of the puzzle. All we have to do is just find these pieces of the puzzle and locate them at the proper places. This is what we get as the result of applying intermarket analysis:
The program shows that the most promising puzzle part here is US dollar index futures, with leading lag 40 days; it correlates with Dow very well (86%). And because in this particular case the lag is LEADING, we can prolong dollar index (DX #F symbol) into the future and accordingly use it as a forecasting tool; you can see it on the chart above. Another leading indicator here is INVERTED futures for 10 y bonds (QTY #F symbol). Thus we try to forecast Dow using other financial instruments (dollar index or bonds), this is the core of intermarket analysis. The main goal here is to find LEADING financial instrument as only leading indicators can be used as forecasting tool.
And here is a problem. It looks like the most tradable instruments do not have leading indicators; they have lagged indicators only. It does have some sense: the most traded instruments come first and define patterns that will be repeated later by other financial instruments. They are the first ones, they are the most profitable. In context of that the classical approach to the intermarket analysis looks quite useless if we try to forecast the most tradable instruments (it is my opinion, and I could be mistaken). If our goal would be different - not looking for a good forecasting tool, but doing something else, like searching analogies between different financial instruments, - we could be satisfied with that classical approach. So, I was looking for the solution to this problem. This is how a new module, "Cycles library", has appeared. Here we apply a totally different approach to intermarket analysis based on the projection line.
Projection line that can be generated by Timing Solution gives a new breath to intermarket analysis. In this new module we conduct intermarket analysis using projection lines. Instead of financial instruments used to forecast Dow (in our example above), we use the projection lines for these financial instruments. Because a projection line can be prolonged into the future as long as we need, we can use them for the forecast. And it does not matter now, what kind of indicator it is, leading or lagging.
The "Cycles library" works this way:
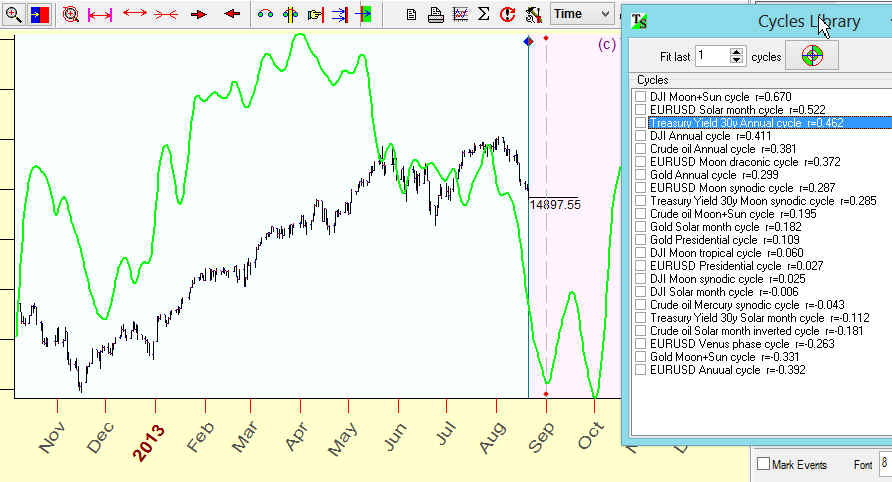
Running this module, you will see the list of cycles - projection lines, here they are:
You will see here crude oil Annual cycle, Solar month cycle, Mercury synodic cycle etc, different cycles calculated for different financial instruments - EuroUSD, Gold etc. We have chosen here the most reliable cycles only, and these projection lines are calculated till year 2120. (We chose cycles with good correlation and stable patterns during 3 or more years.)
As an example, we have downloaded Dow Jones Industrial index till August 21, 2013. The program analyses all these cycles and looks for the cycles that have the best fit to the latest movement of Dow. Last year it correlated well with the Annual cycle for 30 y treasury yield rates (green curve):
 .
.
This way we can reveal more complicated relations between different financial instruments. Plus because these cycles are prolonged into the future, they can be used as forecasting tools.
The main problem is to find financial instruments that reflect market moves in the best way and find proper cycles for those instruments. And, due to stock market changes that happen all the time, the cycles should be updated periodically. We continue research in this direction...
August 21, 2013
Toronto, Canada