TS precise charting module
This module allows to model price charting using fixed scale canvas. In other words, when 50-100 years ago traders worked with their price charts without computers, the only way to do that was using paper charting. Now, having our computers to help, we can do that much more easier and faster. However, there is one problem typical for computer charting - the price chart proportions usually change while you zoom your price chart.
Just for example, look at this ideal circle displayed together with S&P chart:
Let zoom this price chart a bit. Our ideal circle looks now as an ellipse:
It happens because the program is focused on zooming the time scale. We want to see more of the price chart. We can do that, as much as our screen allows, - though other dimensions become stretched. However, many Timing Solution users still would like to have fixed scales and be able to keep the price chart figures' original appearance (like an ideal circle, 45 degrees angle, square) unchanged while doing some manipulations with the price chart. This module is developed for that purpose - to model paper charting.
Initially I had no intention to do it as my major interest was (and is!) a projection line. Then, when I started to develop this module trying to reproduce Gann charts, I figured out that paper chart really contains some information that becomes hidden if we display this chart on a computer screen changing some proportions of the chart. This is not just some data set (which would be enough for projection line modeling), it is also a kind of geometric beauty, stock market geometry. And it can bring some information as well. Though it was not my main focus in developing Timing Solution software, I have decided to develop this module for users who practice stock market geometry and include its elements into their trading plans.
Fast example - reproducing Gann's chart for soy beans futures
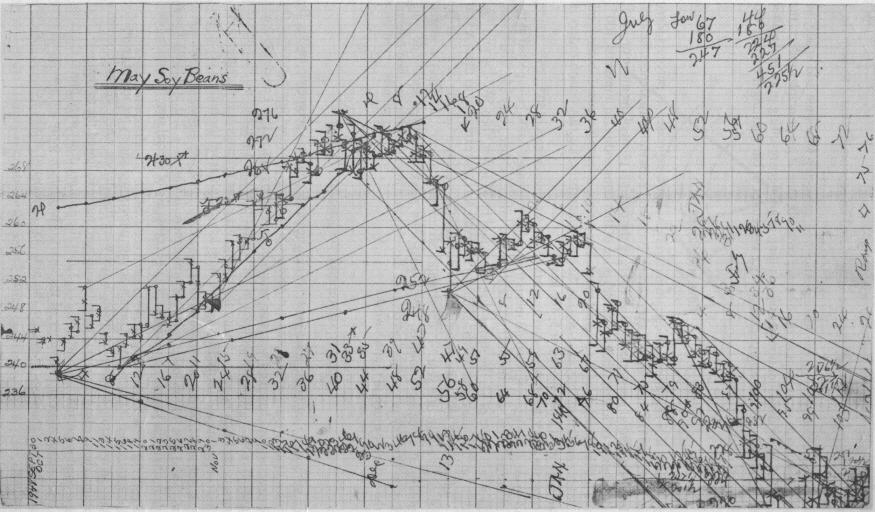
Let's reproduce Gann's chart for soy beans futures.
This is the original price chart (decreased in size):
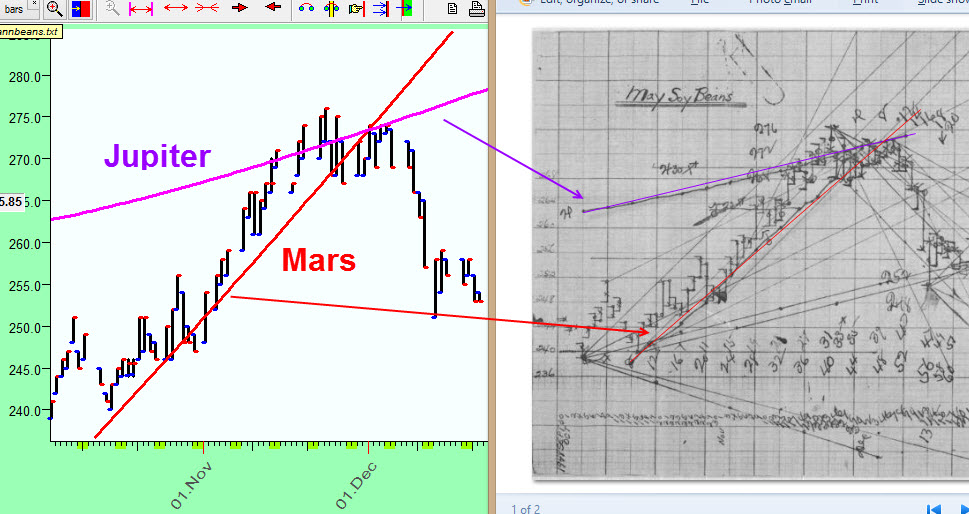
I will show here how to build this price chart reproducing the same sizes and proportions. Gann angles will be reproduced here; for astronomy based planetary lines, see Olga Morales' classes.
Here they are, two astronomy based lines -Jupiter and Mars planetary lines:
We start with paper properties. The original is made on 1/8 inch square grid paper:
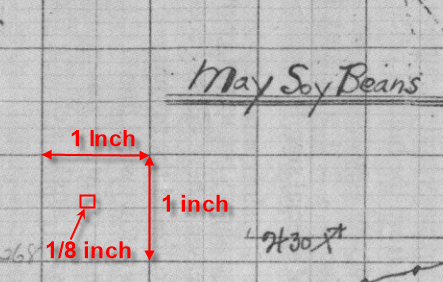
Such paper is very convenient for this price chart: 1/8 inch corresponds to one trading day (horizontal time scale) here, and 1/8 inch corresponds to $1 of price change (vertical price scale).
Look at this one square:
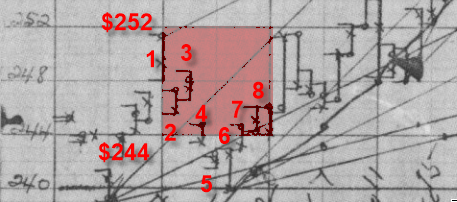
This one inch square covers 8 trading days and $8 price interval since $244 till $252.
Ok, now download this price chart (I could not find the data for 1948, so I took it directly from the paper; it explains some possible small discrepancy with the original).
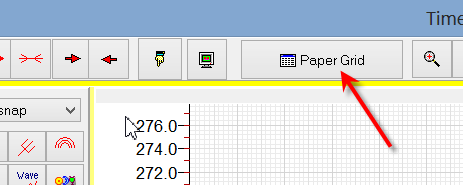
Run "TI" -> "TS Precise Charting" module and click this button there:
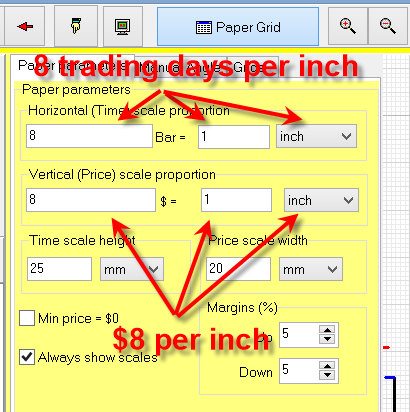
Define price and time scales there (8 trading days per inch) x ($8 per inch):
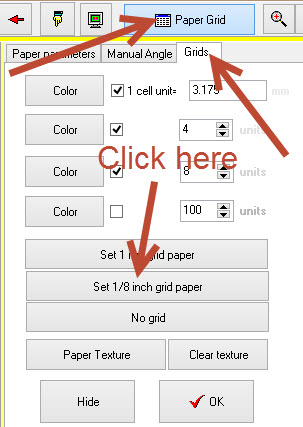
To display paper grid in "Grid" tab, click "1/8 inch grid paper" (you can define any grid here):
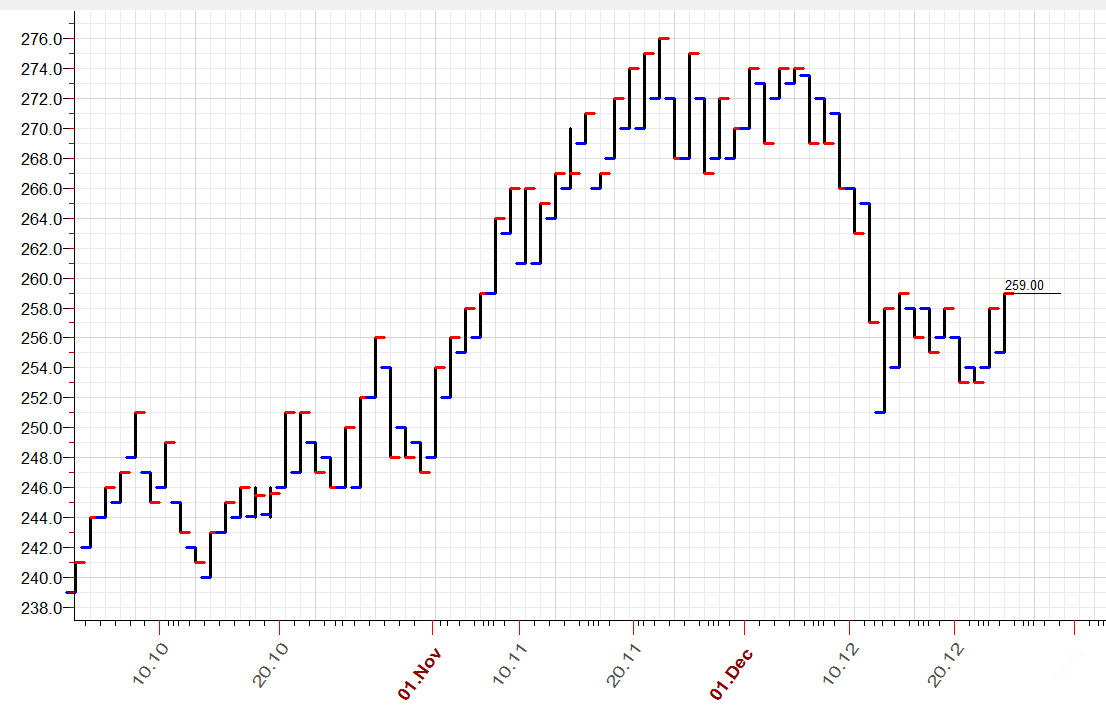
This is how our Gann's soy beans chart looks:
Next step is to draw angles. I will show how to do some of them. All other angles can be done exactly in the same manner.
Let's start with this angle:
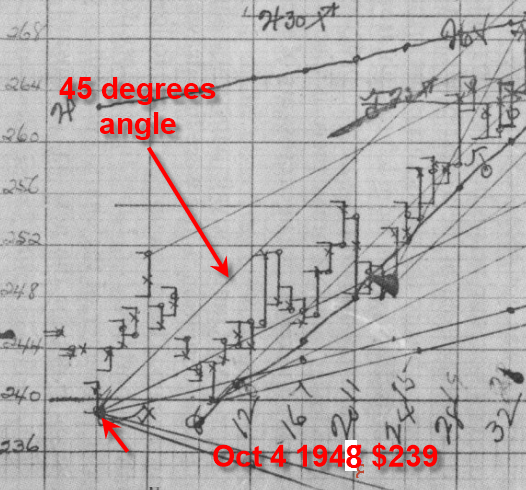
It starts October 4,1948 at the price level $239. No doubts this is 45 degrees angle or $1corresponds to 1 trading day here; we call these angles 1:1.
To draw these angles, follow these steps:
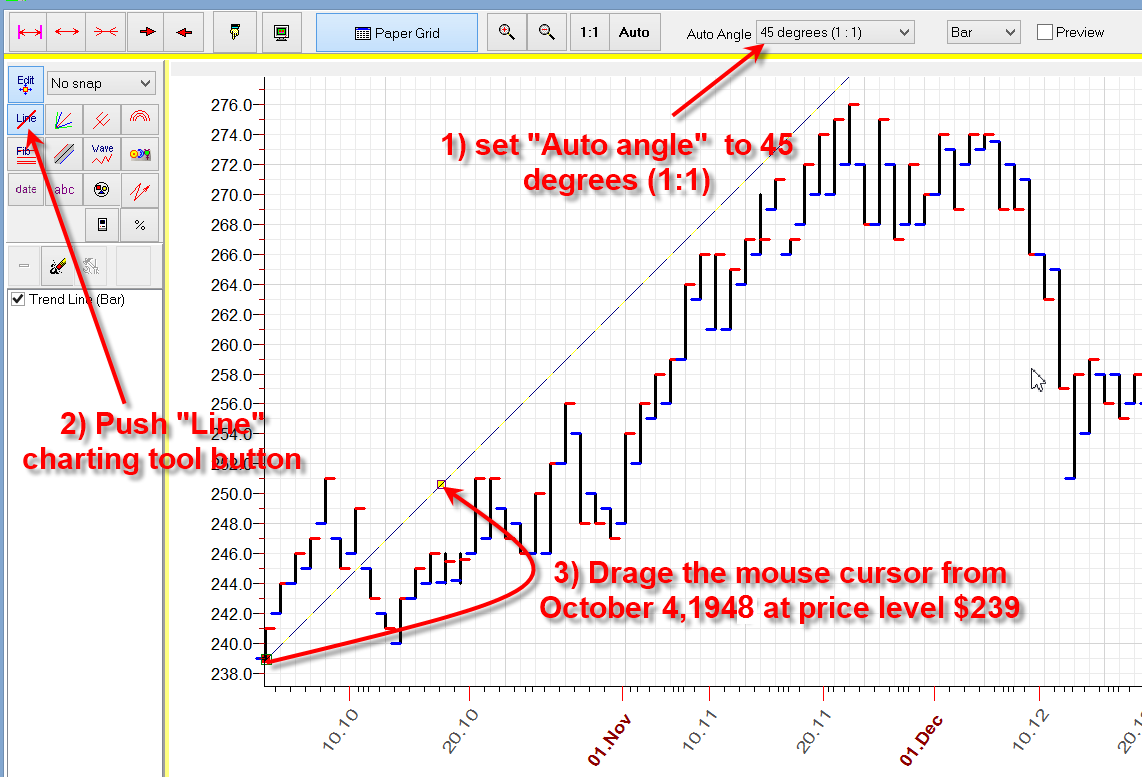
While you move the mouse cursor starting from October 4,1948 at the price level $239 (the starting point is your first anchor), the program automatically sets the price level in a way to get the exact 45 degrees angle. This is how "Auto angle" mode works: it automatically sets the price level for a second anchor to obtain the exact angle.
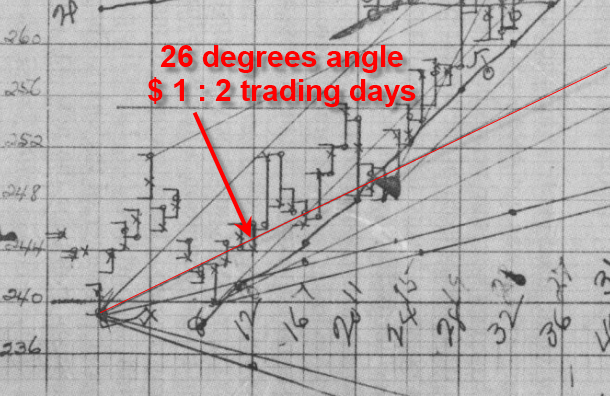
Next angle is 26 degrees angle with another proportion, 1 price unit corresponds to 2 time units, i.e. $1 : 2 trading days or briefly 1:2
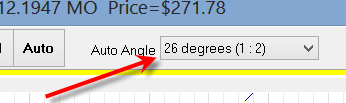
Set this angle in Auto angle option:
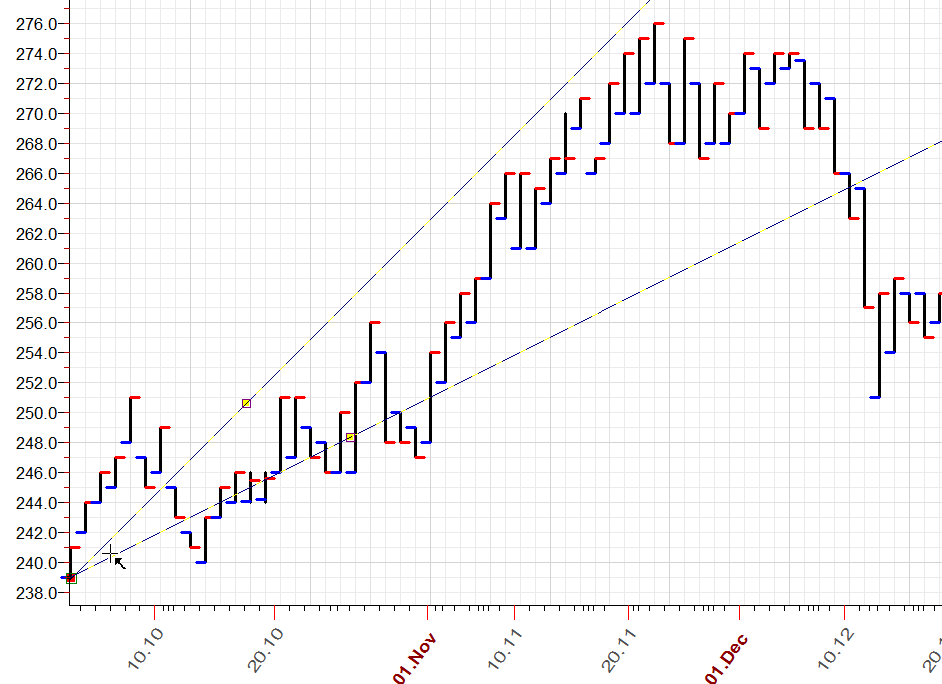
and draw it in the same manner:
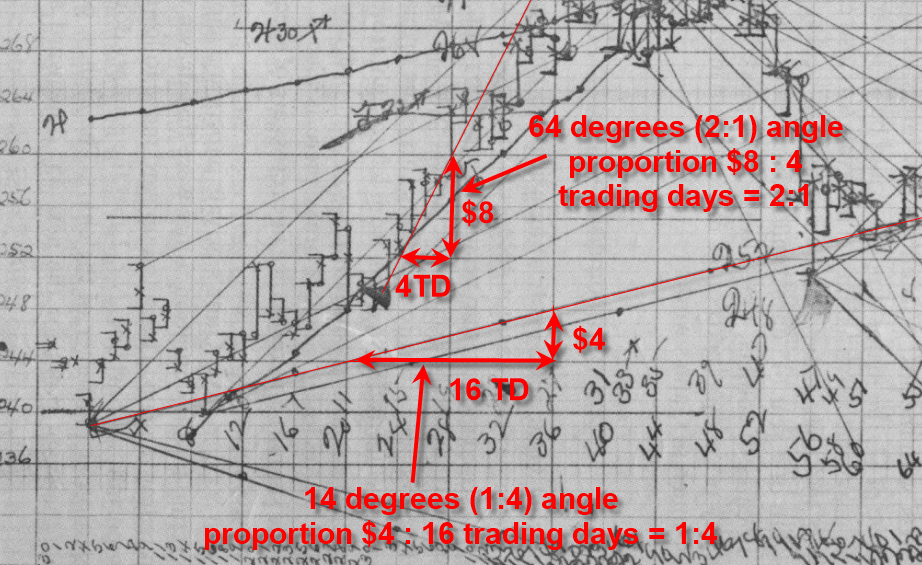
The same way we draw all other angles. We calculate a proportion for the angles, set this proportion in Auto angle and draw them. The most important is to find the right angle (proportion) for the angle you plan to draw. I take this proportion from the price chart:
This is how our charting work looks (decreased size):
To have more authentic experience, please try this button (decreased chart, the full size chart is here):
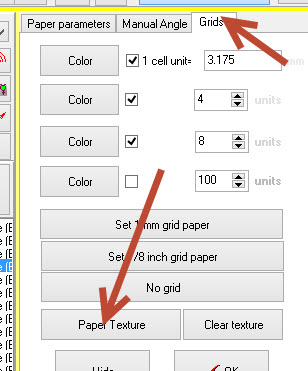
There you can choose the texture of your paper:
Here you can download Timing Solution worksheet with this chart.
Some useful hints
Scrolling big charts
You see, the price chart is displayed with real scales, exactly as a paper chart. And the problem is: sometimes the "paper" price chart needs a lot of paper, while we can see only a portion of it on the screen. You can scroll this big chart dragging the mouse cursor over this chart (both in horizontal and vertical directions), or you can use these scroll boxes:
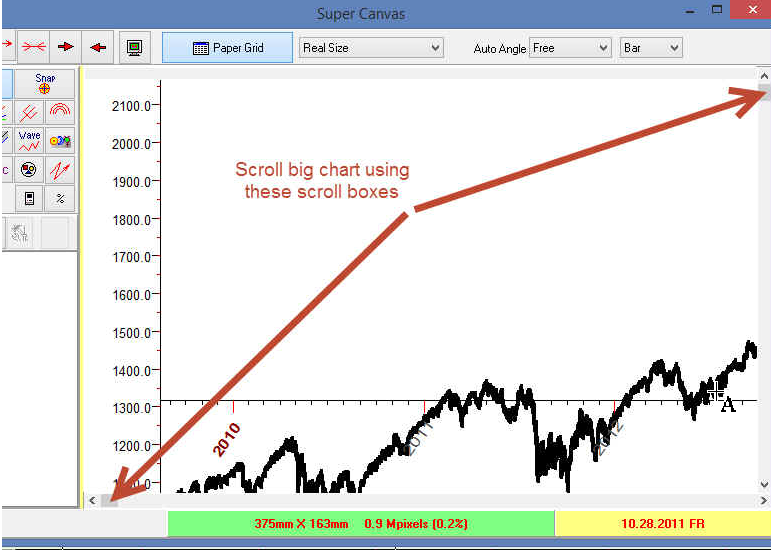
By the way, here ![]() you can see the size of this electronic "paper".
you can see the size of this electronic "paper".
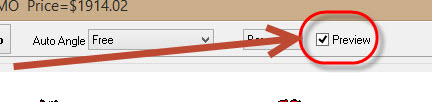
Preview Window
Setting the preview option ON you can choose the piece of price chart that will be displayed in your paper chart:
It works this way: by dragging the mouse cursor, you choose the time interval that will be displayed on the paper chart. The selected interval is highlighted by yellow bar and the new paper chart is immediately re-drawn:
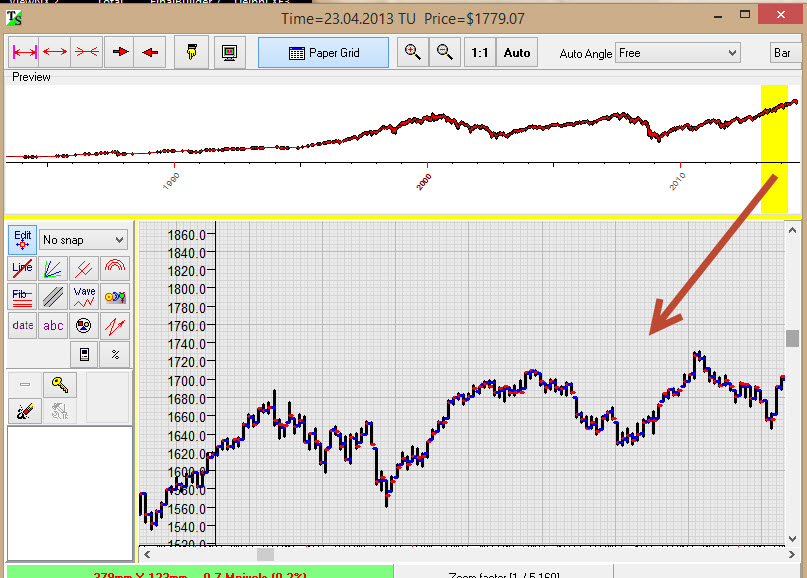
Pay attention: while you choose the new viewed interval, the canvas size is changing according to the covered time interval and the price range within this interval. This is natural because we model the real paper chart. Users often are confused by this fact.
You can use "Zoom in/Zoom out" button to adjust this size to your screen size or apply auto zoom option.
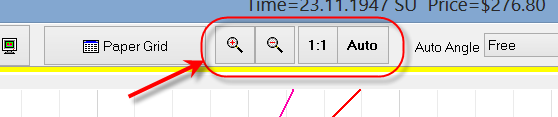
Zooming:
You can perform zooming procedure. For example, you can proportionally change the size of the price chart canvas. To perform zooming, use these buttons:
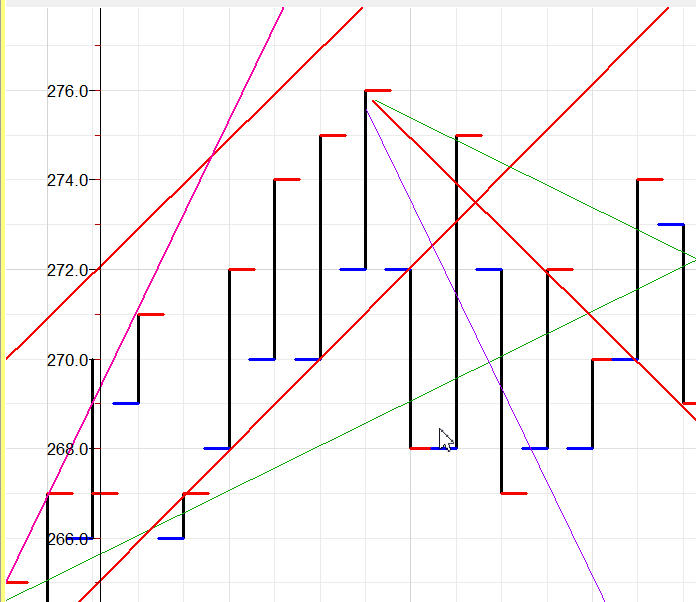
For example, by clicking minus button I proportionally decrease the canvas size to see the whole chart:
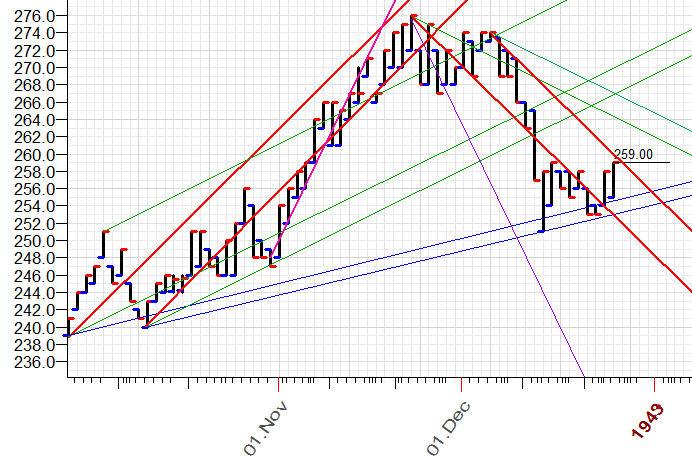
And vise versa: to see a detailed chart around the major top ($276), I have pressed plus button several times:
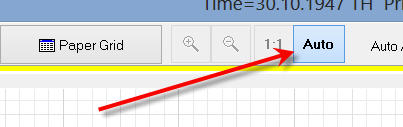
Auto scaling
You can set auto scaling option, and the program automatically rescales your price chart to maximize the usage of all available screen space. The program automatically finds the best scaling coefficient here:
How to modify charting tools
To modify any charting tool (like change its color, perform squaring procedure) you need to highlight it in this list and click one of these buttons:
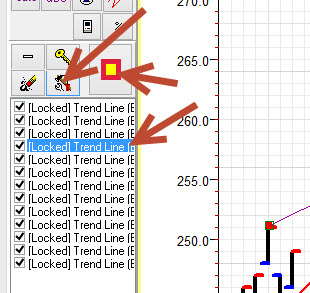
There is a problem there. We may have many charting tools on our chart (like on the example below). Sometimes it is not easy to tell what line in the list corresponds to one or another charting tool on the price chart:
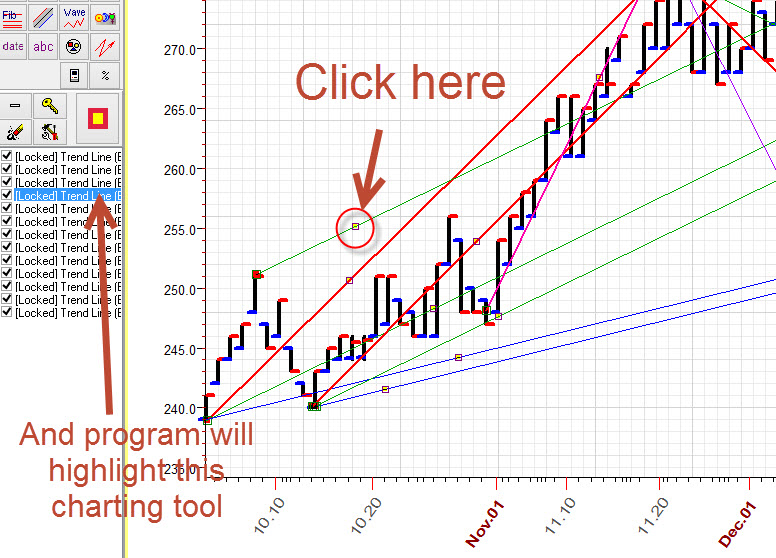
To solve this problem, press on the small anchor on your price chart. The program will automatically highlight the corresponding line in the list. Then you can edit this line if necessary.
Squaring paper
Suppose we choose two turning points. Now we draw rectangle charting tool using these turning points as anchors:
The question is: we need to find the parameters for the paper in a way to be able to convert this rectangle to ideal square. How to do that?
It is simple. Highlight this charting tool, click squaring button and
choose this item there: 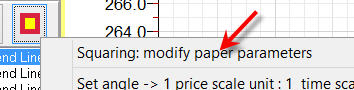 :
:
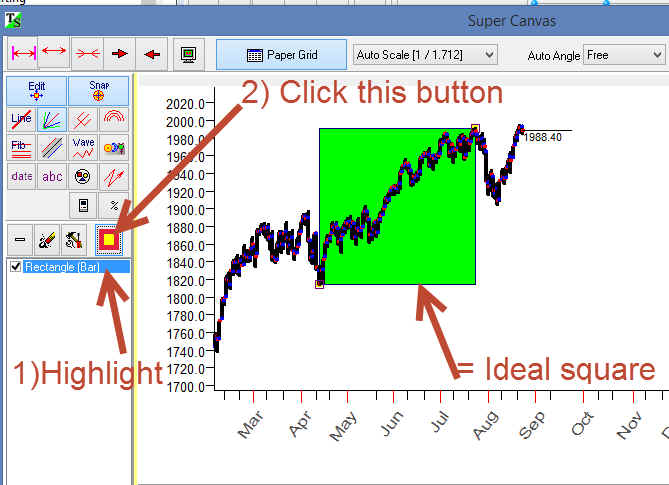
The program sets the paper scale $2.49=1 mm:
Squaring charting tools
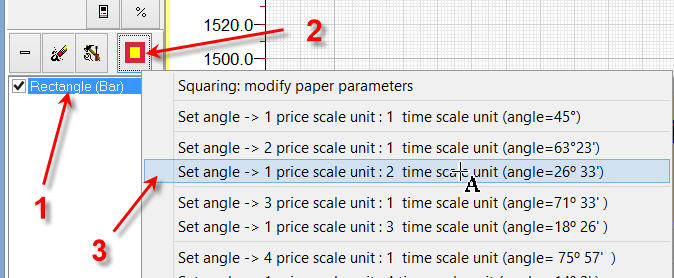
There is another possibility: suppose you have already created some charting tool and now need to modify it to get the charting tool with right proportions, like this 1:2 rectangle figure:
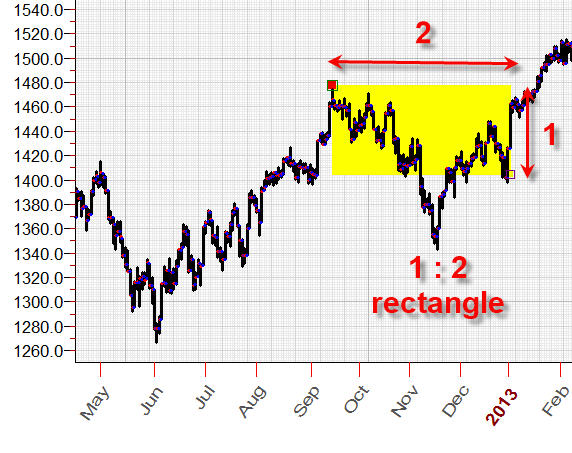
In order to do that: 1) highlight the charting tool you need to modify; 2) click "Squaring" button; 3) in popup menu set the desired proportion for your charting tool:
Snap mode
To draw a charting tool precisely, "Snap" feature is recommended:
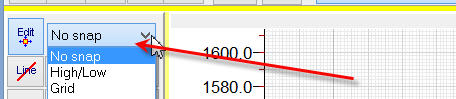
"High/Low" option allows to catch the nearest high/low price level (the program automatically sets the anchor to the nearest high/low while you draw your charting tool).
"Grid" option allows to adjust the anchors to paper grids.
September 2, 2014
Toronto, Ontario
Canada