TS Market sectors module
General idea
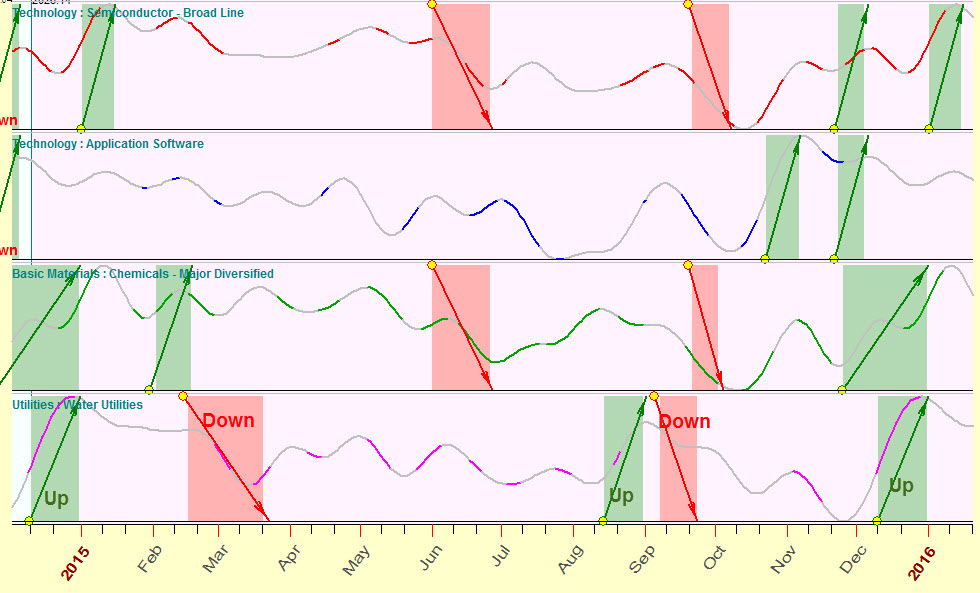
This module allows to conduct the cyclical analysis for different industries as a whole (not for just one specific financial instrument, but for the whole bunch of financial instruments). This is the typical output of this module:
Four diagrams here show seasonal cycles for four different industries: water utilities, chemical - major diversified, application software, semiconductor broad line. The green zones here correspond to the periods when the price for stocks of the companies in this industry tends to go up, while red zones are when the price tends to go down.
The advantage of this approach is the fact that these projection lines are based on real stock prices, we do not use here any composite indicator. For example, to analyze aerospace and defense industry, we can use Dow aerospace & defense index ($DJUSAE) or ETF ITA index etc. These indexes help us to understand the investment perspectives of any chosen industry - should we invest in semiconductor or health care or retail or some other industry.
In this module we introduce a different approach based on real price history of companies that form this industry, not composite indexes. For example, to analyze aerospace & defense industry, the program downloads the historical price charts for 58 major companies in this industry (like Bombardier , Lockheed Martin etc.). Here the are:
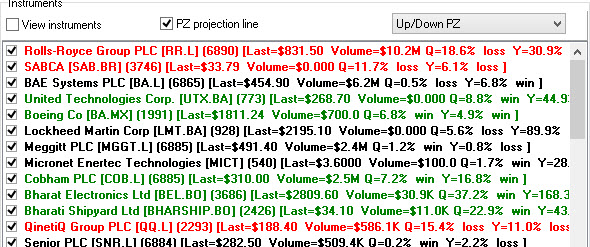
The program analyzes the price history for all these 58 companies and calculates the averaged Annual cycle for this aerospace & defense industry. Here it is:
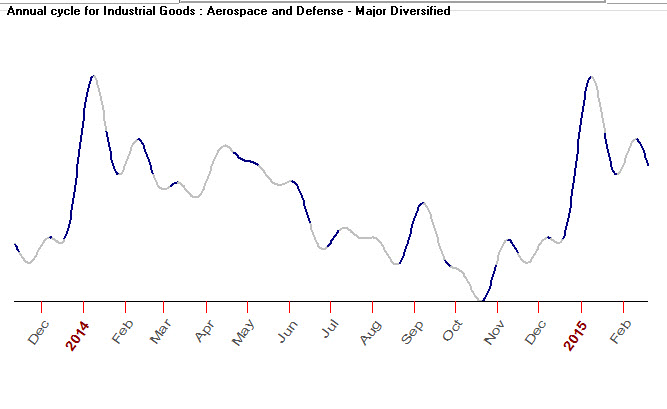
What does this diagram tell us? It tells us that there is a good opportunity to invest in this industry buying stocks in the end of October when the price for majority of these shares is low and sell them just after the New Year.
Can we trust this seasonal strategy? You can get the answer to this question quickly: simply drag the mouse cursor from the bottom in October to the top in January, and the program conducts complicated statistical calculations for this strategy (it is done practically immediately as the speed of those calculations is very high) and gives you a verdict. Here it is:
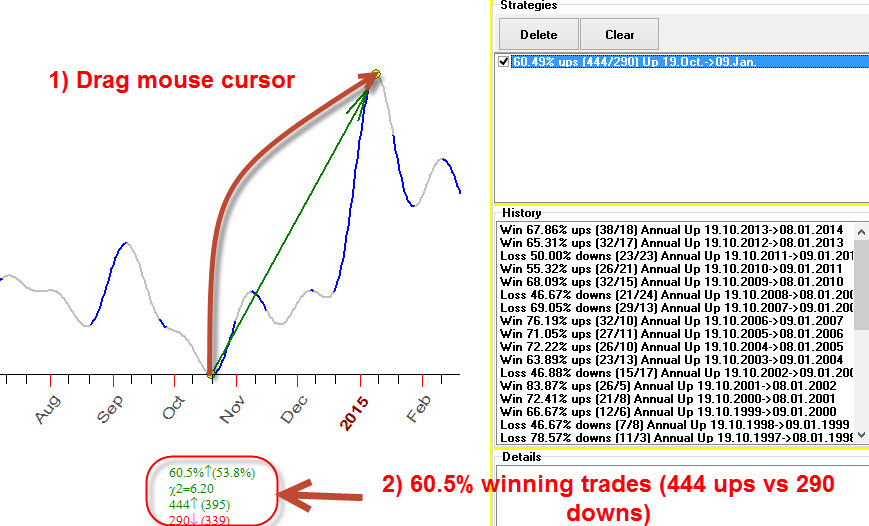
It tells us that historically if we would buy at the end of October and sell in the beginning of January we would win (i.e. the price goes up within these 2.5 months) 60.5% cases. For these 58 companies within the last 20 years, the price went up 444 times versus 290 times down. This information is displayed here:
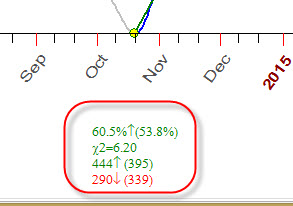
Pay attention, 53.8% number in brackets shows the averaged price movement within 2.5 months. In other words if we buy the shares from aerospace & defense industry any day of year and sell them in 2.5 months we will win 53.8% times only. It means that this seasonal strategy is more profitable than 2.5 months of buy and hold strategy.
Next recommended step is to look how this seasonal strategy has worked in the past years 2014, 2013, 2012, etc. (this class is written in December 2014). Simply highlight the record in "Strategies" list and in "History" you will see year-by-year report for this strategy:
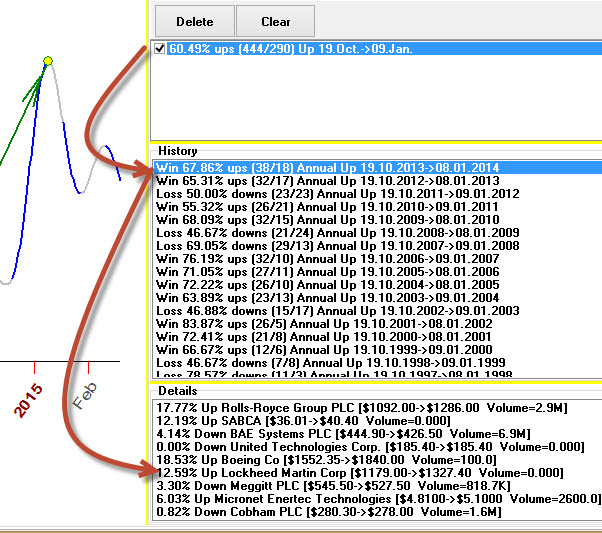
You see that in 2014 this strategy (buy October 19 2013 and sell January 8 2014) gave us 68% winning trades, in 2013 65% etc. Details of the profit (loss) for each company is shown as well.
The advantage of this approach in comparison to the usage of standard indexes is that we have an additional dimension here that allows to estimate the risk. The index can move up because the shares of a small amount of major companies go up while not so valued companies do not show this tendency. Plus this approach allows to analyze more price history as standard indexes are restricted in time. For example $DJUSAE index is available since the beginning of 2000 while companies that form this index have much more price history.
By simple dragging of the mouse over Annual chart, we can easily build a seasonal strategy for the whole industry, like this:
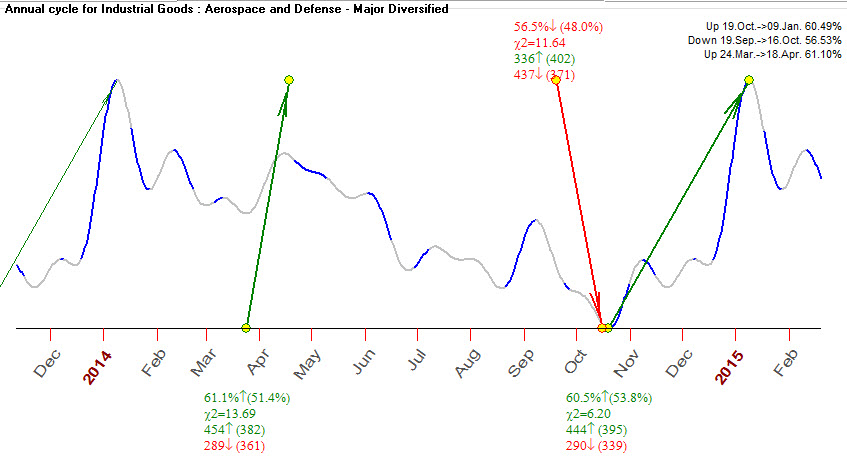
There are two long strategies here (expecting the price going up): buy Oct 19 -> sell Jan 9 of the next year (60%), buy March 24 -> sell April 18 (61% of winning trades); and one short strategy (expecting the price going down): September 19 -> October 16 (56.5% downs).
Also, we can build these seasonal charts for different industries like picture below (it shows the seasonal strategy for 12 different industries). Obviously this chart can be used for your sector rotation trading plan.
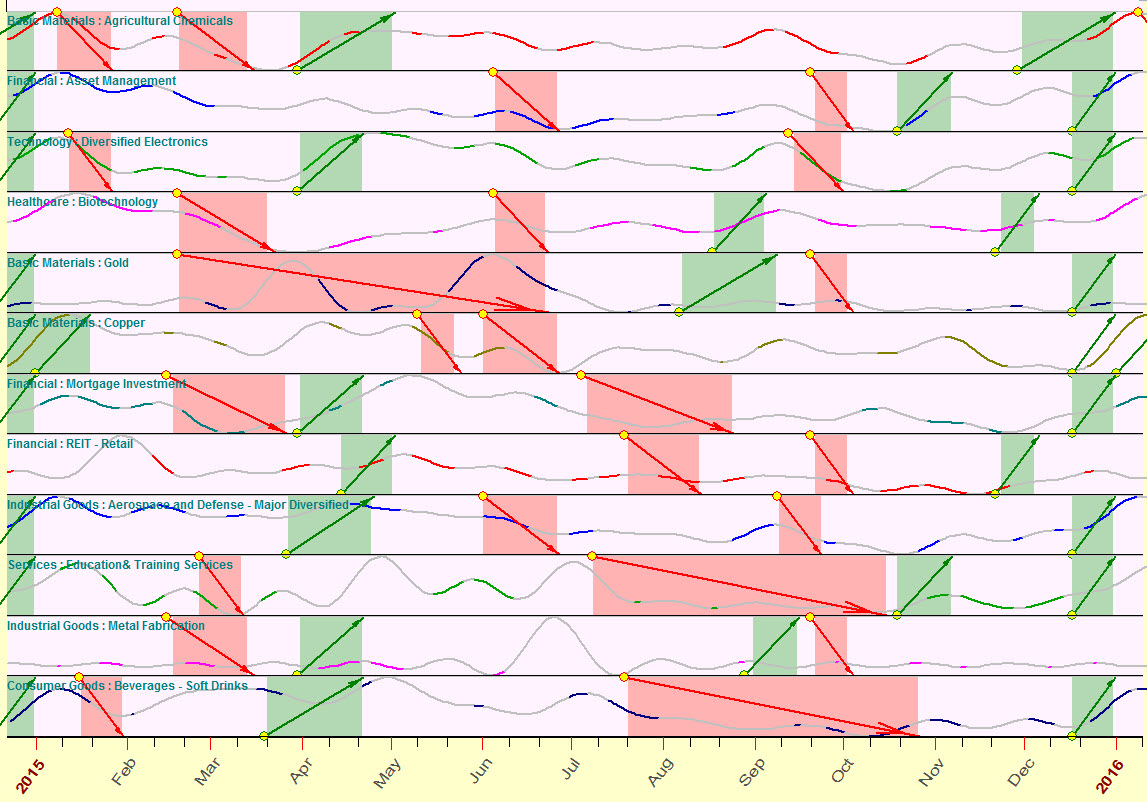
Moreover you can incorporate some other cycles that may help in your trading decision.
For example, try Moon phases (why not!) cycle. As you see on the chart below, the price usually is higher around the New Moon:
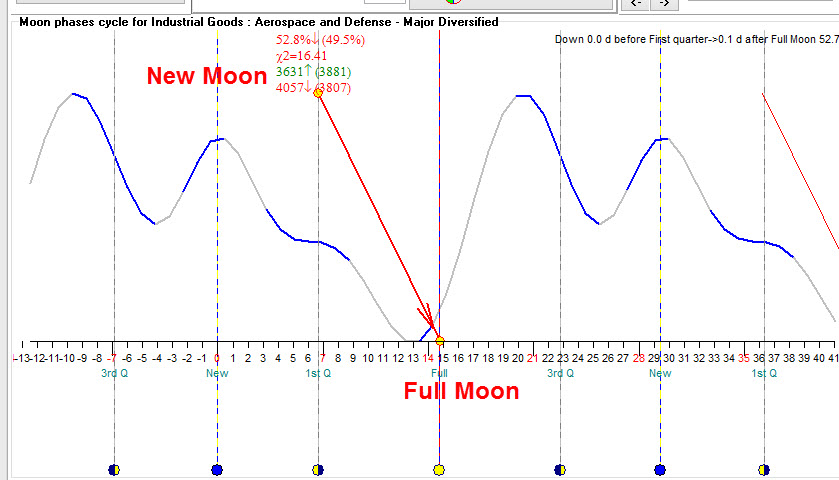
This strategy itself cannot be used as the only factor for your trading decision as it gives us only 3% of useful information; however, you should definitely keep it in mind. This chart tells us that for this industry the price tends to go down during the week between the first Moon quarter and the Full Moon. You can name this fact as coming from astronomy/astrology/astrophysics; for me, this is a statistically verified fact.
Another fundamental cycle that should be kept in minds is 4-year US Presidential cycle. This is how it looks for aerospace and defense industry:
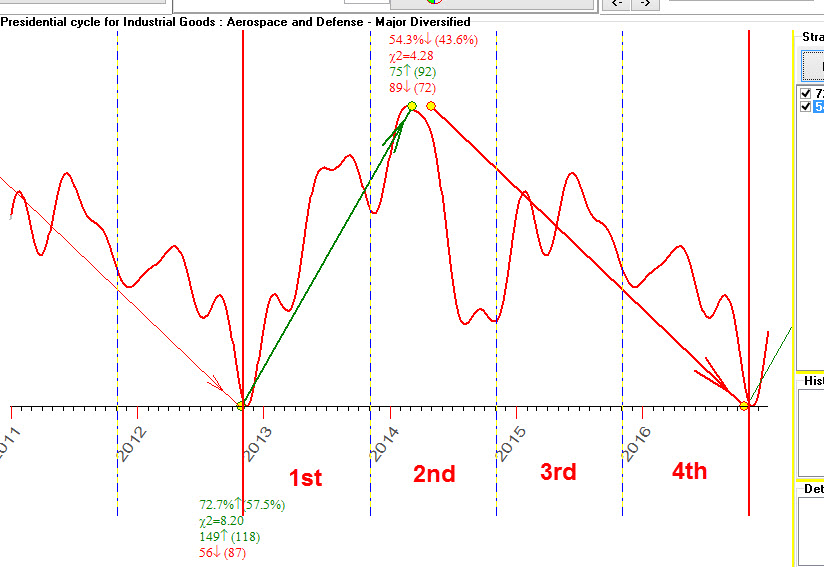
You can see that for the first 15 months after the US Presidential Election the aerospace and defense shares tend to rise up in 72.7% cases (149 ups vs. 56 downs).
These three cycles mentioned above (Annual, Moon phases and US Presidential Election) are recommended to all industries. However, though some of these cycles may provide similar pictures for each industry (which is especially true for US Presidential Election cycle), the degree of importance of these cycles is different. As an example, for agriculture chemicals industry sector, the Presidential Election cycle is not so strong as it is for aerospace and defense.
How it works
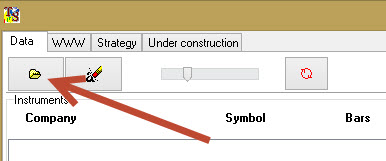
This module has been developed as a tool to pick up stocks. Suppose you are looking to buy some stock. We assume that you have already conducted some research regarding this stock from the point of view of technical/fundamental analysis. We do not discuss this subject as there are a lot of different approaches there. Our goal now is to gather the additional information regarding this stock, from the point of view of sectorial and seasonal analysis. I run TI->TS Market sectors module and click this button to choose the sector and industry of your stock:
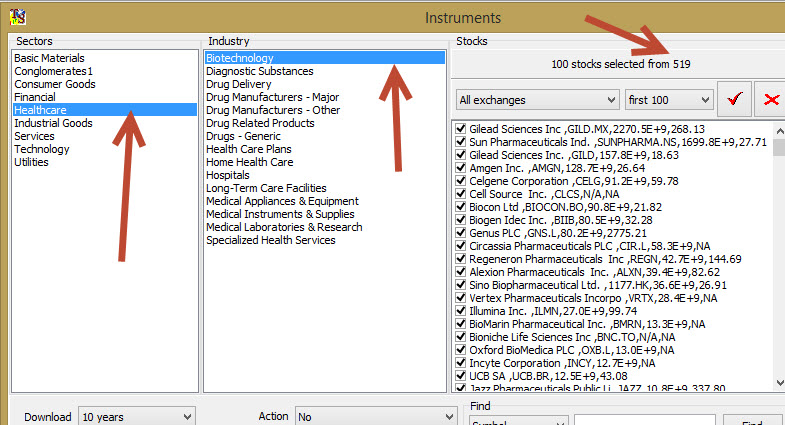
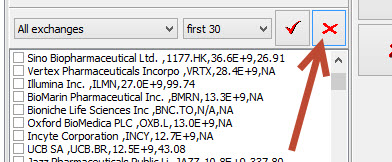
The left panel has a list of market sectors to choose from. As an example, I have selected "Healthcare" sector. The program shows as well all industries of this sector. My point of interest is "Biotechnology". I've highlighted this industry, and program shows 519 listed stocks in this industry (the list follows Yahoo Financial info):
You can narrow your selection by exchange. For example, you may choose only NYSE listed stocks. In order to do that, uncheck all stocks clicking this button:
and after that: 1) choose NYSE exchange; and 2) click  button:
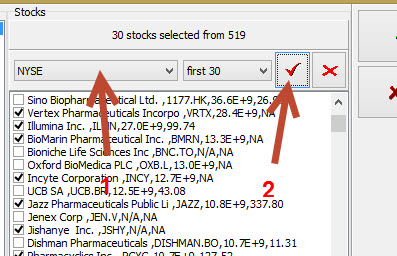
I recommend to check these stocks manually if you prefer to concentrate on stocks of some particular country as one and the same stock can be listed with different exchanges.
Wait while the program downloads the price history from Yahoo and does some calculations. Be sure that Internet is available on your computer, and it is fast enough. It takes some time while the program checks Annual and other cycles for the selected industry.
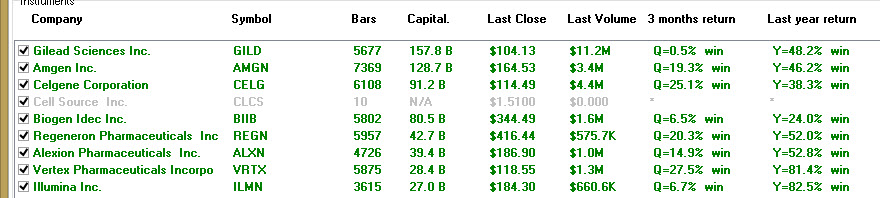
Then, the very first glance on the screen shows the industry's perspective as a whole. The industry in my example, Biotechnologies, is in a good condition now (look at its return for the last three months and the last year):
After the calculations, you will see in the Main screen the Annual cycle for that industry (biotechnology) as a whole:
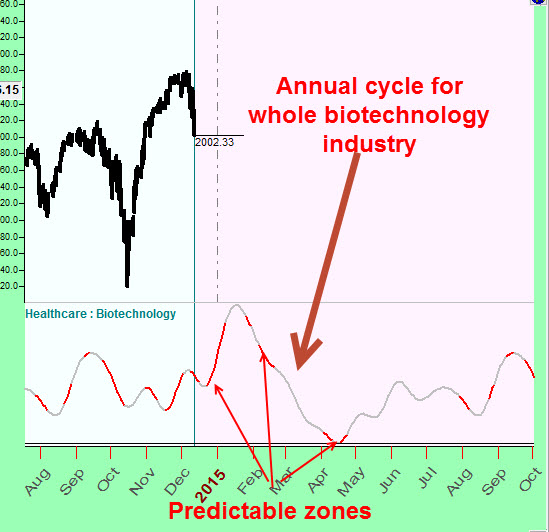
For my example, 39 stocks were used. For each one of them, the Annual cycle was calculated. And the summarized Annual cycle is shown in the Main window. Pay attention to red colored zones; they represent "predictable zones" of the Annual cycle. These are periods when this pattern is confirmed by majority of stocks of that industry.
Ok, in this particular example, it looks like now is the time to buy these stocks (it is not a trading advice, it is just some information that you may want to consider in your decision making). You may decide to buy biotech stocks now and sell them later. If we choose this strategy, can we trust it?
Go to "Strategy" tab:
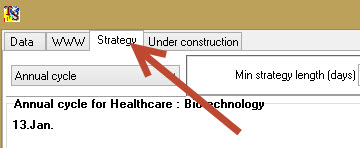
and drag the mouse cursor from December 15 to January 18 to see how this strategy works (the dates are chosen to cover the closest predictable zone):
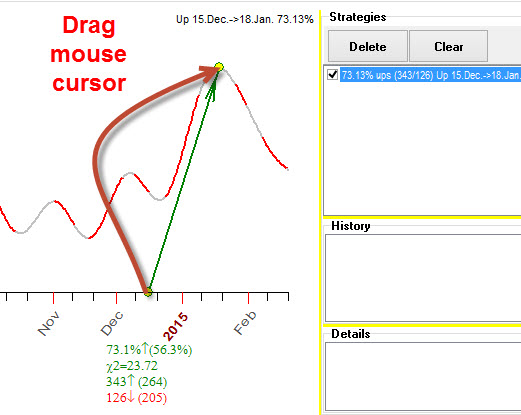
You see, historically this strategy shows 73% rate of winning trades. In other words if we buy stocks of this industry on December 15 and sell them on January 18, we expect to have 343 winning trades versus 126 losses.
Highlight this strategy to see how it (the strategy of buying on Dec. 15 -> selling on Jan, 18) has worked in the past (in the years 2014, 2013, 2012 etc.):
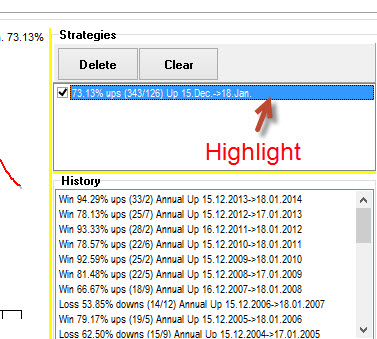
It worked very well even in the year 2008.
There is one more possibility: you can easily correct this strategy by dragging these small yellow anchors:
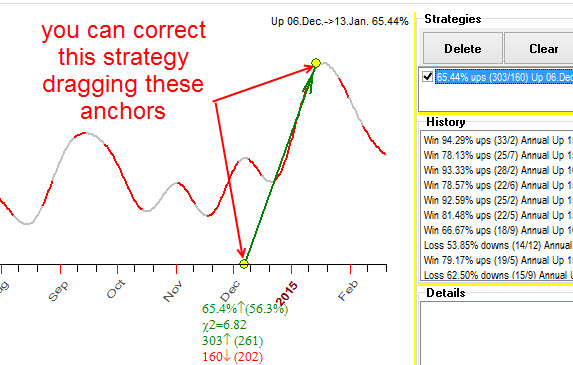
For example, the recommended strategy starts December 15. You may want to know how this strategy would work if you buy these shares on December 6 (not December 15). Simply drag a yellow anchor to December 6th date on the screen, and the program recalculates practically in a moment a new, corrected strategy. (By the way, I have spent a lot of time to speed up these calculations, and now the program analyzes all involved stocks at that same time while you move the cursor down the screen; you are able to see how this strategy works practically immediately).
You may delegate this task to the computer. Click this button, and program finds for you two best seasonal strategies for a selected industry:
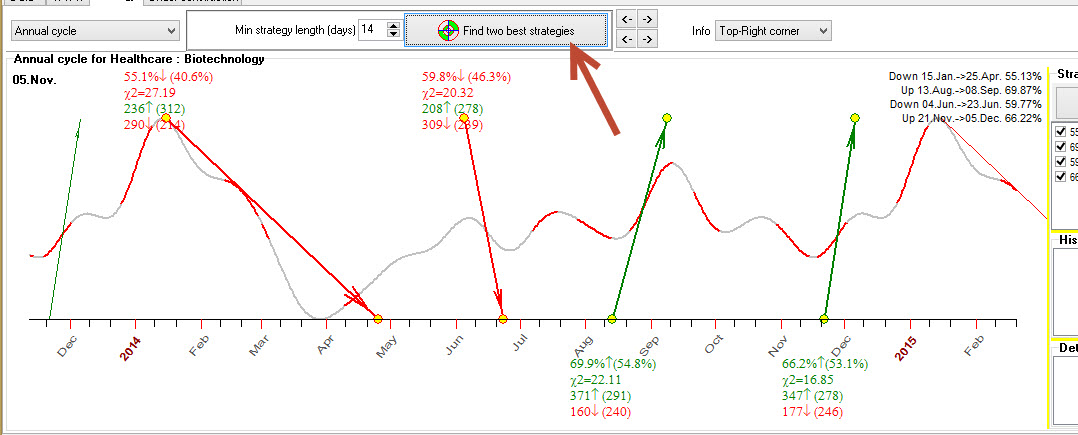
If you click this button twice, you will get four best seasonal strategies.
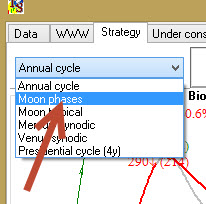
Now we can apply other cycles to this analysis. Choose the Moon phases cycle here:
You will see the averaged price movement of biotechnology companies within Lunar month: New Moon -> first Moon quarter ->Full Moon -> third Moon quarter -> next New Moon. This is a typical price move regarding Moon phases:
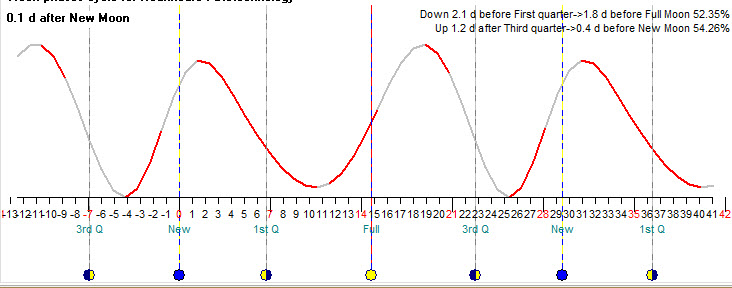
In average, around the New Moon the price usually reaches its peak. The period of this cycle is 29.53 days, which is very convenient for a swing trader. (I saw in some book on technical analysis the note that 28 days is an ideal trading cycle.)
According to my research, Moon phases cycle can add extra 3-5% to your rate of winning trades, i.e. it helps to trade on 3-5% better in terms of win/loss ratio. It means that Moon phases cycle itself cannot be used as a trading engine, and it cannot be ignored as well.
Click "Fast two best strategies" to get the ready recommendations regarding Moon phases, here they are for biotechnology industry:
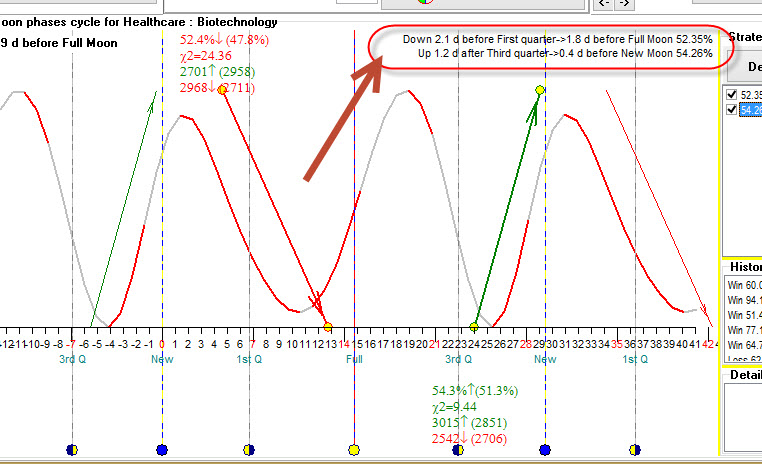
This is what the diagram above says to us:
1) price tends to go down 2.1 days before the first Moon quarter - 1.8 days before the Full Moon; this strategy adds 4.6% (52.4%-47.8%) to your win/loss ratio;
2) price tends to go up 1.2 days after the third Moon quarter - 0.4 days before the New Moon; this adds 3% to your win/loss ratio.
Sergey Tarasov
December 15, 2015
Toronto, Canada