Timing Solution stock pickup ideas (till May 2015)
Technical notes
Trading and investing are based on a very simple idea. If you are a trader, buy low and sell high. If you an investor, find a stock that is underestimated by other investors. buy it at low cost and then wait till it becomes high in value to sell it at its highest. And there are so many complicated tools that help in the process (technical analysis indicators, forecasting technologies, etc.). In general, when you have some financial instrument in your mind, there are tools to help you working with it: you can get its price history from data stream providers, you can apply different technical analysis and charting tools, you have a whole range of different analytical software. They even can help to determine when to buy and when to sell it. All that is good if you have some stock or other financial instrument in your mind. If you do not, a really big question is: what financial instrument to choose?
We want to demonstrate here the technology of selecting stocks based on sectoral cyclical analysis. Please remember that it is just an idea we would like to share with you and the technology illustrating how it can be done. The decision to invest in some stock or to trade it is yours, and yours only.
Step #1: Choosing industry
Start with choosing the industry that is more suitable for this season. Look at the charts at the end of this class; we have created for you seasonal charts for different industries. (You can create them yourselves with TS Market Sector Analysis module available as a part of Terra Incognita project.)
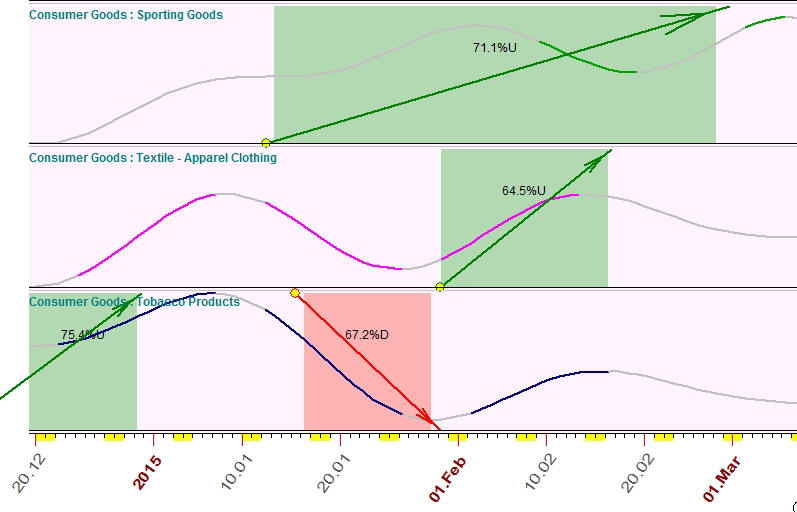
The charts are made on January 15, 2015, and we are looking for the optimal stock to trade. Actually, this time of year is the time when the stock market tends to go down, it is resting after the Christmas rally. The charts below have a lot of red bars that show downtrend. However, some industries do not follow that tendency. Look at these three:
The chart shows that Consumer goods: sporting good industry tends to go up since January 15 till the end of February. In 71% cases the price within this period went up.
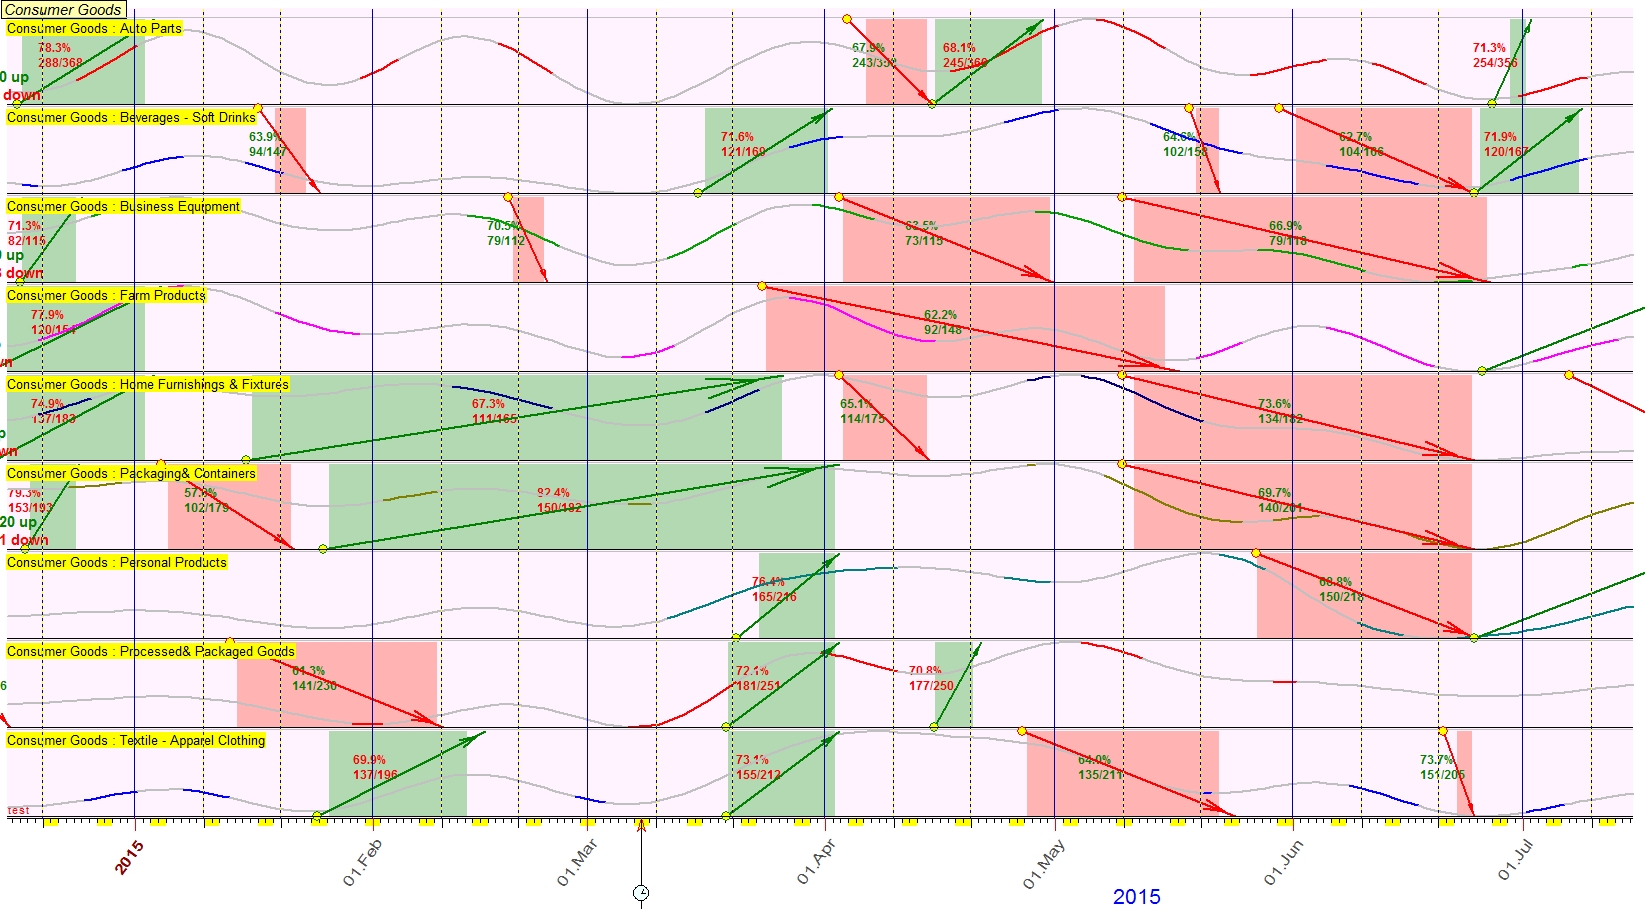
Consumer goods: Textile - Apparel clothing industry tends to go up since the end of January till the mid of February, 64.5% cases up,
The last chart shows that Consumer goods: Tobacco products industry tends to move down since January 19 till January 29.
It gives us some idea what stock we may want to trade and how. For example, buy some stocks from Consumer goods: sporting good industry around January 15 and sell them in the end of February. Or take a short position (if it possible with your broker for this stock) since January 19 till January 29 for the stocks from Consumer goods: Tobacco products industry.
The list of stocks for the chosen industry may slightly differ based on your data source. You may try to use Yahoo industries browser. It is here: http://biz.yahoo.com/p/s_conameu.html
Thus, using seasonal diagrams at the end of this class you may choose the most promising from the investor's point of view industry. Next step is to pick up a stock.
Step #2: Annual test for chosen stock
There are several rules here:
1) I recommend to check several stocks from the chosen industry
2) Downloaded price history should cover 3 years at least.
3) Annual pattern should be present in the price chart. This rule is important. Let me show several examples.
Let's start with a simple one. We were looking for a stock to trade last December. It was the time of Christmas rally, the strongest Annual pattern. A lot of industries show uptrend movement at this time of year, practically the whole services sector does that.
I have chosen the shipping service industry because it gave me the highest percentage (78% uptrend movements):
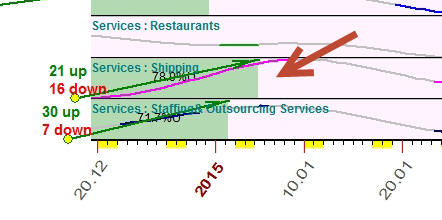
I have chosen Capital Products Partners L.P. (CPLP), The main reason why I've chosen that not expensive stock is the presence of Annual pattern there. I also watched its volume (within a month it varied in a range of 0.6M-3M - which is not bad) and its price chart (it looked good , not too choppy). Typically it is recommended to watch P/E ratio as well; I believe that in our case this is not so important as it is more a swing trading than a position trading. The presence of Annual pattern is more important here.
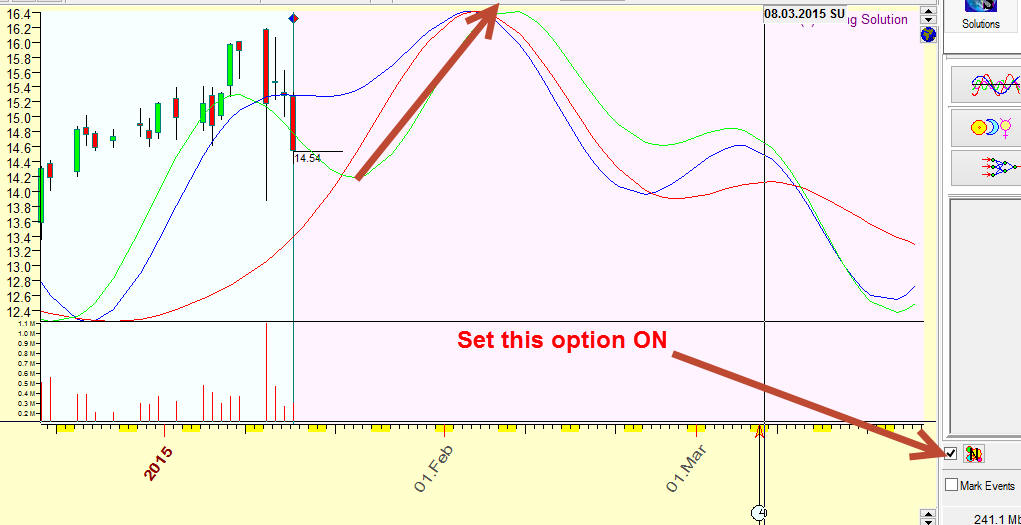
Calculate the Annual cycle for this stock, setting  option ON:
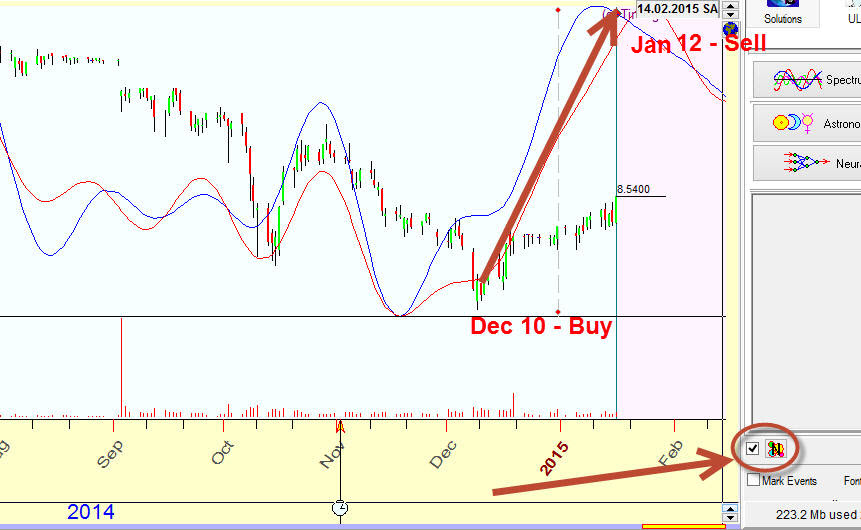
There are two Annual cycles here: red - fast Annual cycle, blue - Annual cycle based on the whole price history. Sometimes there are three Annual cycles (adding the green one based on the last 10 years of the price history). The rule is: all these Annual cycles should show approximately the same movement. In our case, we can buy on December 10 and sell on January 12 (the next year). Actually we could open a long position in the mid of November; I decided to open it in December.
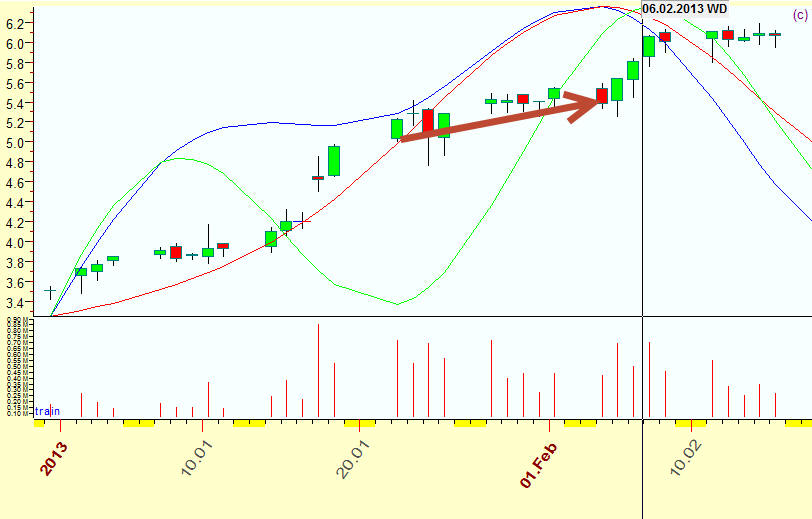
Why I have chosen that stock? Look how this pattern worked in 2014:
2013:
2012:
2011:
2010:
My assumption that that stock may perform in a similar way is valid. That is why I have chosen it.
It was a good example of picking up a stock based on Christmas rally Annual pattern.
Today is January 16, 2015, and it not so easy to find a rising industry in January. I have found this:
Of course, in this situation you may want to take a short position (if it is possible). I have selected Nautius Inc. (NLS) (sporting goods industry that is expected to go up).
The Annual cycle shows uptrend movement since January 21 till February 1.
Let us check how this Seasonal pattern works for our chosen stock. Simply look on the price chart how the price has moved from January 21 till the February 1 a year ago (i.e. in 2014):
Oops, it went down...
2013:
2012:
2011:
I recommend to perform Annual test for several stocks of the chosen industry. So, I have analyzed in a similar way Pool Corp. (POOL). The Annual cycle (buy January 20- sell February 1) shows: 2014 - loss, 2013 - win, 2012 -win, 2011 - win, 2010 - loss, 2009 - small win, 2008 - 25% win in 10 days, 2007 - win.
I like this stock more than the previous one though the fact that both these stocks generated losing trades in 2014 makes me worried.
So, it is not enough just to choose an industry. If you are not checking Annual patterns for individual stocks inside that industry, you can be in trouble. Even if we have found a stock with a steady Annual pattern, it would be good to confirm our choice with some other things.
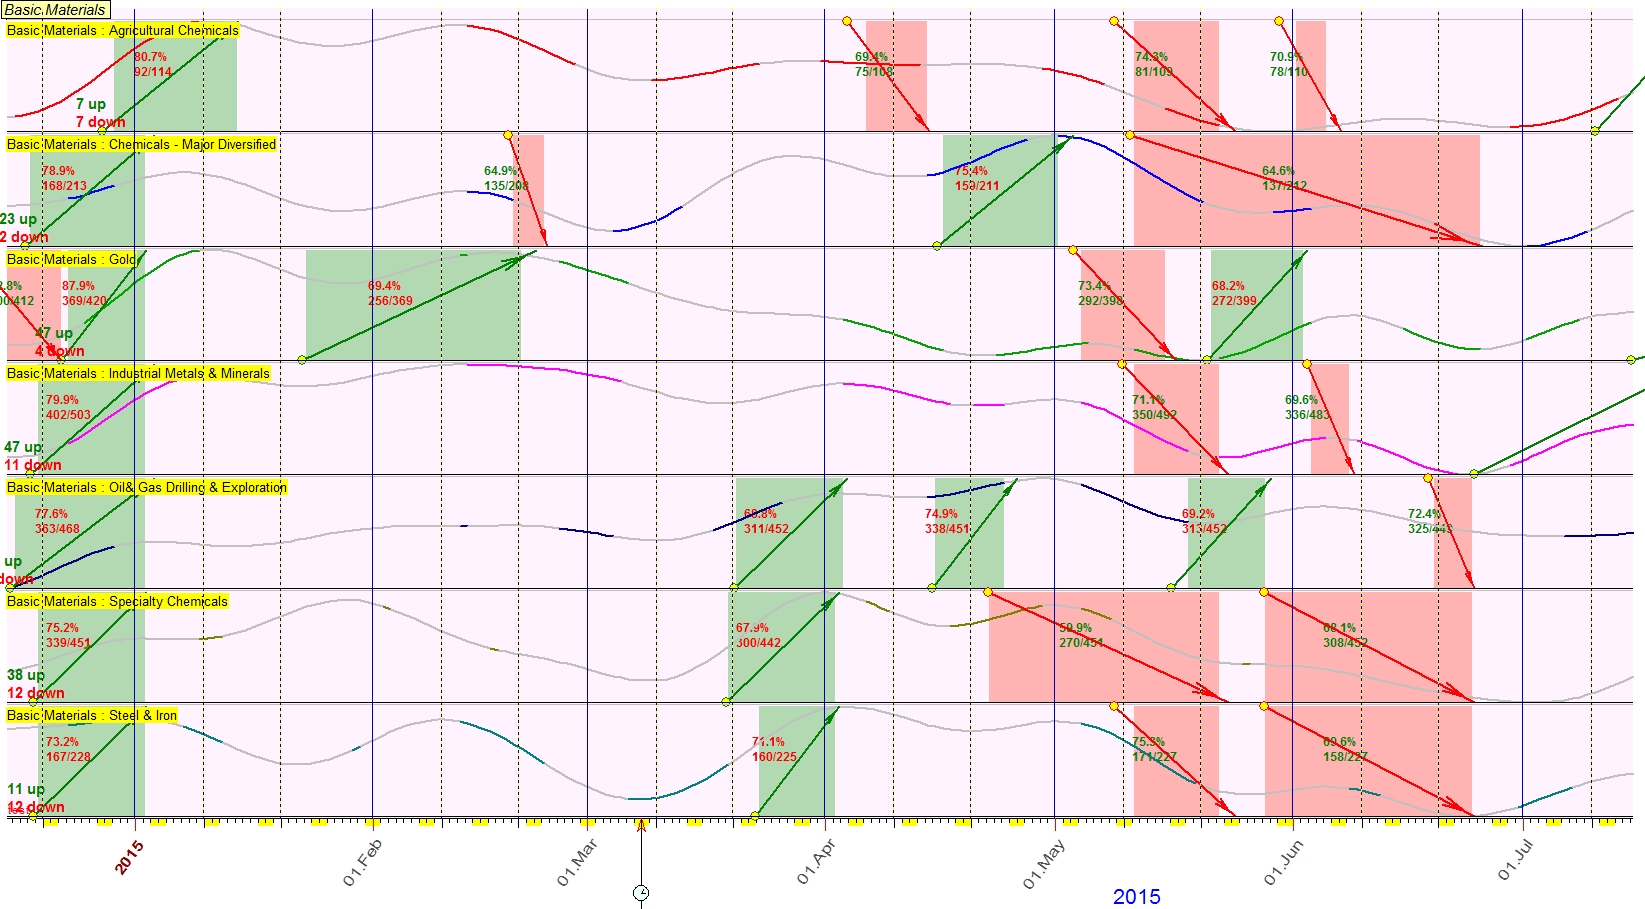
Seasonal cycles for different industries
Basic Materials
Consumer Goods
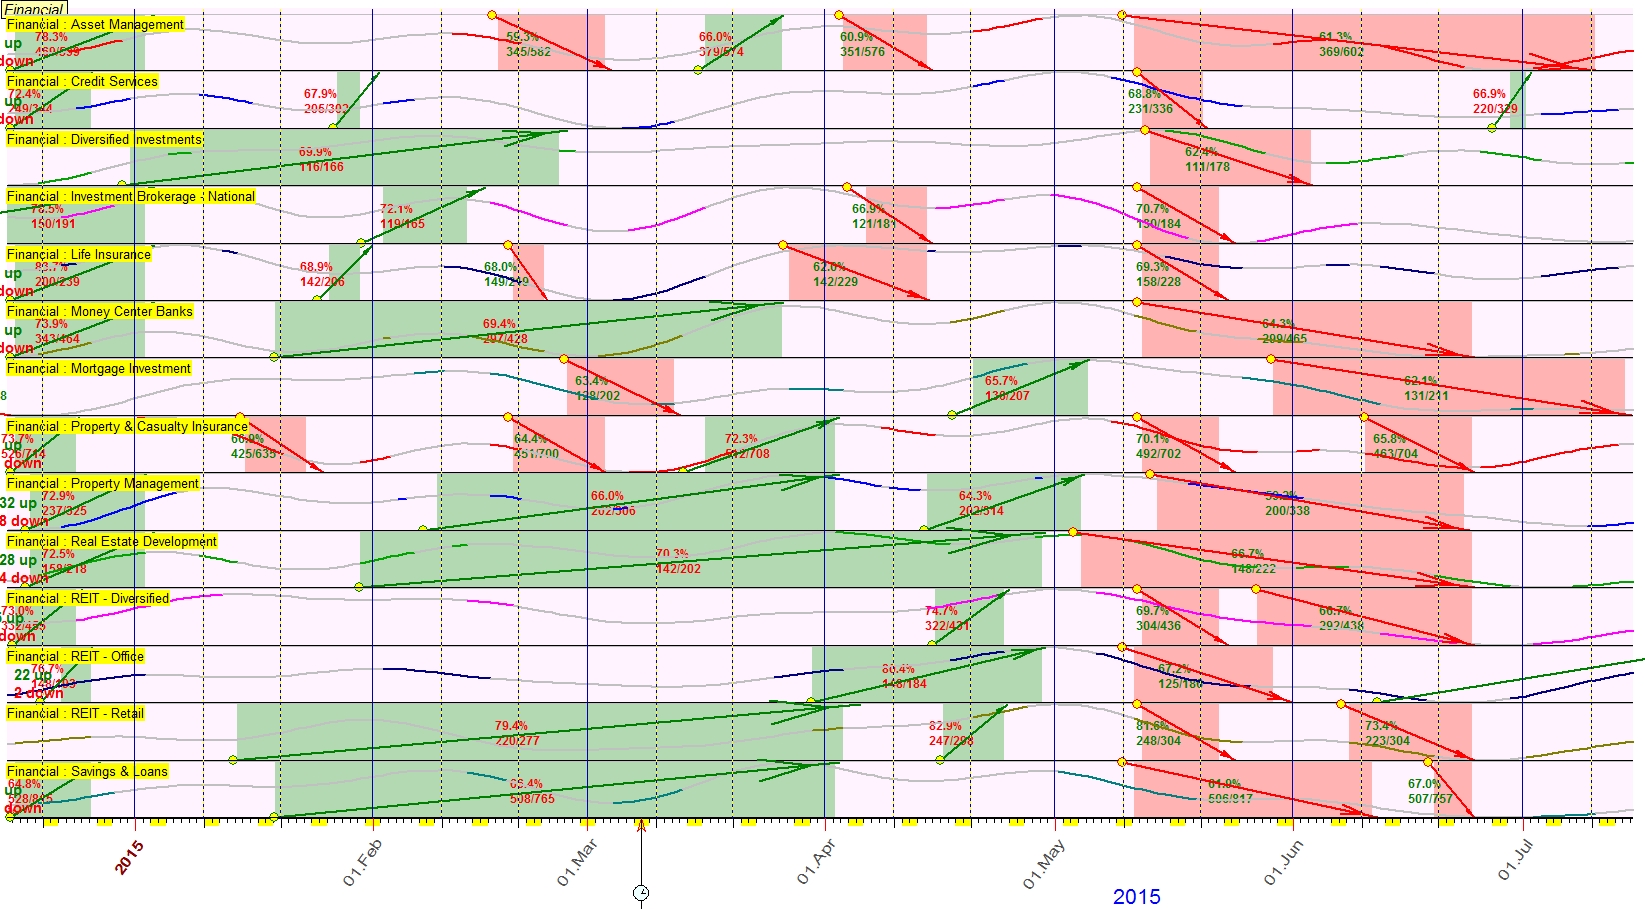
Financial
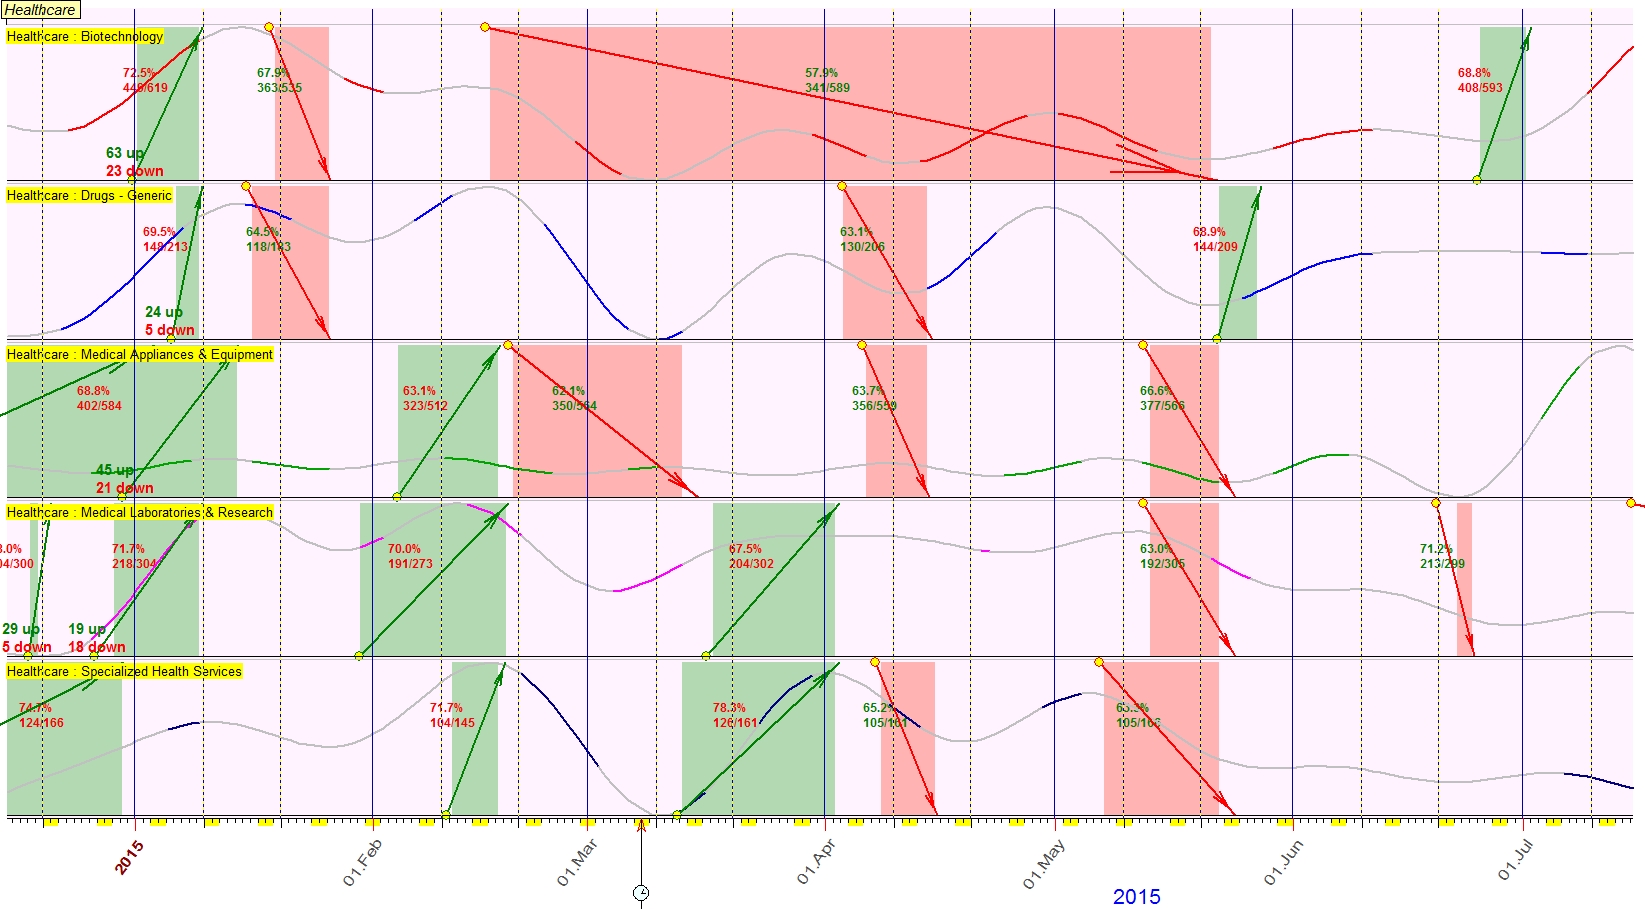
Healthcare
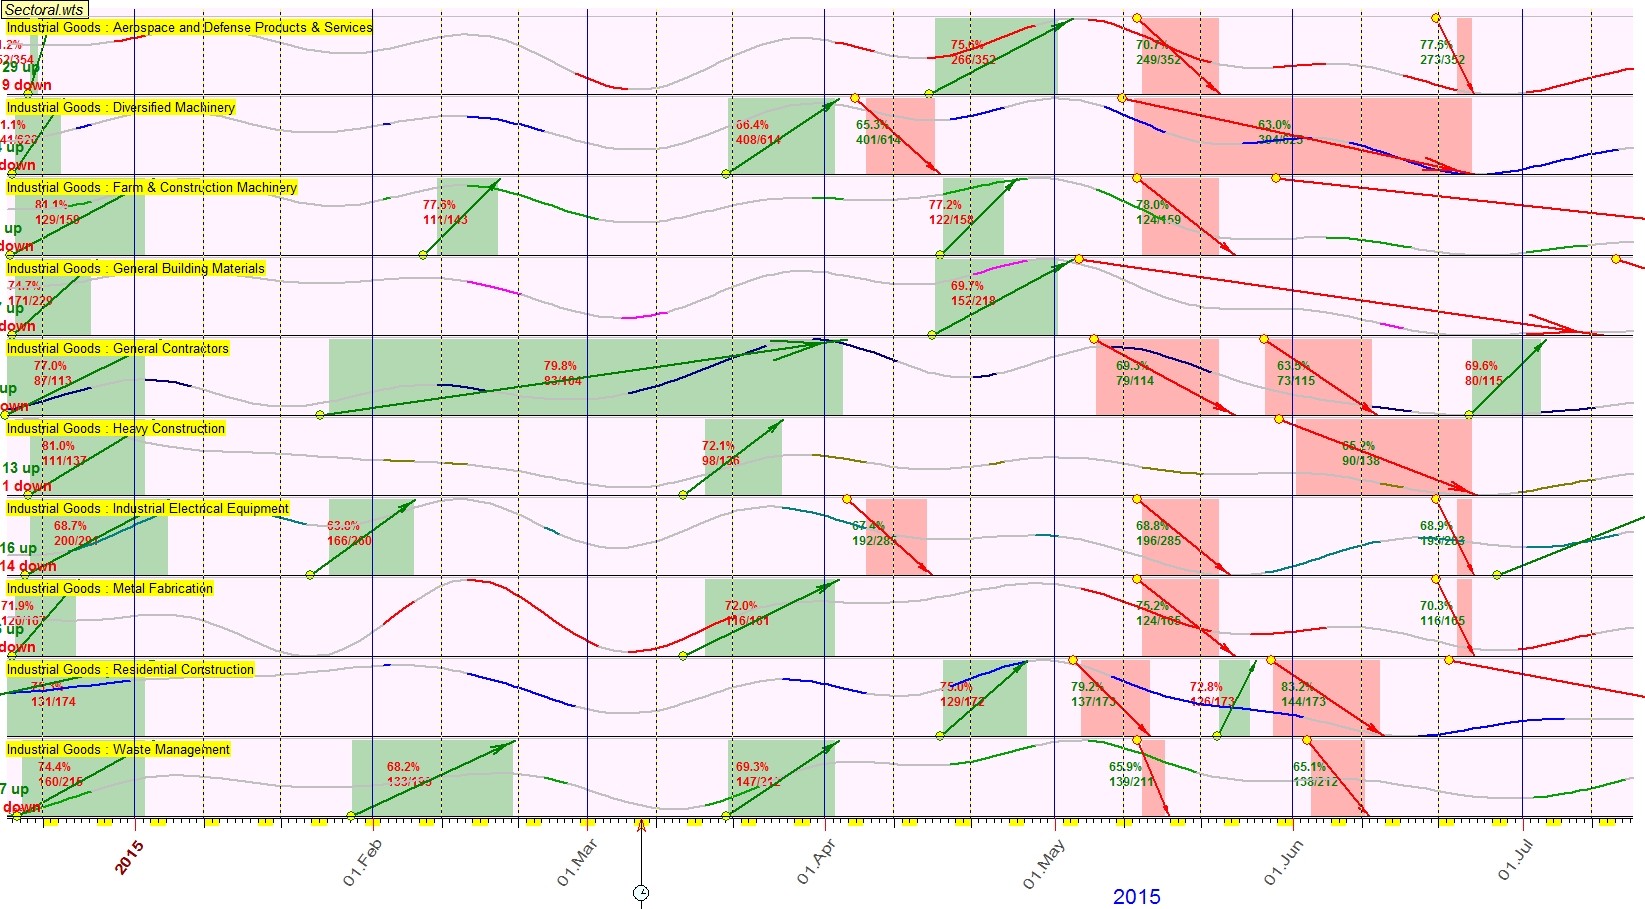
Industrial Goods
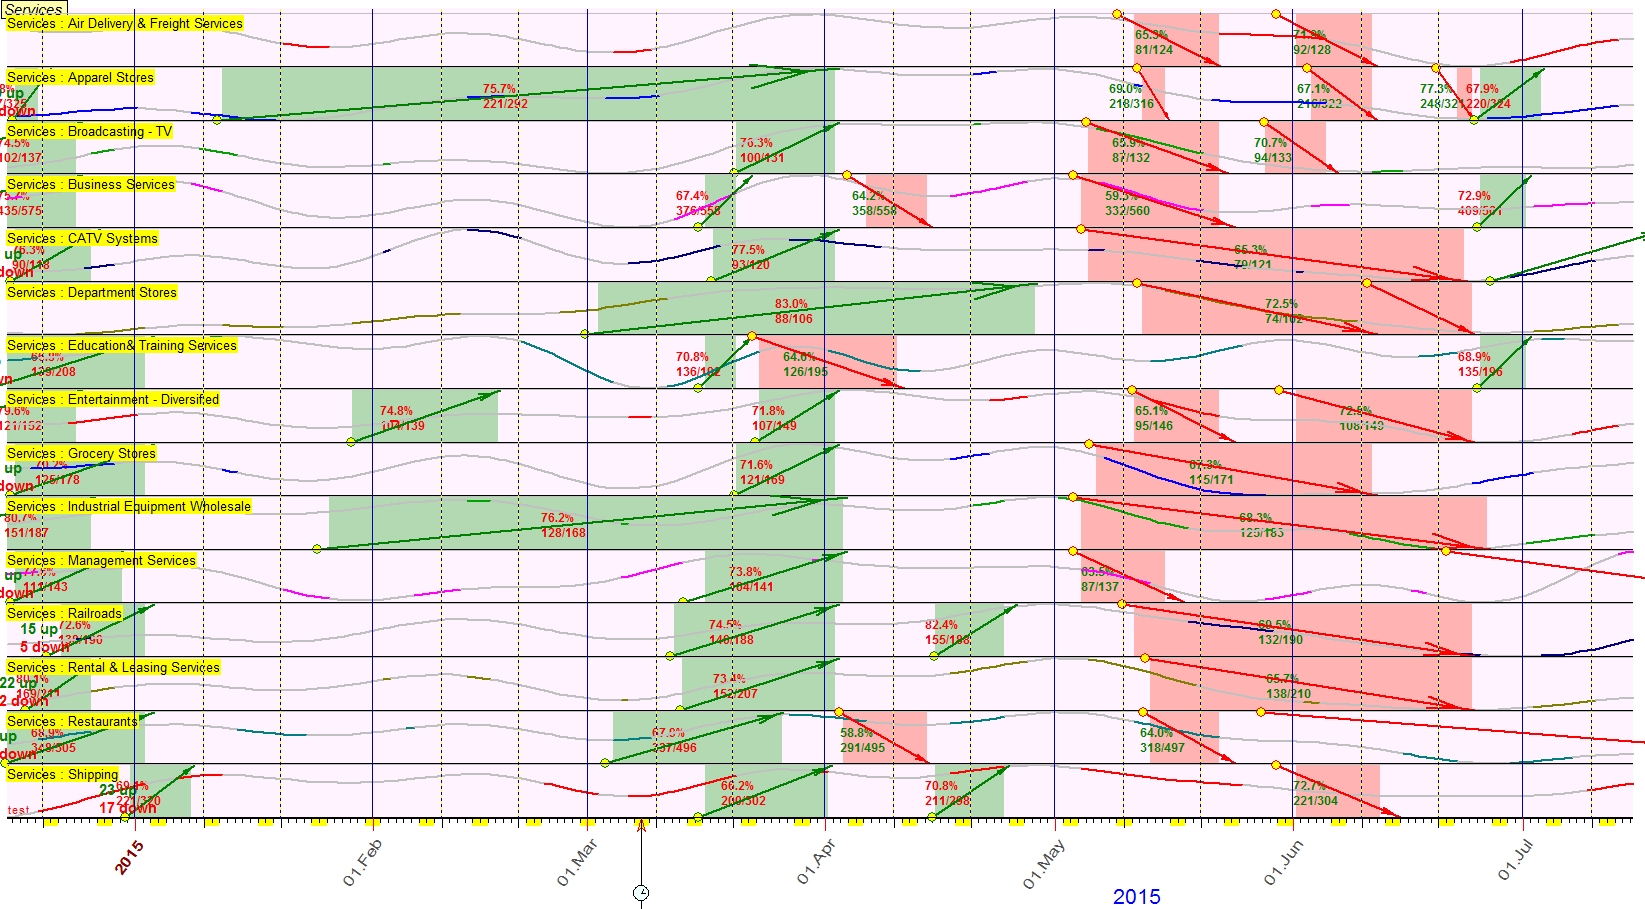
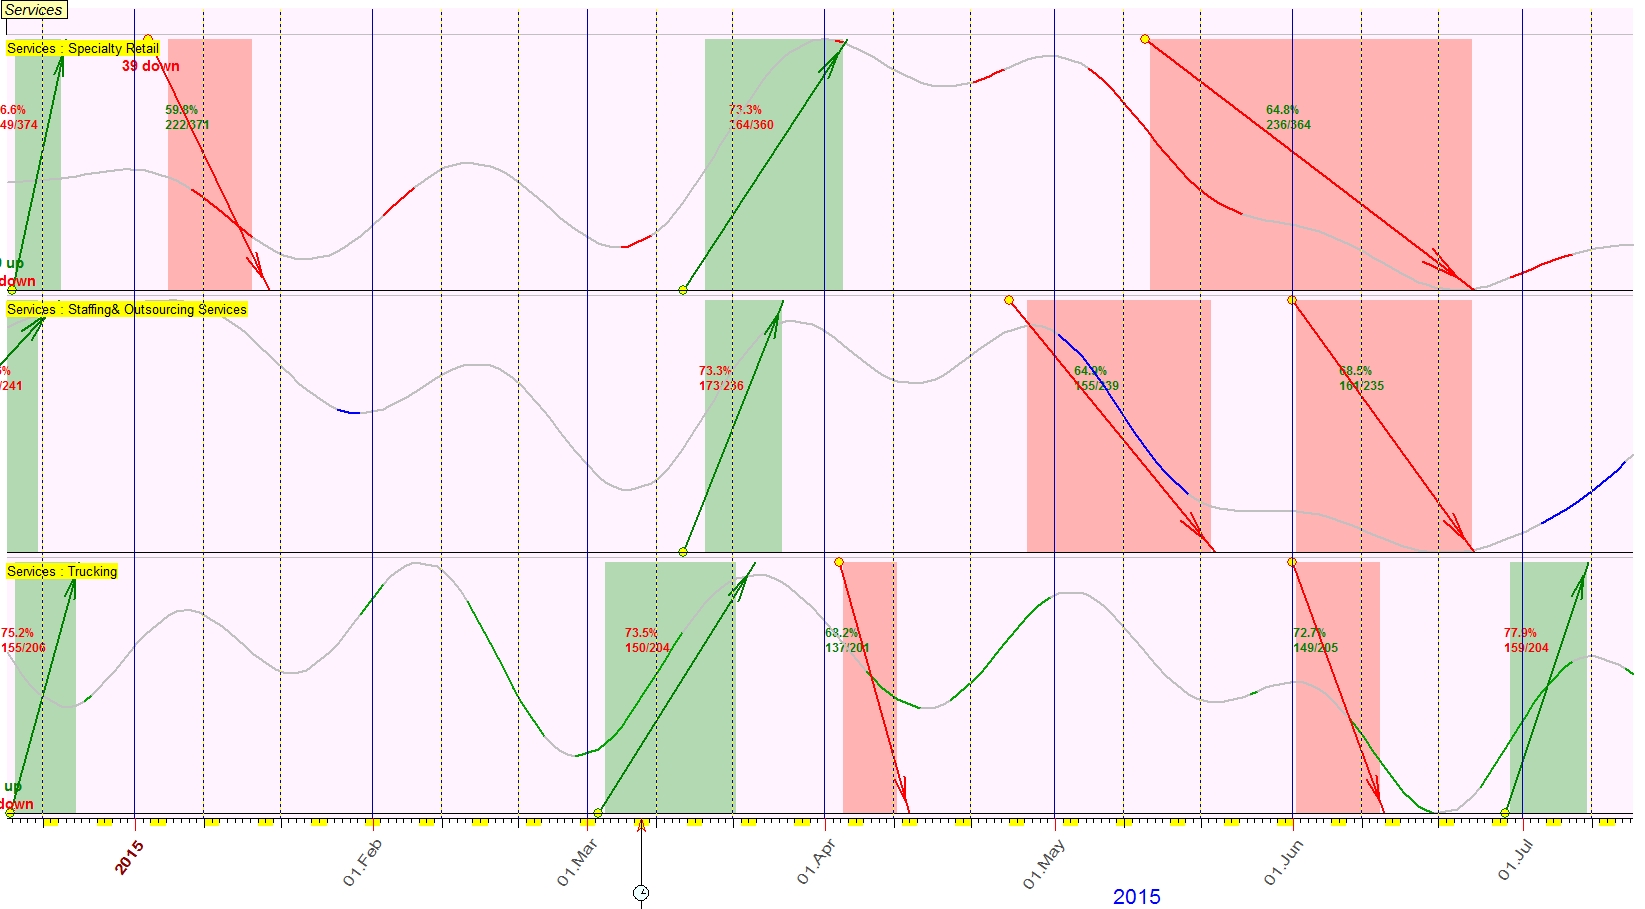
Services
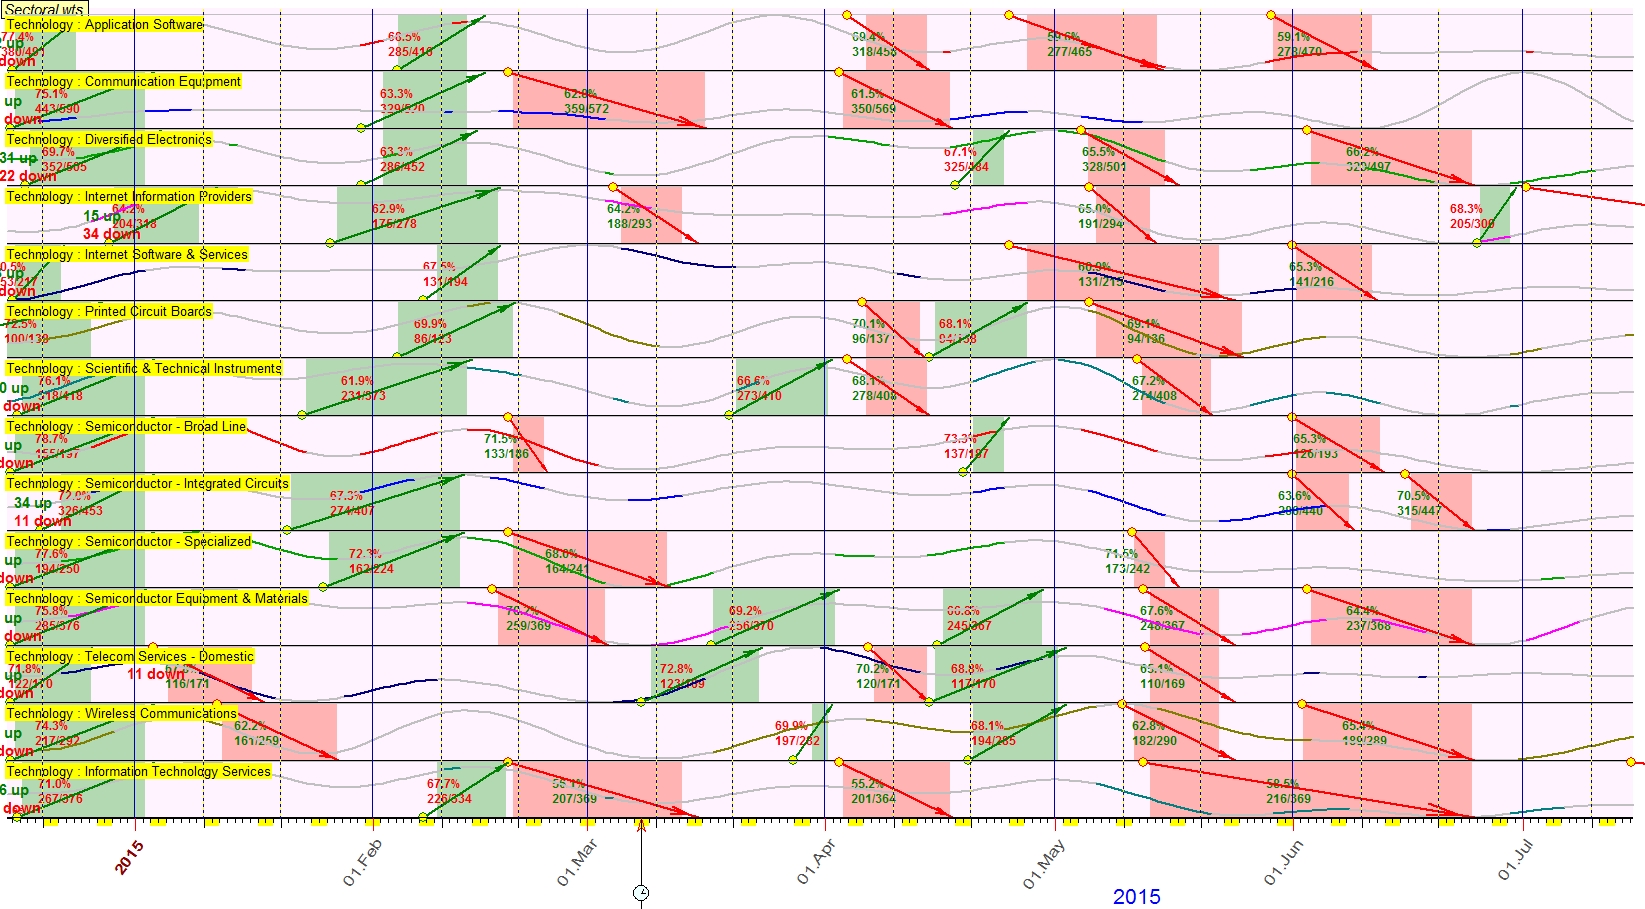
Technology
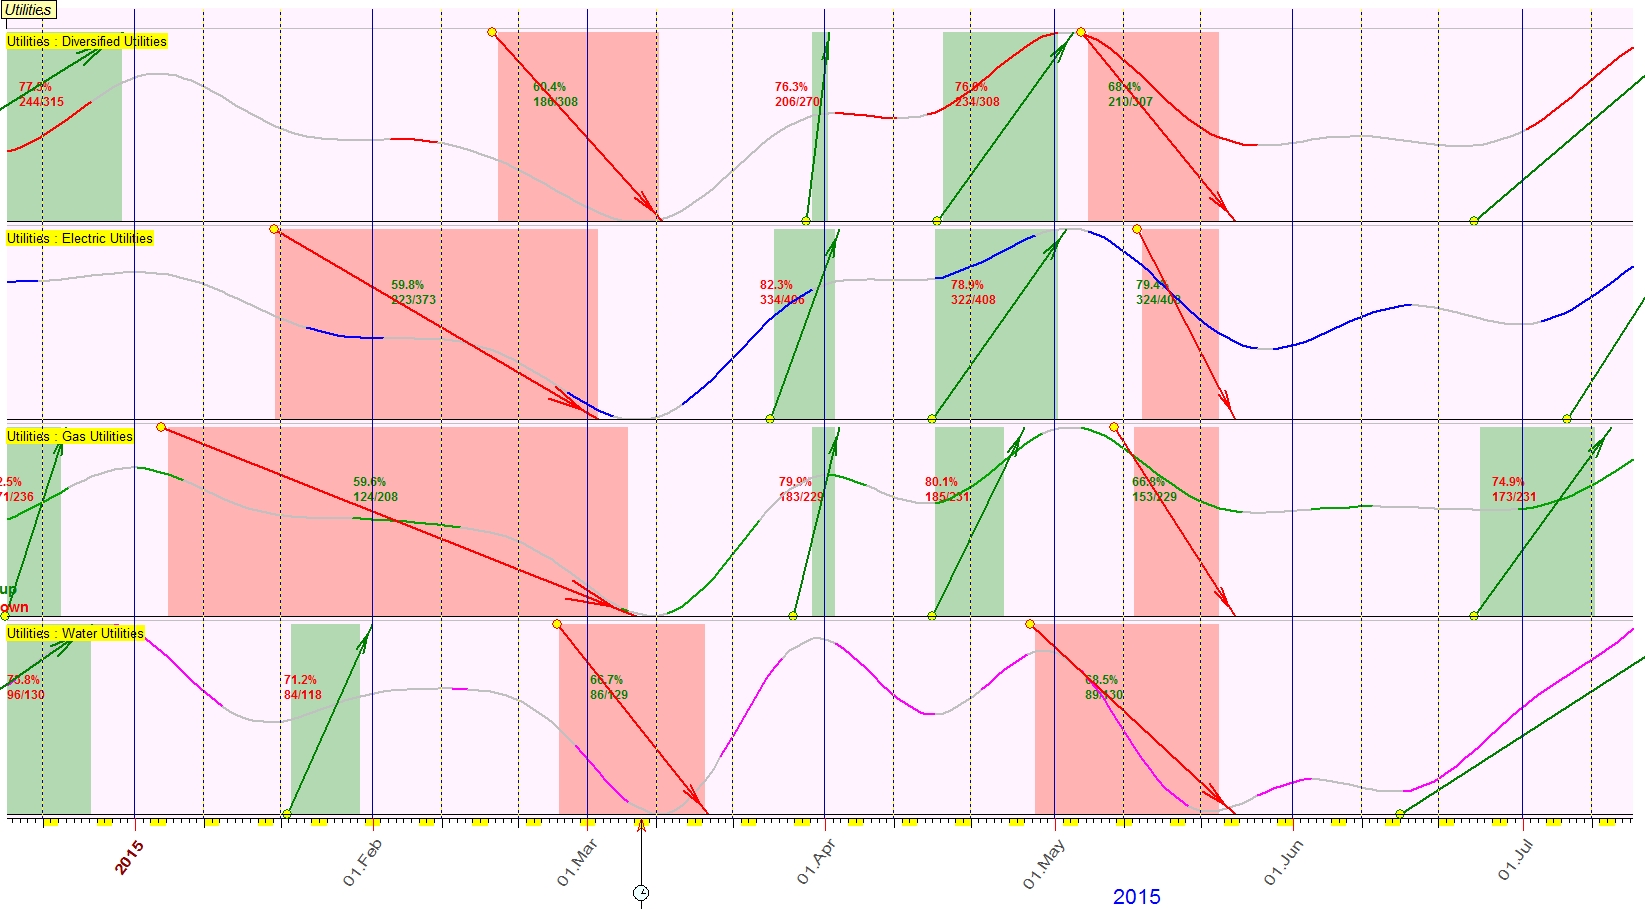
Utilities
© Sergey Tarassov
January 16, 2015
Toronto