Trading Spectrum - Moment of Truth
written by Sergey Tarasov November 24 2017
This class is about Trading Spectrum definition. This spectrum is pretty different than spectrums calculated in classical cyclical analysis. I believe the problem comes from the difference between classical cyclical and cyclical analysis applied to finance. At first sight these techniques are pretty much the same, we are both looking for presence of cyclical movement in analyzed data, whether it is sunspot activity or S&P500 quotes. The difference appears in final results. The scientist may form his/her results like this: cycle with some period present in sunspot activity index, Bartels or Student significance test confirm presence of this cycle with some probability. For trader there is only one significance test - profit. So anyone who tries to apply cyclical analysis for his/her traders must know about Fourier transform, Pearson correlation etc. Otherwise he/she will not understand how these calculations have been done.
Trading Spectrum is a new concept that allows you to skip all these scientific definitions and speak directly about profit, win loss ratio, drawdown etc. It was not an easy step for me, it was a very inconvenient step and I'll tell you why. It is easy to develop a program that provides you high correlation, high Bartels or some other significance of your models. You always have room for an explanation/improvements, something like that "NOW we don't know something but one day in FUTURE we will know and everything will be good". With trading spectrum we do not have this room. A cycle maybe tradable or not, nothing in between, NOW or NEVER.
Example
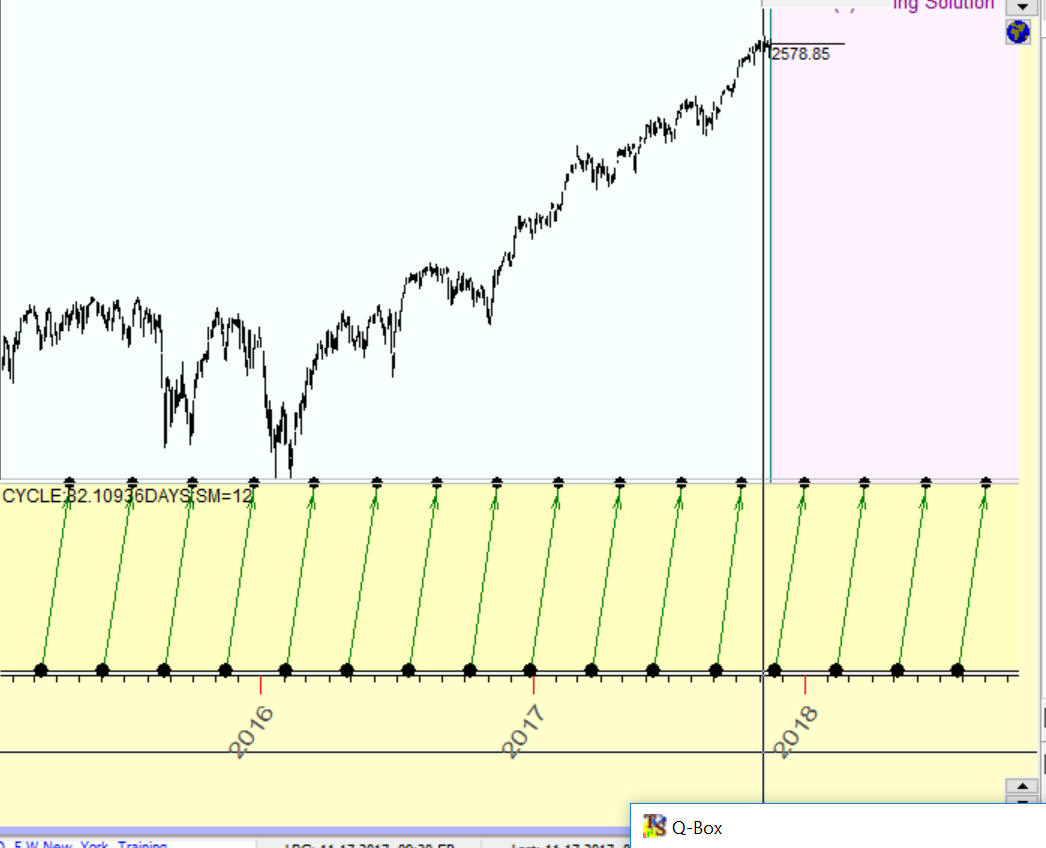
Let' start with an example. Q-Box module in Timing Solution has found that 82.1 days (calendar days) looks like a tradable cycle within at least the last 12 full cycles i.e. at least within the last 18x82.1= 985 days. How do we use this 82.1 days cycle?
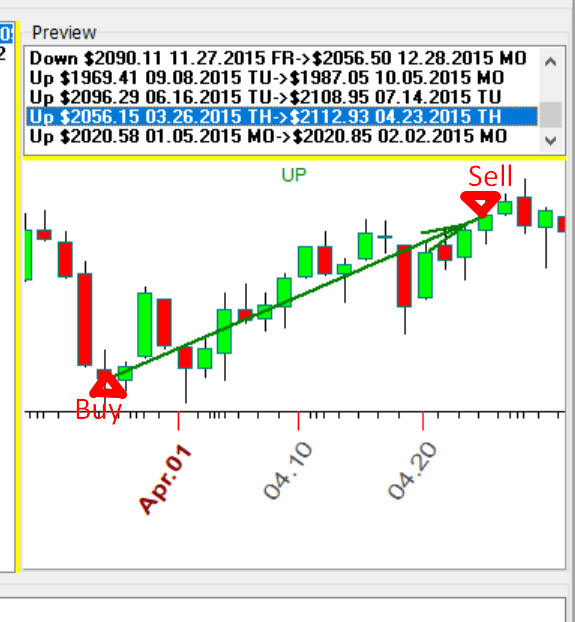
The program recommends to open long position January 5, 2015 and close this long position February 2, 2015 because we expecting up trend movement within this period.
In 82.1 calendar days it recommends to repeat this trade i.e. we are expecting up trend movement since March 26, 2015 till April 23, 2015, this is how this trade looks:
Next trade will take place in 2x82.1=164.2 days i.e. June 16, 2015 till July 14, 2015.
So our trades repeat every 82.1 days. Totally in this example we analyze last 12 cycles so the last trade took place in 18x82.1= 985 days i.e. June 26, 2017 -> July 24, 2017.
Similarly we calculate future trades incrementing 82.1 days, here are all these trades:
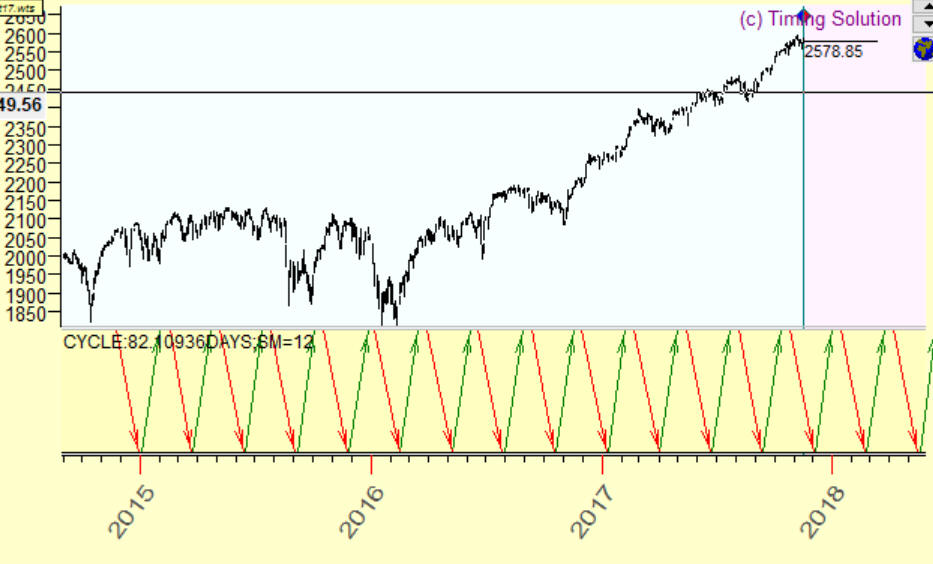
We can make more than one trade within one cycle, for example we can get the program to suggest two trades within 82.1 days interval: long trade - expecting up and short trade - expecting down:
So
Definitions: Period, Metric, Predictable Zones (Up and Down), Stock Memory (SM)
So the whole idea of cyclical analysis can be explained by one definition: trades repeat every X days. X this is period of analyzed cycle. The period can be measured in calendar days and in trading days, this is metric of analyzed cycle.
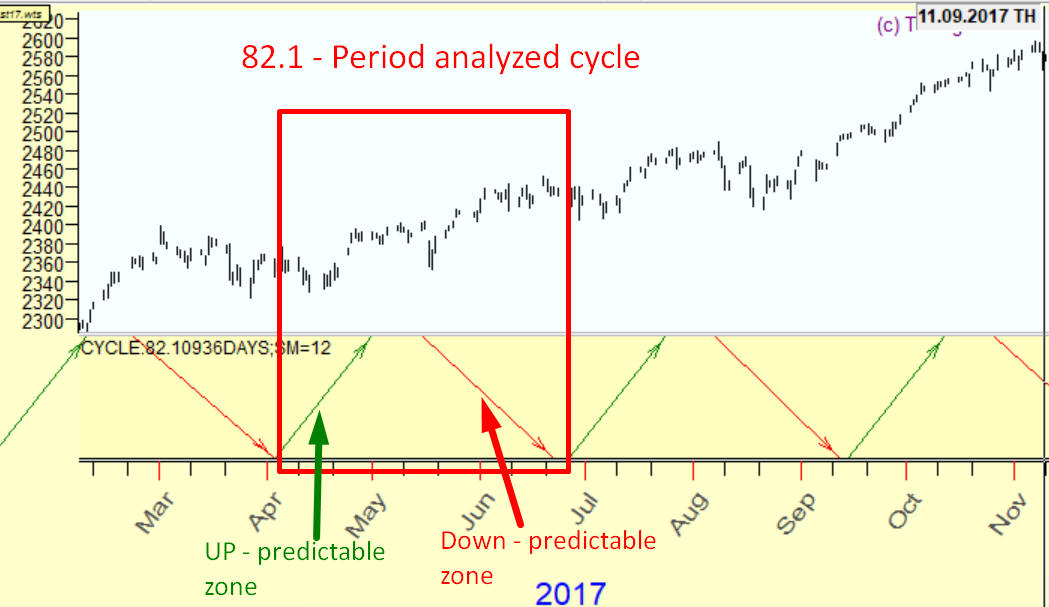
In example above within period 82.1 calendar days we do two trades that are based on two predictable zones for this cycle. Up predictable zone - we are expecting up movement within this period and down predictable zone - we are expecting down movement:
The last definition you should know is stock memory (SM). To build this 82.1 days cyclical strategy with 2 predictable zones the program uses 12 full 82.1 days cycles:
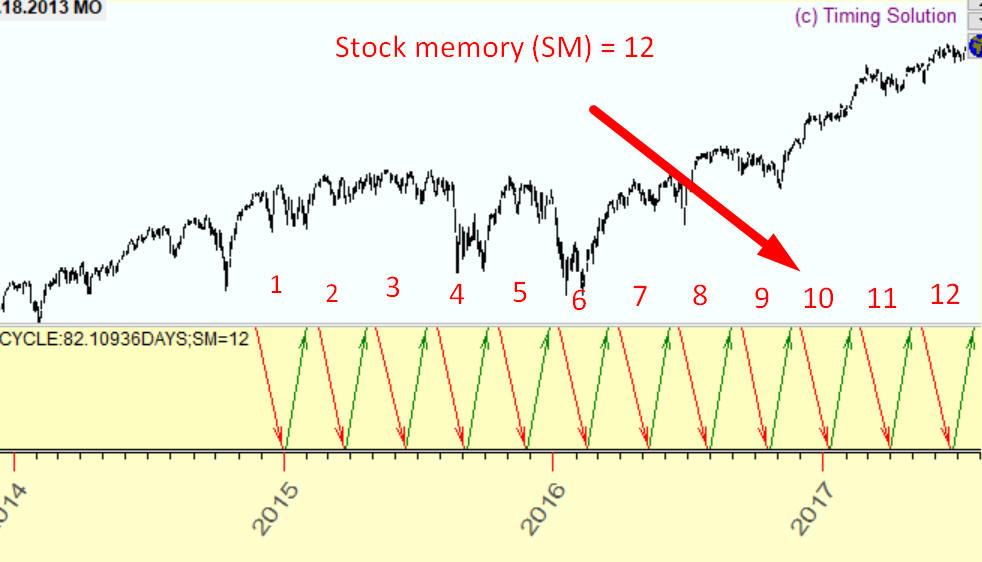
The cycles in finance do not work forever. The cycles appear, live, disappear. They have their own life expectancy and with stock memory (SM) parameter we set the approximate life expectancy for analyzed cycles. Experience shows that it is better to set SM in 7-12 diapason, otherwise the results will be too noisy.
How it works
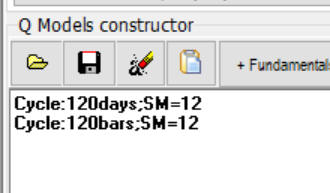
Q-Box module in Timing Solution software allows to examine any cycle regarding its tradeability. For example: we need to check 120 days cycle. In Q-Box module type this:
Cycle:120days;SM=12
and click "Calculate":
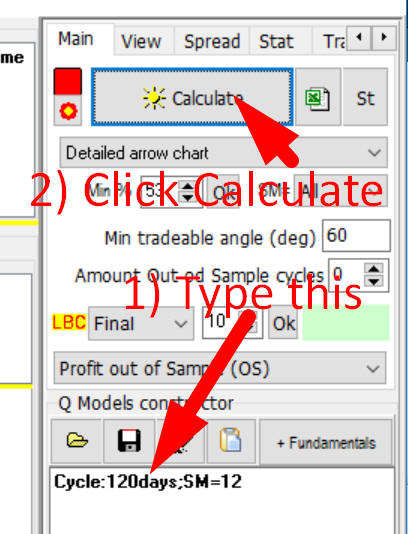
It means that the program will try to find predictable zones for 120 days cycle, stock memory equal 12 i.e. we analyze last 12x120=1440 days of price history to reveal predictable zones for this cycle.
In this example the program has found two predictable zones for 120 days cycle, see "Predictable Zones" list box. When you highlight this predictable zone it will show all trades for this predictable zone:
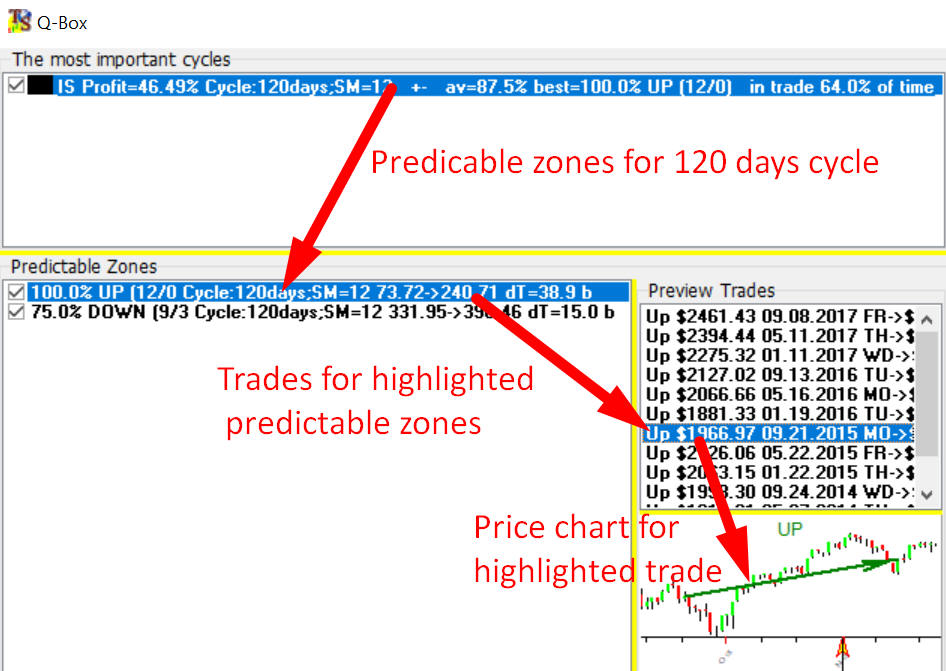
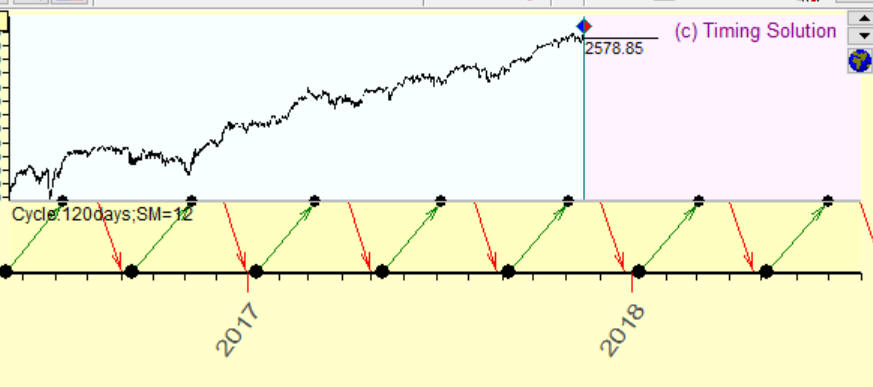
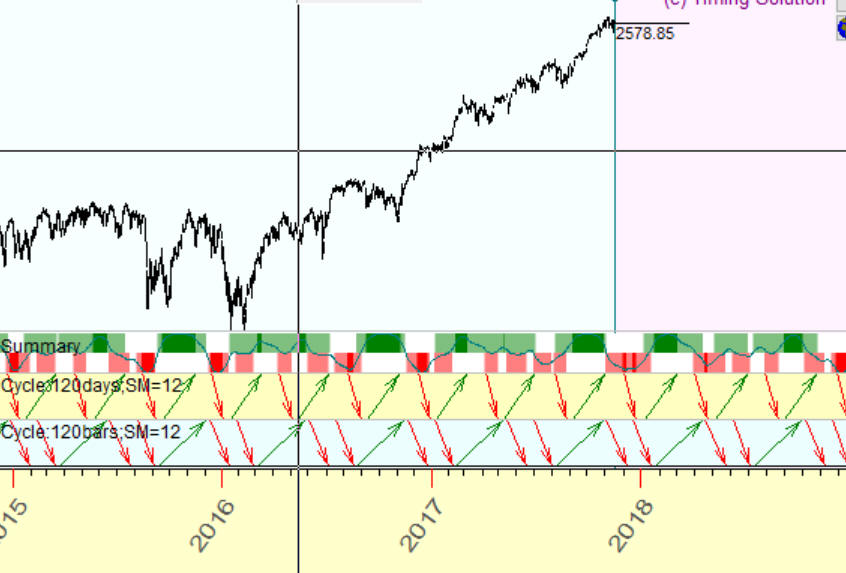
All these trades are profitable i.e. price goes up. Highlighting trades you can browse the price chart together with arrow that shows the trade. In the Main screen you may see the arrows that correspond to these predictable zones:
You can analyze any cycle in this manner. If you need to examine TRADING DAYS cycle (for EOD chart) type this:
Cycle:120bars;SM=12
Thus we have two cycles now:
and after calculations you will get two panels with arrows for 120 calendar days and 120 trading days cycles:
Parameters: SM, MINANGLE
Min percentage
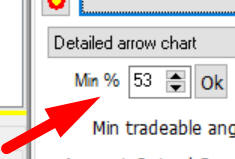 this is the minimal percentage of winning trades for
analyzed strategies, this is pretty much the same as minimal value of win/loss
ratio.
this is the minimal percentage of winning trades for
analyzed strategies, this is pretty much the same as minimal value of win/loss
ratio.
Stock Memory (SM)
Here you can specify "by default" value of stock memory. For example , I have created three cycles in Q-Box module:
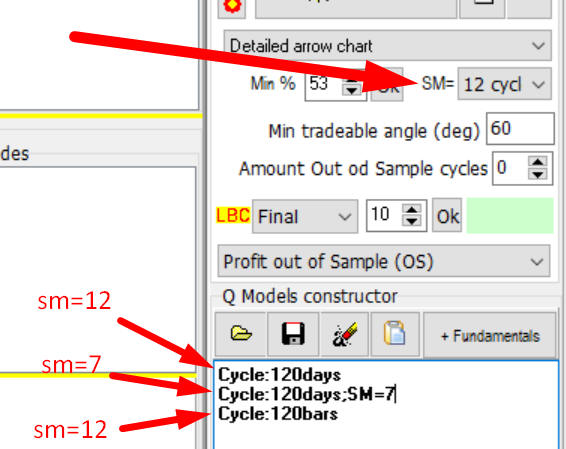
First Cycle:120days - 120 days cycle with stock memory=12, this is by default value of stock memory
Second Cycle:120days;SM=7 stock memory=7, we specify stock memory here manually
Third Cycle:120bars stock memory=12, by default value
Minimal tradeable angle, this
parameter is described here:
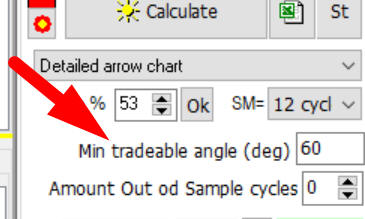
Suppose we analyze 120 days cycle. Setting minimal tradeable angle to 60 degrees we set the minimal transaction length to 120 days x 60 degrees/360 degrees = 20 days.
In other words the minimal distance between buy and sell signals is 20 days. 120 days corresponds to full cycle or 360 degrees, accordingly the angle 60 degrees corresponds to 120/6=20 days. This is an important parameter, and it looks like for astro based cycles this parameter should be smaller. For example if we analyze Sun (Annual) cycle 60 degrees angle corresponds to two months interval, for Annual cycle two months is too big of an interval, like September drop covers two weeks only.
So for astro based cycles I recommend to set this parameter to 5 degrees. While if you research regular math cycles this parameter should be higher, otherwise there will be more noise in the results. Astro (i.e. natural) and regular (i.e. math based) cycles work differently.
You can set minimal tradeable angle manually by using parameter MINANGLE, like here I have created two Sun (Annual) cycles: the first with minimal tradeable angle of 5 degrees and second Sun cycle with minimal tradeable angle of 60 degrees angle which is set by default:
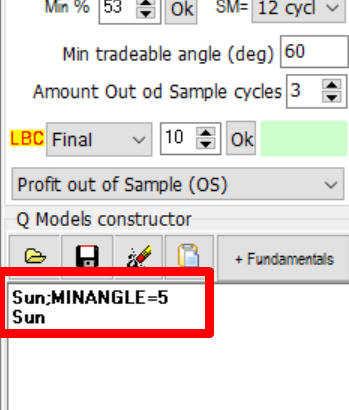
Here are the results:
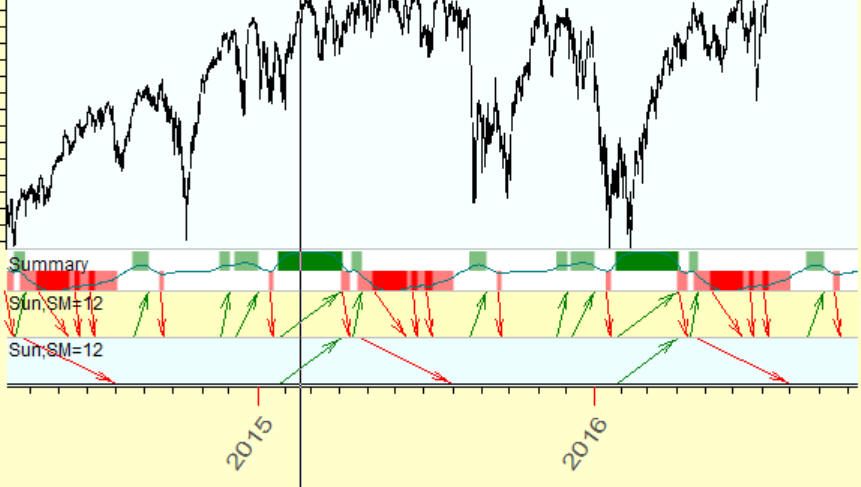
You see, 5 degrees strategy provides more trades.
Amount Out of Sample cycles:
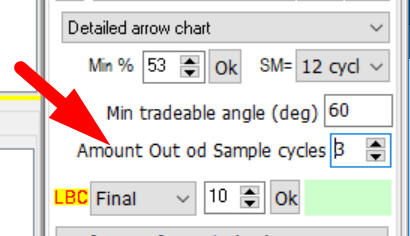
This parameter allows to conduct additional verification of analyzed cycles. For example if we analyze 120 days cycle and set Amount Out of Sample cycles to 3 the program use last 3x120 360 days of price history as Out of Sample data, in this example Out of Sample (OS) covers the interval from the end of 2016 until end of 2017:
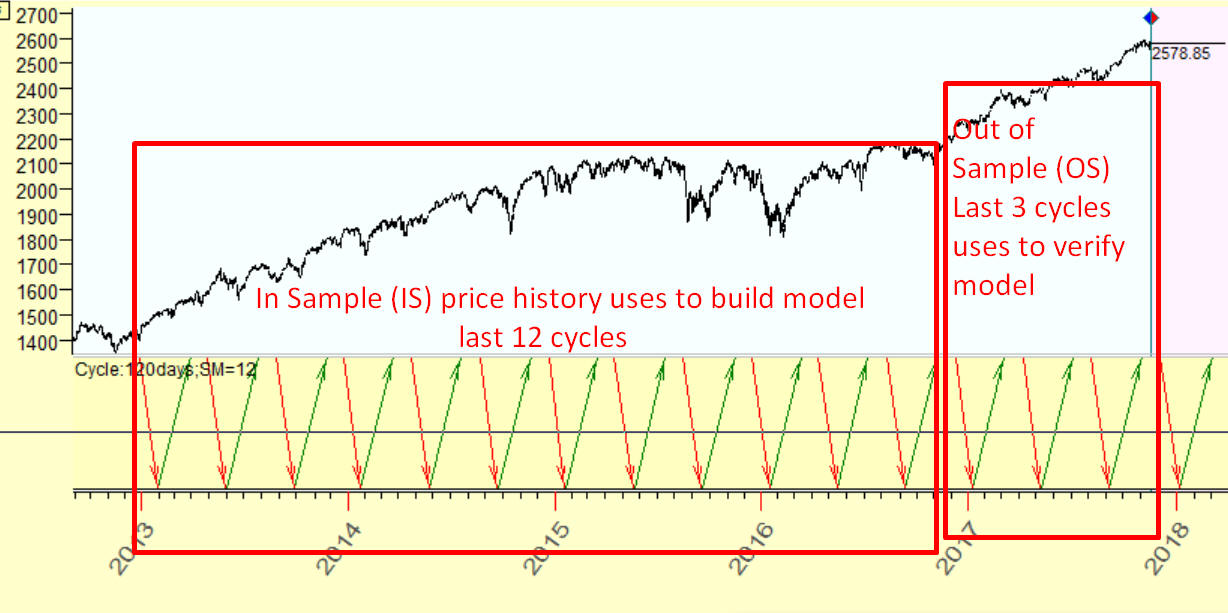
In Sample (IS) covers end of 2012 till end of 2016 years, this interval is used to calculate models i.e. calculate predictable zones for 120 days cycle. At this step the program does not use Out of Sample (OS) price history at all. When the model is calculated the program checks workability of this module on Out of Sample (OS) interval, the price history that has not been used before. This is the core idea of non future leaks technology.
Trading Spectrum
Trading Spectrum applies the same idea as Fourier transform does in classical cyclical analysis. We analyze some process in time and transform this data set into period (or frequency) domain. In other words Trading Spectrum allows to reveal the most important cycles. Because we use trading criteria like profit, we can say that trading spectrum allows to reveal the most tradable cycles. To calculate trading spectrum in Q-Box module in "Trading Spectrum" tab click this button:
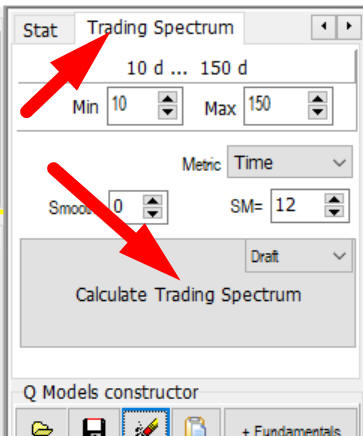
After calculations you will get periodogram that shows the cyclical activity (in terms of trading) for your financial instrument. Usually this periodogram is much more choppy than classical spectrum. You can smooth it using this option:
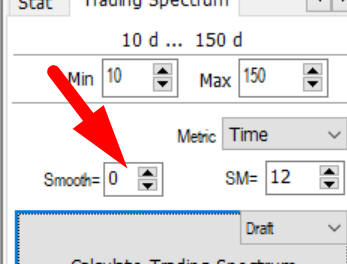
But I don't sure that this is a good idea to smooth periodogram, maybe it makes sense to work with data as it is.
You can choose the parameter that it uses here:
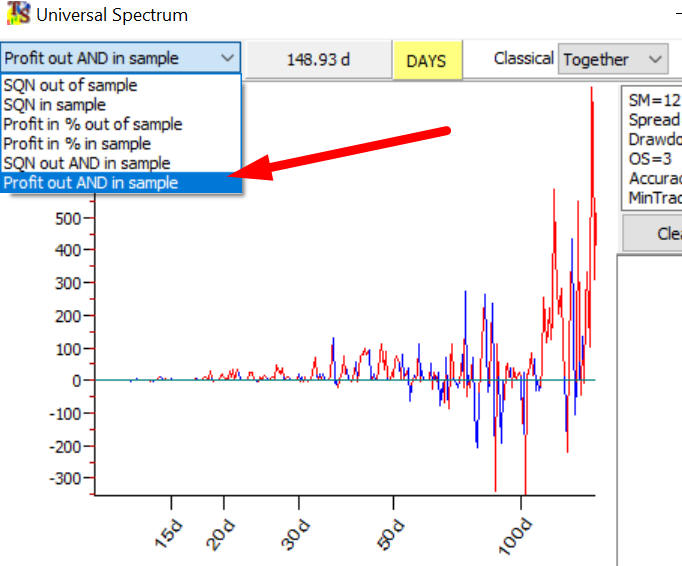
By default this is Out of Sample profit, in other words this perodogram shows how different cycles are profitable on Out of Sample interval. But I also recommend to try "Profit out AND in sample" intervals. This value is high when profit is high both on in sample and out of sample intervals.
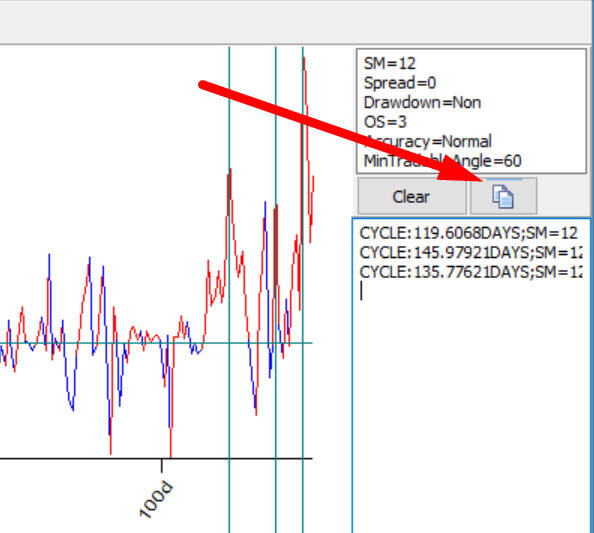
You can pickup any cycle by clicking around the peak and it will add this cycle to the list:
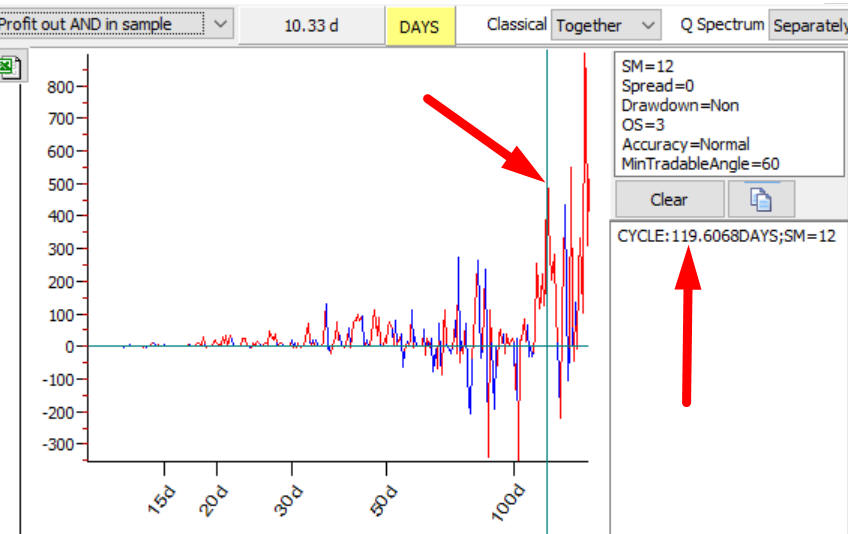
after that you may copy chosen cycles into clipboard:
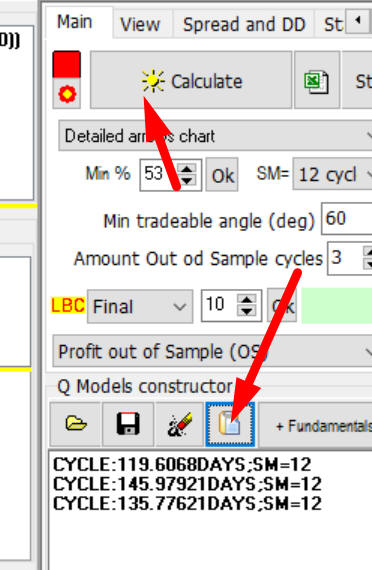
and paste these cycles into Q-Box module to get predictable zones for these cycles:
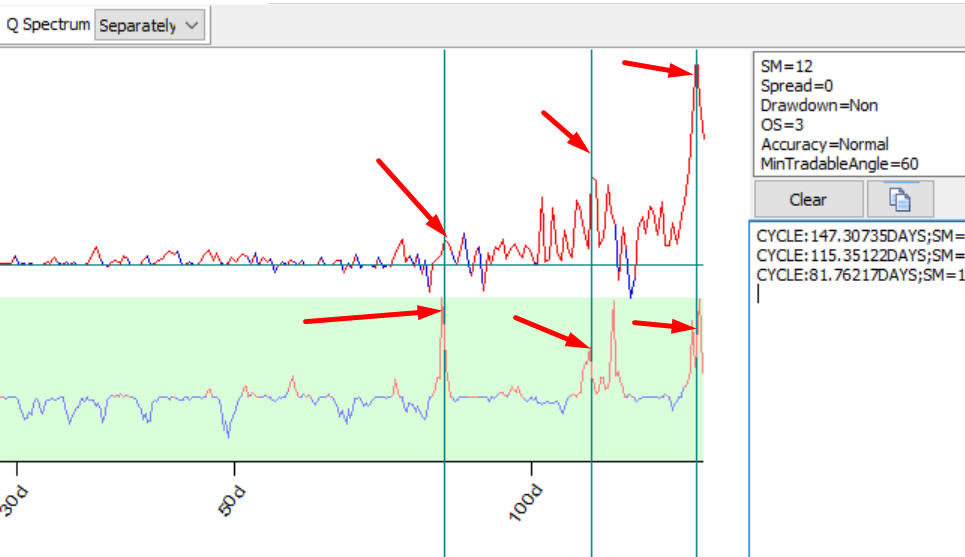
Trading Spectrum this is new a mathematical entity so we have so far more questions regarding it than answers. The first thing I recommend to do is: calculate both Trading and Q-Spectrums the program displays both of them. I believe the cycle should be confirmed by both spectrum charts:
The second thing I recommend to do this is play with drawdown...
Drawdown - the main problem
The main problem with cyclical models is a big drawdown. You can set the value of maximum drawdown here in "Spread" tab:
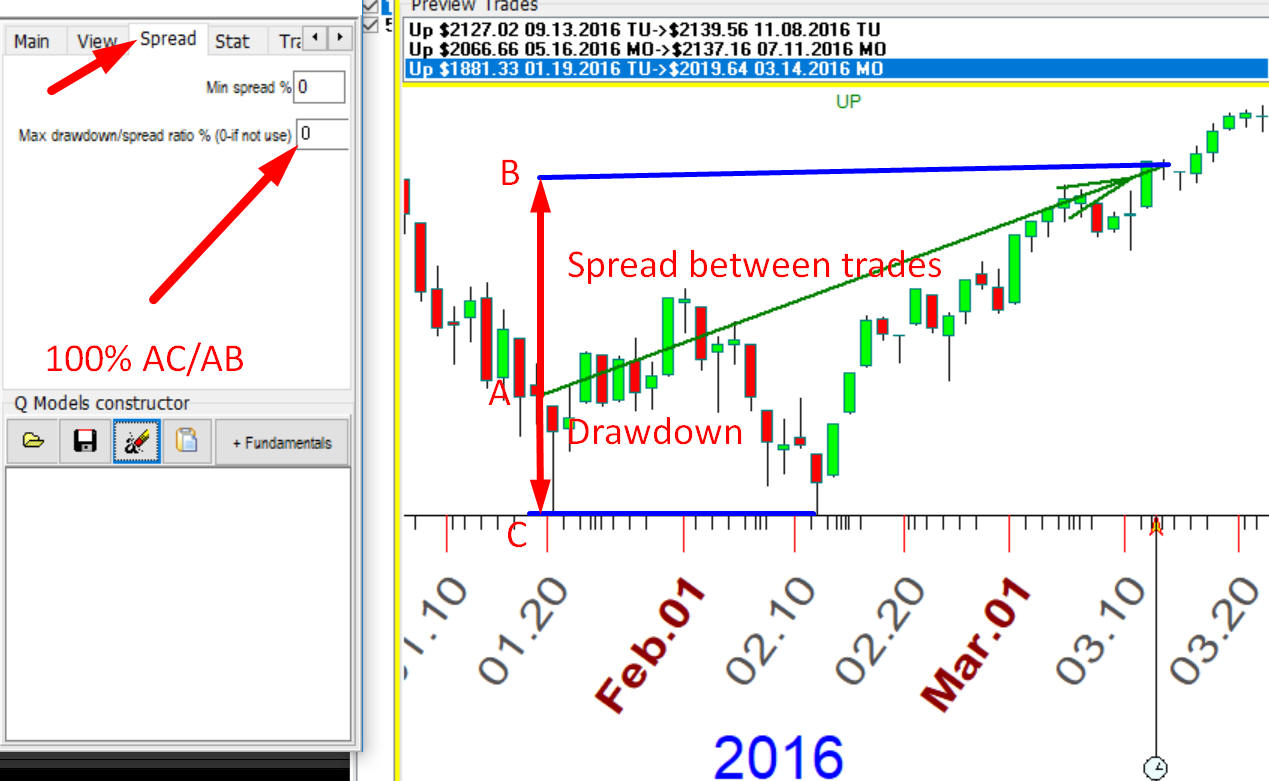
By default it is zero, it means that drawdown is not used in calculations, i.e. all drawdown value is possible. Pay attention, zero means not zero value of drawdown , it means ANY value of drawdown, the program ignores it and analyses all trades with small and big drawdowns. To restrict drawdown we use drawdown/spread ratio. The chart above demonstrates how this ratio calculates. It shows the long trade with with spread between closing and opening price AB. The drawdown within this period is AC. We use the ratio between drawdown and spread calculated in percent. In this case this ratio is about 50%, it means that for each $100 winning with this trade we have $50 drawdown. This is a risk that we are experiencing within this trade. For example if we set this value to 150% the ratio between risk and profit will be 150%. I understand that this is a big value, but this is what we have and I recommend to study cyclical models from this point of view.
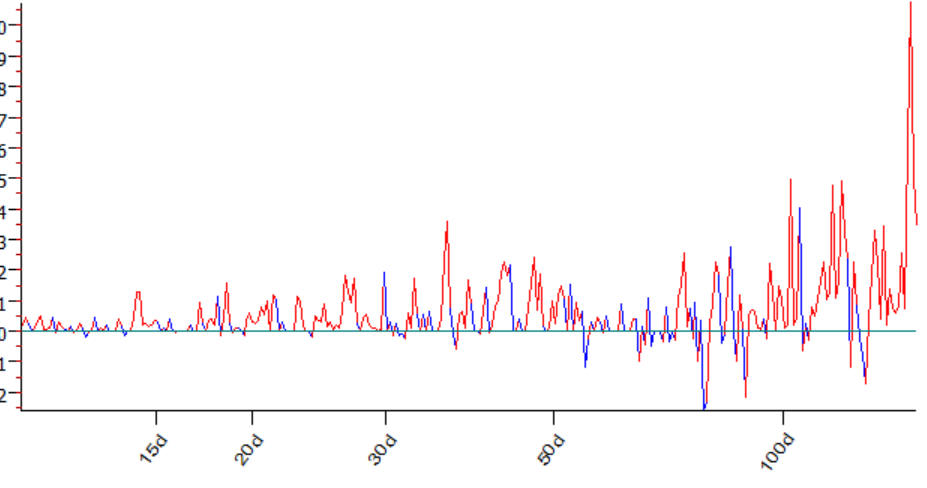
This is what I usually do, calculate Trading Spectrum without drawdown i.e. program ignores drawdown:
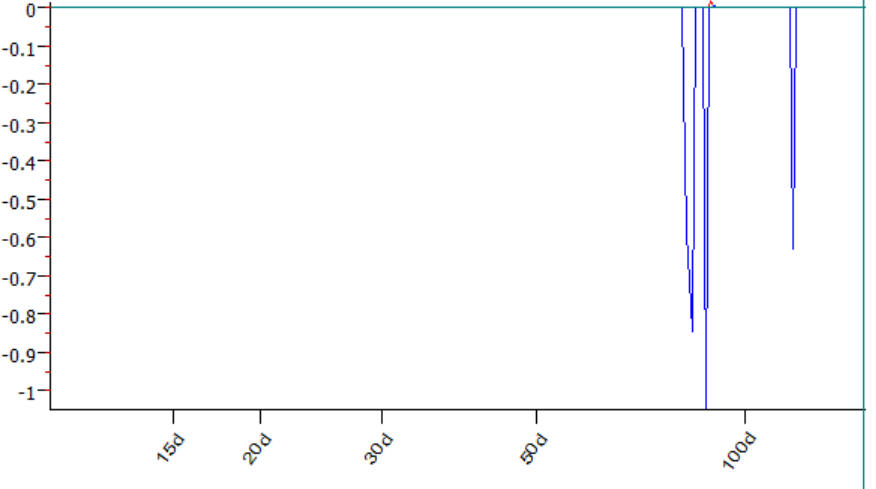
After that I set drawdown to 50% and did not find any cycles.
Drawdown=75%, some cycles appear but they are not profitable, negative profit:
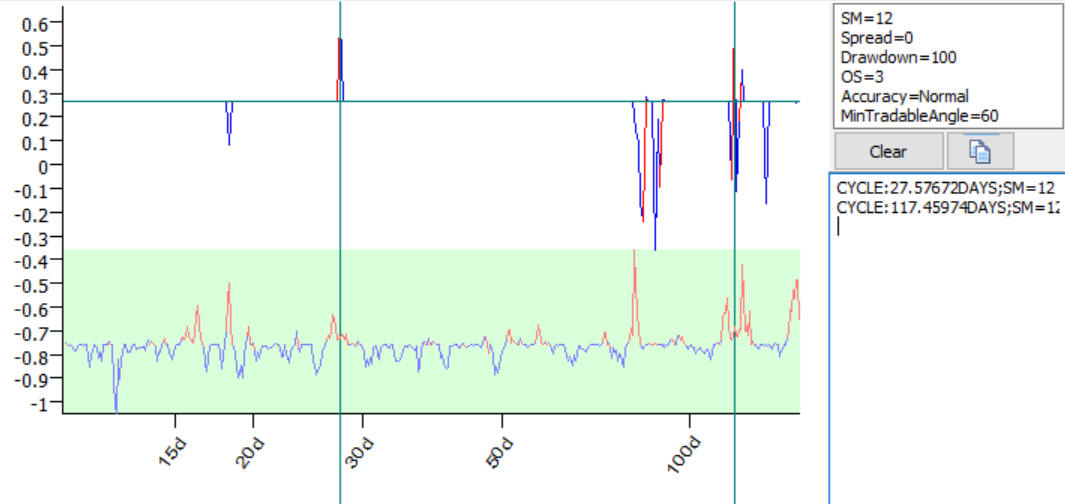
Drawdown=100% - some tradable cycles appeared:
November 24, 2017
Toronto, Canada