Trading Spectrum module
�2019 Trading Spectrum Timing Solution. All rights reserved.
written by Sergey Tarassov
Fast introduction for busy people
This is a brief explanation of this module. It shows only how to work with it. We recommend to read the whole article to understand its idea better.
This module works for EOD data. It may be applied for some intraday data, to 60 min at least, no less. It allows to build a forecast with the forecast horizon from several days up to one month.
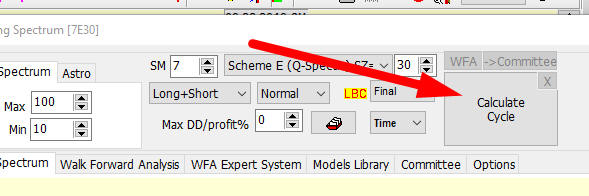
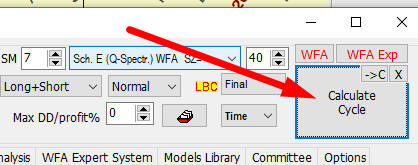
Open Trading Spectrum module in TI section and click "Calculate Cycle" button there:
In some seconds (2-7 sec.) the arrows for uptrend and downtrend periods will appear. And these arrows are prolonged into the future suggesting a trading possibility:
The 70-days cycle is shown. It is calculated in a special way, so these up and down arrows repeat themselves every 70 calendar days. Since February we could observe 7 such patterns: 7 long trades (expecting up) and 7 short trades (expecting down market move). Only one trade here was losing, this one:
Once the cycle is found, please remember that it has been found for this financial instrument only. It may be different for different financial instruments, and it changes with the time for that same financial instrument. It is not surprising as now we know that there are no permanent cycles in finance.
Instead of one permanent cycle for all instruments, we can calculate tradable zones for any financial instrument that are changing with the time. The pattern that forms this cycle is changing as well. It may consist of only one arrow, as this up arrow shown below:
or two up arrows within 76.89 days cycle:
or two up and one down arrow like this:
Any pattern is possible. Also, there is a possibility when no tradable cycle could be found. We do not define a cycle to look for beforehand, the program finds it for us.
Let us get back to our first example with 7 up and 7 down arrows and only one losing trade. Be careful, it does not mean that you have 13/15 = 93% accuracy system, i.e. system that generates 93% winning trades. This is just the result of the optimization and a typical way how mathematicians may confuse traders. The high percentage here is expected. At this stage, we only explore a possibility of a tradable cycle.
WFA Expert: The next step is to get the best trading cyclical model for our chosen financial instrument. Each model has its own set of parameters; the quality of our forecast depends critically on these parameters. Here are the most important parameters:
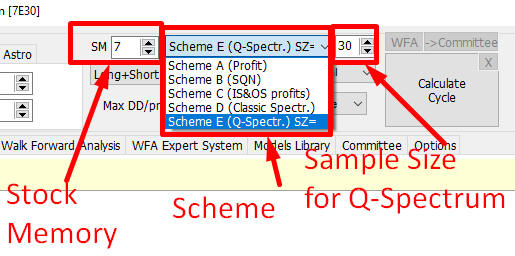
1) Stock Memory - the most important parameter, it shows how many full cycles would be use for trading to verify our cycle. For example, consider SM=7 for analyzing 100-days cycle. We would need last 7x100=700 days of data to verify a tradability of this 100-days cycle. In other words,. we watch how this cycle would trade within the latest 700 days.
2) Scheme - it is the algorithm applied or the procedure that is used to reveal a cycle. By default (as in September 2019) we use Q-Spectrum.
3) Some schemes have additional parameters; for Q-Spectrum it is WFA sample size (WFA SZ), this is an important parameter as well.
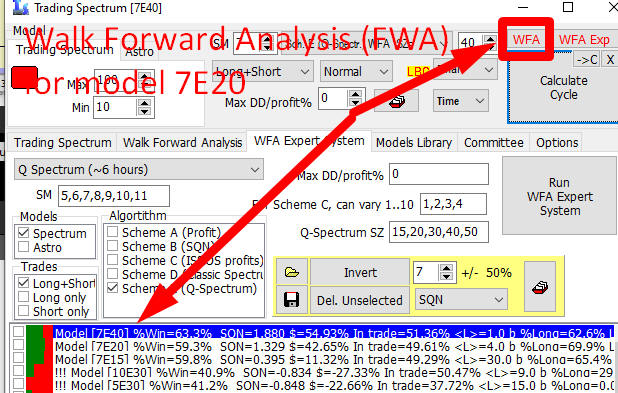
So, to get the best model for our price chart, we need to find a proper combination of these parameters. We do that running WFA Expert system. Click this button:
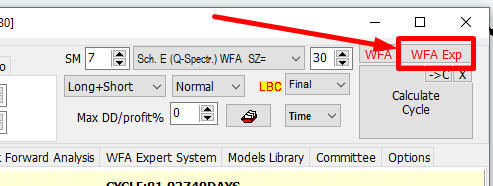
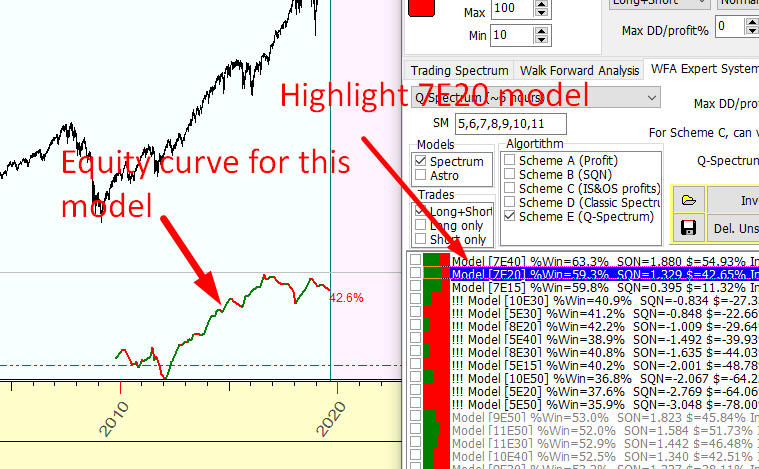
It takes 1-5 hours of calculation, the program will conduct walk forward analysis (WFA) for dozens of different cyclical models. As a result, the program displays the equity curve for each of these models. Highlight any model to see the equity curve it produces:
Choose the model with best equity curve. We recommend choose the model with:
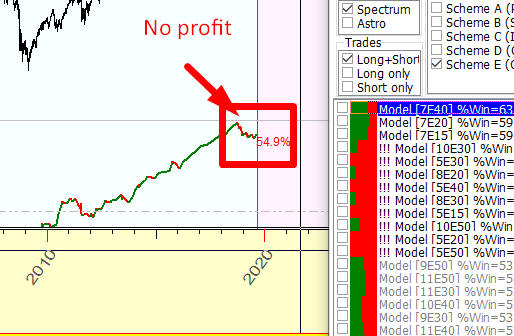
a) equally climbing equity curve without big drawdowns. Especially pay attention to the most recent years (the end of your data set). For example, the equity curve below looks good though for the latest year this system does not generate any profit:
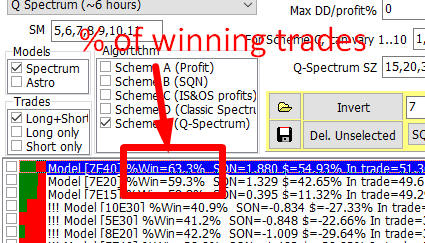
b) the rate of winning trades; it should be 57% and higher
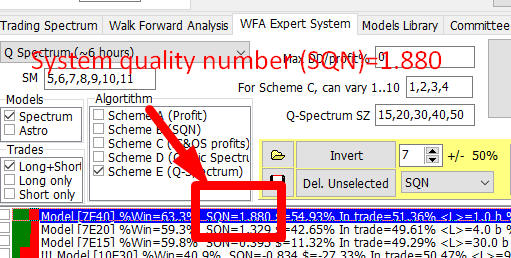
c) SQN (system quality number) 1.3-1.5 and higher
Walk Forward Analysis (WFA): after the model is selected in the previous step, we recommend to preview trading signals produced by that cyclical model, to see how it trades historically. Click this button:
In a few minuses the trading signals generated by this cyclical model will be shown:
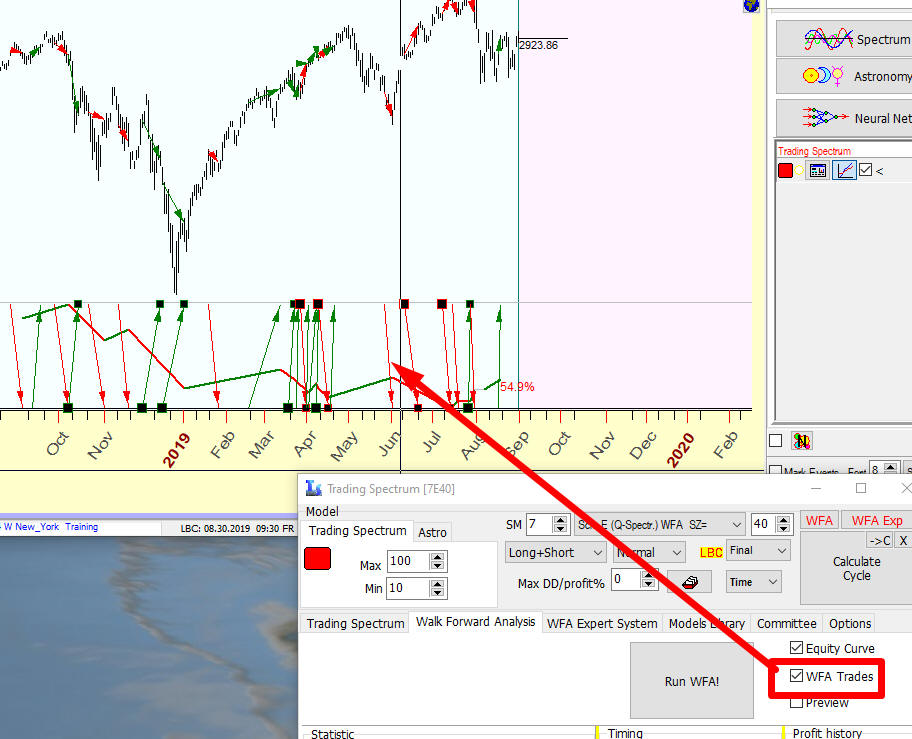
These up/down arrows represent long/short trades recommended by this cyclical model. To make these arrows visible, set ON "WFA trades" option.
Final Forecast: now click this button:
We get future trading signal/signals together with the projection line:
Inverted Strategies: also pay attention, very often inverted models work better, like this one:
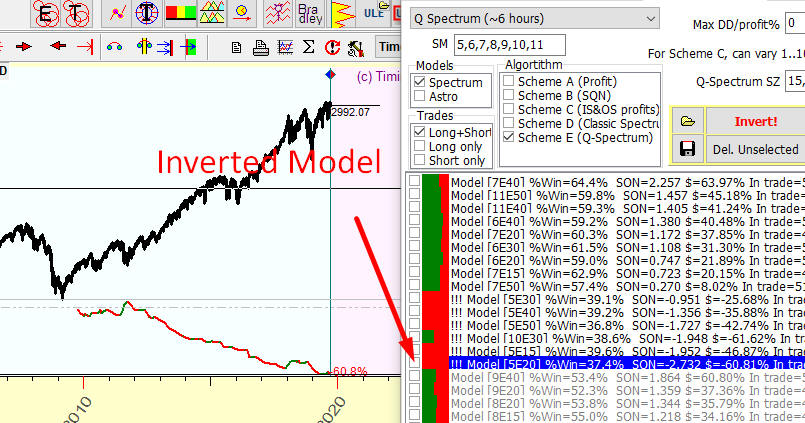
This model provides 37.4% winning trades with negative SQN -2.7. If we invert this model by clicking this button:
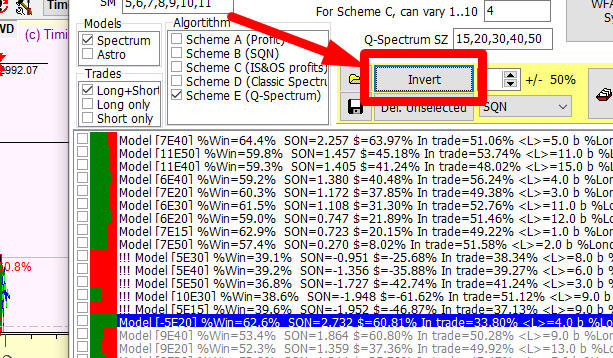
we get a very good equity curve with 62.7% of winning trades and big SQN value, equal to +2.7:
Now we can save this model into TS worksheet for further usage, it also saves into worksheet the list of backtested models in WFA expert.
If you have some time and are willing to learn more, please read this following article.
In the trap of harmonic analysis
Being a financial software developer for more than 20 years, I always feel uncomfortable explaining the importance of the projection line. Usually I say that the projection line points at the general direction of the future price movement. And this is true: the projection line really forecasts that future movement, and we can also estimate the accuracy of this forecast. If we start with 50-50 %% of guessing, the information provided by the projection line gives extra 10% of forecasted price movement. This information is really valuable for a trader. I believe it is more valuable than the information that we can get from Technical Analysis tools (according to different sources, these tools add 5% to a possible outcome).
The reason of my discomfort has a fundamental nature. The world of classical cyclical analysis and the world of trading are two totally different worlds. And each one has its own language. In the World of Cyclical Analysis we speak in terms of spectrum (Fourier transform), harmonic function, correlation, etc. In the World of Trading we speak mostly in terms of profit and risk management, i.e. win/loss ratio, drawdown, and so on. One of the most confusing questions that I get from software users is: "OK, we have a good projection line that provides a good correlation with the price. The question is: can we convert this correlation into something more suitable for trader's needs - like profit or win/loss or something else?". I really spent a lot of time trying to combine cyclical analysis criteria and trading criteria, to build a bridge between these two worlds, World of Cyclical Analysis and World of Trading. Timing Solution users are very well familiar with this phenomena: if we use a correlation as a criterion to optimize the projection line, everything is going nice and smoothly. While when we set a profit as a target, everything is going crazy: the projection line becomes choppy, a slight change of one parameter only leads to a drastic change of the profitability of the same projection line. Instead of harmony, we observe a classical behavior of some chaotic system. For some reason, the classical cyclical analysis "does not like" when we try to apply some trading criterion like profit, win loss, SQN...
For a long time I did not understand what is possible to do
here, where to move further. It is very
frustrating when you do not see a perspective, when paths that you take look like
a dead end.
Bridge between Cyclical and Financial analysis Worlds: the first brick
The major player of any kind of classical cyclical analysis is Her Majesty Harmonic function. Everyone who deals with that type of analysis knows her very well:
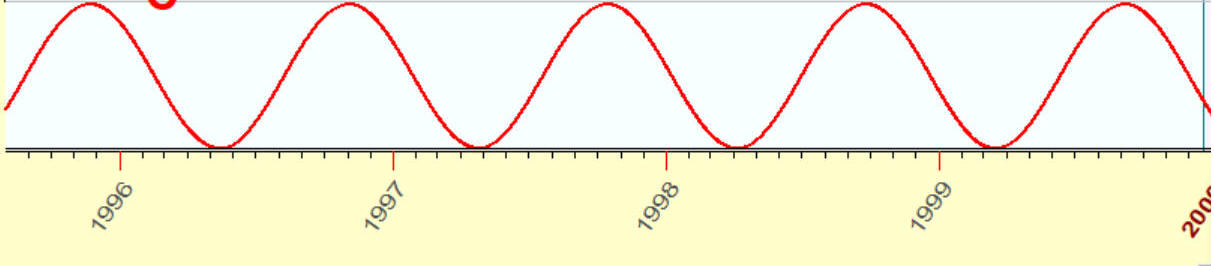
No doubts, this is one of the most beautiful person in mathematic, maybe the most beautiful one. Classical cyclical analysis just serves Her Majesty Harmonic function, in anything where this technique is applied. This beauty has some side effects though. While conducting any kind of cyclical analysis, it is very difficult to think in some other terms than those of harmonic analysis. I believe any person with a scientific background can confirm this inevitable temptation of harmonic analysis.
My first successful attempt to build the bridge between these two Worlds was a creation of Q-Spectrum module: http://www.timingsolution.com/TI/16/index.htm
The idea grew inside me slowly. For a long time I did not dare to make this step as it is very different from what the cyclical analysis does. It proved to be worth to do that: in one month it became one of the most used modules in Timing Solution. What I did was just applying walk forward analysis method to the cyclical analysis. It was my first case where cyclical and financial approaches had worked together.
Bright idea found in a garbage bin
When I was trying to get as much as possible from classical cyclical analysis, there was a question asked by many Timing Solution users: what to do with inverted cycles? Timing Solution team did a lot of back testing in this regard, and we too observed this inversion phenomenon. We decided to ignore it for now - as a mathematical nonsense, a kind of negative information. This situation continued for more than 10 years...
When the first Q-Spectrum diagram was build, it became obvious that inverted cycles are not a nonsense, they are reality. To bring this reality to life, we had to get out of the box of classical cyclical analysis: http://www.timingsolution.com/TS/Articles/anti_information/
Trading Spectrum - harmonic wave free cyclical analysis
The next step was very clear to me: we need to build a cyclical analysis tool that is 100% based on trading criteria - such as profit, win/loss etc. This is an absolutely new approach. I have started working on it almost two years ago: http://www.timingsolution.com/TS/Articles/Trading_Spectrum/index.htm
It took me so much time as it was necessary to check all steps. If I would stay on a position of classical cyclical analysis, that would be easy: more than two hundred years of achievements in this field were at my fingertips. Following the new approach, there is not much done by others here. So I had to do that by myself. And, like in the space industry, any imprecise step/calculation or any omission could be fatal for all our models.
Lyric is over, now let me show how it works.
I will make a forecast for SNP500 index using two approaches: classical spectrum and trading spectrum.
The classical spectrum has revealed a presence of 67-days cycle since May 2018. It is shown on the diagram as a red projection line in the bottom panel (to be exact, this is 67-days cycle with 2H, 3H and 4H overtones:
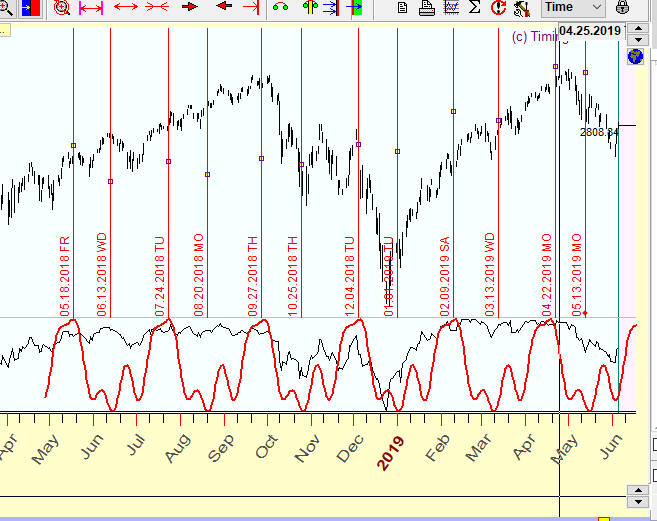
As you see, this projection line hits some turning points, some it does not. This is because classical cyclical analysis is more focused on fitness between the price and the projection line. If we would base our trades on this cycle, we need to work with it more trying to catch as many turning points as possible - by adding astrological insights, definitely including Annual cycle into the picture, and checking the performance of the combined cycle for extended data.
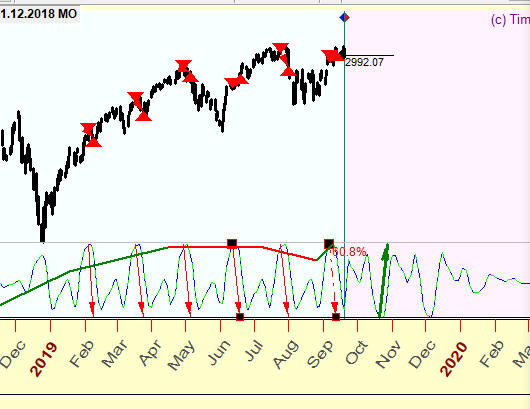
Now let us look at Trading Spectrum (TSp), Its task is to find the most profitable cycle. This is what TSp shows:
Long trades are shown there as green arrows (we expect the market moving up), and short trades are represented by red arrows (we expect the downward movement). And here comes the first surprise: the period suggested by TSp is a bit different from what is revealed by classical Spectrum. The trading pattern here repeats itself in 70 days. In total, since the end of April 2018 there were 12 such trades, and just one short trade in July-August was a loosing one (it is marked by black bars; the index went up instead of expected down):
All other trades were profitable.
The program shows the trades overlay of the price chart, so a trader can visually evaluate if these trades are good/not good for him or her:
Thus, Trading Spectrum looks for the most tradable cycles, the cycles that bring more money. It is a totally different approach. Here we do not care how well our model describes the price movement, how it correlates with the price. The only things we are looking for is periods when to buy and when to sell, everything else does not matter here. Is not it what a trader wants?
Here are several examples that show how Trading Spectrum works:
SNP500 in 2013:
Soy beans
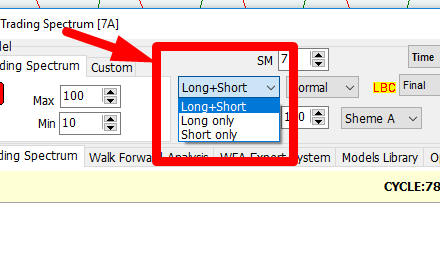
The program can analyze only long (or only short) trades using these options:
Forecast Horizon - midterm
Trading Spectrum is good if we are looking for midterm trading strategy, i.e. if we are
in trade from several days up to a month. For a longer period it is better to use
classical cyclical analysis, Q-spectrum or Composite module to reveal
astronomical cycles. The reason is simple: if we apply this technology to forecast
a period longer than a month, buy and hold trading strategy
will dominate. I would say that for the investing horizon more than a month Trading
Spectrum does not work. From
the other side, it does not work for daily trading as well (it is s territory of
automated trading systems).
Parameters to vary
Stock Memory (SM):
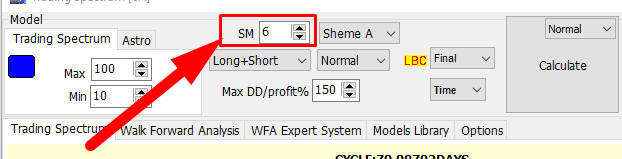
The most important parameter to play with is stock memory (SM).
It shows how many cycles we should take
into account. The minimal amount of SM is 5, the maximum ...? Honestly, I do not know. Walk
Forward analysis (which application to Trading Spectrum is explained further) shows that typically
the stock memory
varies in a range of 5..7. It means that tradable cycles usually live 5-7
periods, after that they disappear.
Algorithm
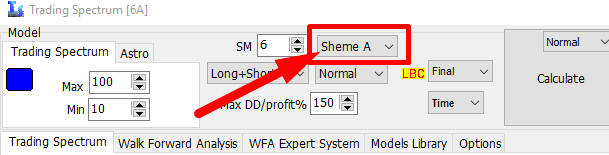
Next important parameter is algorithm. It shows how we estimate the importance of a cycle for the trade. There are three algorithms there: "Scheme A", "Scheme B" and "Scheme C". Applying the algorithm "A", we calculate the profit that we get from this cycle. Other two algorithms apply more complicated methods to estimate the cycle's performance.
Drawdown/Profit ratio
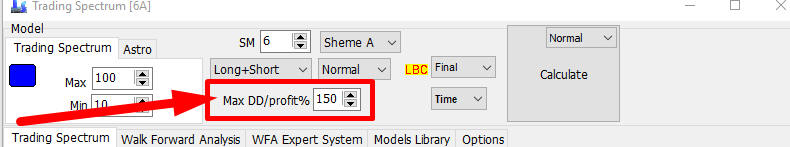
DD stands for drawdown profit ratio. Take it as a
maximum risk that you have to take if you decide to use this technology. It is
calculated as a ratio between the maximum drawdown during this
trade and the profit you can get. Let me explain it. Suppose you have bought 100 shares for $100 each. When the
share price
rises to $110, you want to sell it, so you get the profit of $1000. However, the
price is changing before reaching that $110 level. It goes back and forth. So, within
a generally uptrend period, there is the time when the price has dropped to $85.
If you sell this active at that moment, you could lose $1500. It means that drawdown profit
ratio here is the ratio between your potential loss of $1500 and your profit of $100, i.e.
it is
1.5, or 150%.
Change this parameter to reflect your risk tolerance. You may set this parameter to 1% trying to find "peaceful" trades with smallest drawdown. I would not recommend that as the experience shows that in this case usually no cycles are found. Cyclical models need accepting some drawdown.
Pay attention: setting DD to zero means that any drawdown is acceptable, this is not a model with zero drawdown.
Long and Short trades
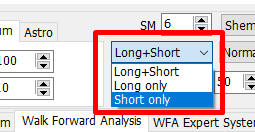
The program is able to search for a succession of long (expecting higher price) and short (expecting lower price) trades, or long trades only, or short trades only. This option allows to choose the market movement to trace.
Inverted strategies
This option allows to trade inverted way. What is that? Look at this example. Here Trading Spectrum has found a down strategy; we can use this strategy in inverted way, we use it to make long trades:
After LBC, the trading arrows change their direction in an opposite way.
Walk Forward Analysis (WFA)
Claiming that we have found a profitable trading strategy is good. If we decide to follow this trading strategy, we would like to have more assurance. So, the question here is: how successful this strategy was in the historical perspective? If it really has provided good results, there is a strong chance to apply it for the trades now. The answer to this question is given by Walk Forward Analysis (WFA). It is now a standard in the finance to estimate the performance of any trading system. WFA procedure emulates a trading process. Applying it to Trading Spectrum, it does that step: starting from some past date (let say, 20 years ago) it calculates Trading Spectrum based on 20 previous years of the price history, finds a trading pattern/cycle and estimates the performance of the trades based on this cycle. Then the LBC position is shifted to the latest executed trading signal, and the program re-calculates Trading Spectrum based on this "new" price history before LBC, calculates again trading signals, estimates performance of these trades and repeats the process (shifts LBC, recalculates, etc.) until the last available price data. As a result, we can see the performance of this projection line presented as an equity curve together with different statistical parameters (like % winning trades, SQN, etc.).
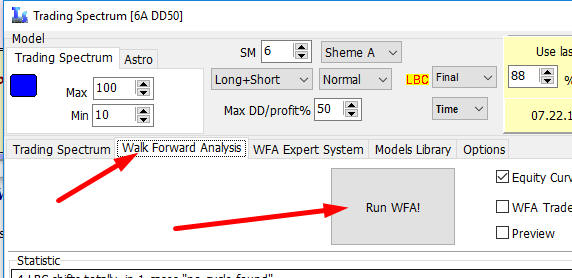
To conduct WFA for Trading Spectrum, open "Walk Forward Analysis" tab and click this button:
Now look at "Trades" information window:
It shows step by step how the trades work.
First line:

indicates that we set LBC to 09.24.2001, have calculated Trading Spectrum, the most tradable cycle was found with the period of 96.95 days; this cycle has recommended two trades. Here they are:
Both are short losing trades, i.e. the profit for both is negative. (BTW, the profit is calculated as a percentage of the price change, it is more convenient for historical research).
After that we run Trading Spectrum again using the price history till 12.28.2001. Trading Spectrum reveals another most tradable cycle with the period of 84.37 days:
This cycle recommends for trading two short trades, one winning and one loosing:
We close the last trade on 03.08.2002, calculate Trading Spectrum and do two long trades recommended by this cycle; both are winning:
We continue this procedure till the last price bar. And here you can see all parameters of this process and the equity curve for these trades:
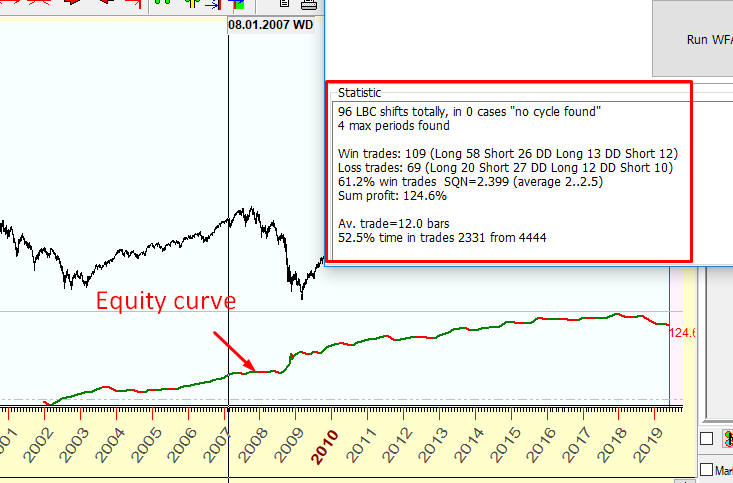
This strategy in this example provides 61.2% winning trades. Average trade length is 12 trading days. Keep your eyes on average trade length. If this value is too big, the system can fall into buy and hold mode. It means that it can randomly generate signals like this "buy now and sell in one month". Statistically in 70% cases the price in one month will be higher than now, i.e. this system reaches 70% accuracy forecast using randomly generated signals. So the average trade length should not be too big to avoid buy and hold mode.
Astro models
The same manner you can build astro based models. By default this option is set to Moon model. In this model, we analyze three major Moon cycles: Moon synodic, Moon tropical and Moon draconic cycles. To build an astro based model, choose "Astro" tab and click "Calculate" button:
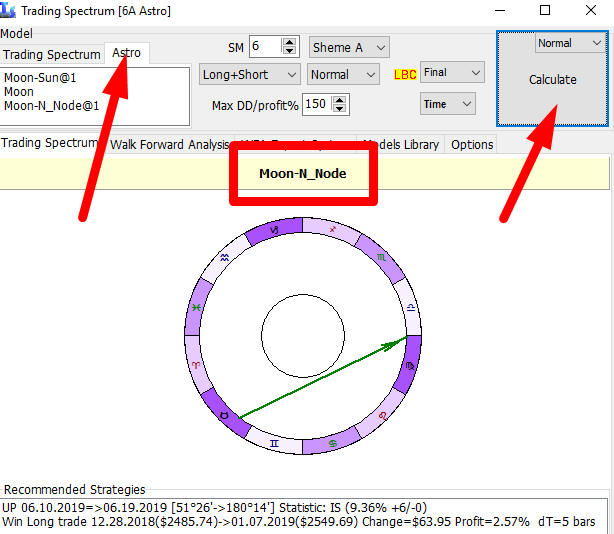
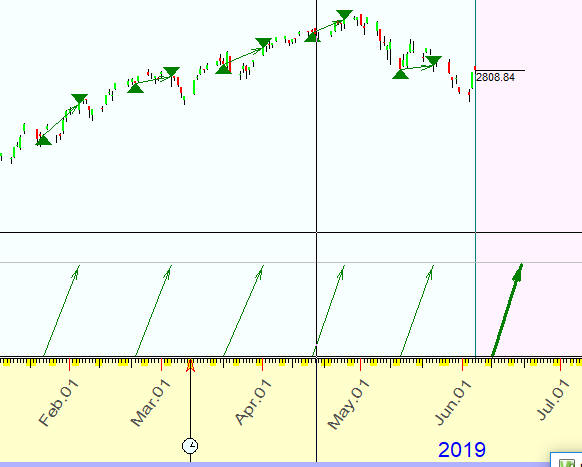
The program will analyze three major Moon cycles looking for the most tradable cycle at this moment. In our case this is Moon draconic cycle (the angle separation between the Moon and the North Node). You can see in the Main screen how this cycle trades:
And then can conduct Walk Forward Analysis for astro models the same way as described earlier. The only difference is: instead of regular math cycles we are looking now for the most tradable astro cycle. This is example of WFA report for astro cycles:
the LBC was set at 1.10.2001, i.e. the price history before this date was used to find the most profitable cycle; it turned to be the Moon-Sun cycle:
This tradable cycle recommends a short trade, we do it and get some profit:
Then the LBC is set at 03.12.2001, and the most profitable cycle is the Moon Draconic cycle:
It suggests two short trades, both are profitable:
Pay attention to this observation: for some reason, the Moon model works this way- at some periods it forecasts only Up movement, i.e. it suggests long trades, while at other periods it forecasts only Down movement, and short trades are recommended:
It seems that the Moon model forms some clusters for up and down trends. Quite seldom it generates mixed signals.
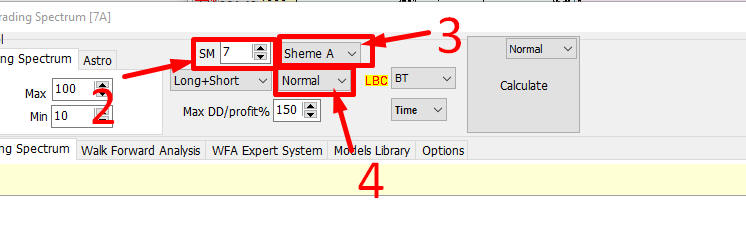
Recommendations to optimize your model
1. Do not download more than 25 years of the price history, the stock market would change its structure anyway.
You can see the amount of price history that is used for backtesting (out of sample interval) here:
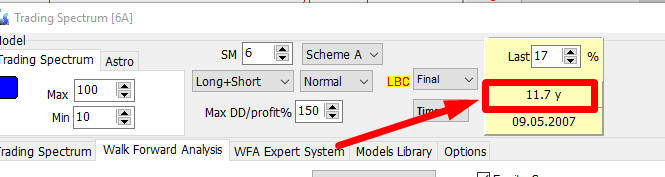
By default out of sample interval is 12 years (if price history is enough). You can set this interval to 20 years, but we do not recommend to use bigger interval.
2. When playing with the parameters, we recommend to start varying SM (stock memory) parameter. Set it to 5, 6, 7, 10 and conduct Walk Forward Analysis for these models for each SM value to see how the equity curve changes.
3.After SM, try to vary algorithm, in most cases "Scheme A" and "Scheme B" is enough.
4. Sometimes you may get a negative equity curve with the negative profit. In this case I recommend switching to "Inverted" mode.
Here is schematic chart for these steps:
WFA Expert System
You can run automated system as well delegating the search of parameters to the software. It conducts Walk Forward Analysis for dozens of different models with different parameters. Your job will be to choose the most workable one.
To run this module, open "WFA Expert System" tab and click "Run!" button:
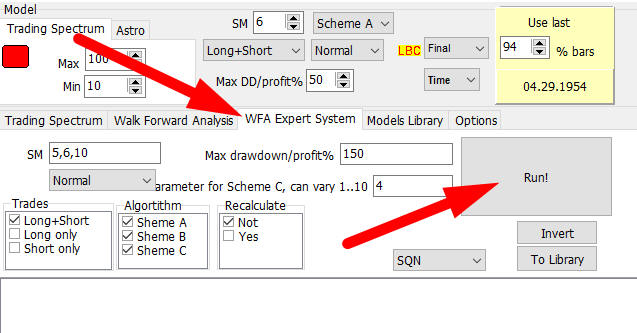
It will take about several hours to do all necessary calculations: 2 -3 hours for Trading Spectrum model and about an hour for the Moon model.
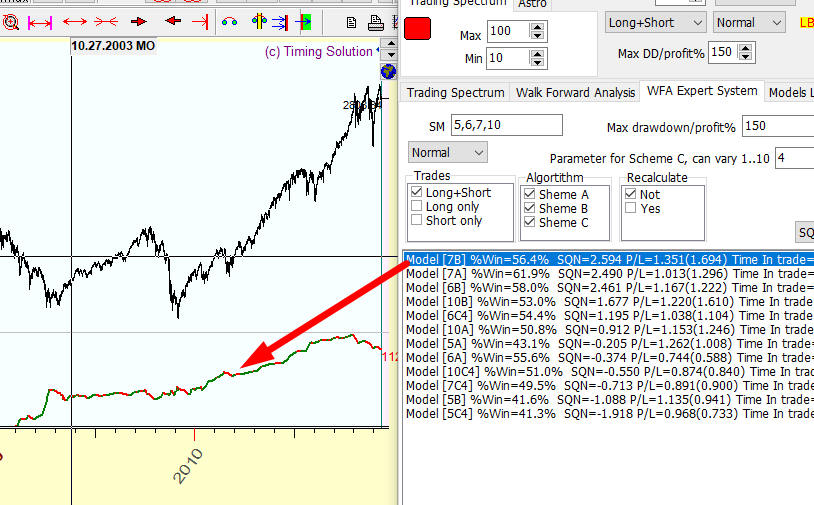
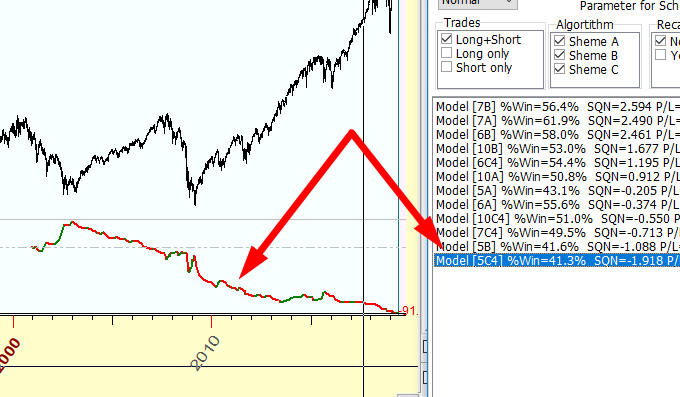
As a result you will get the ranked list of models, similar to this one:
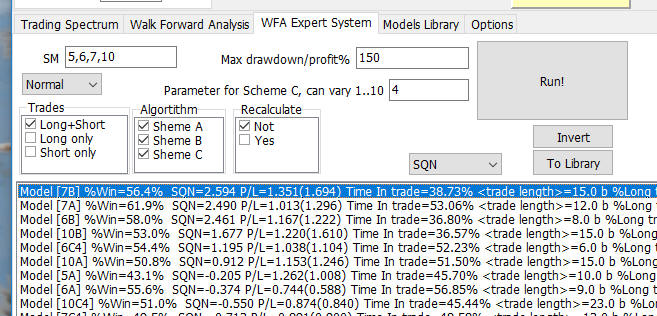
Highlighting any of the items there, you will see the equity curve for this model:
You can put any of these models into "Models Library" clicking this button:
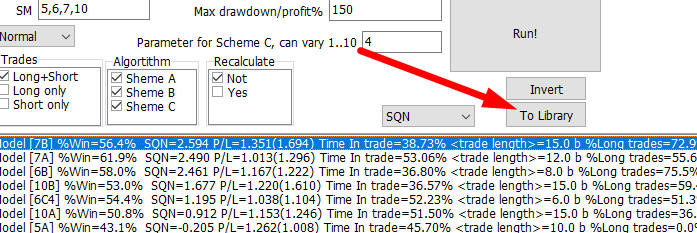
Pay a special attention to the last ranked models with the negative profit:
These models may be used in inverted mode. To invert the model, click this button:
and save into Models Library the standard way.
Models Library
Models Library stores previously saved models. It is here:
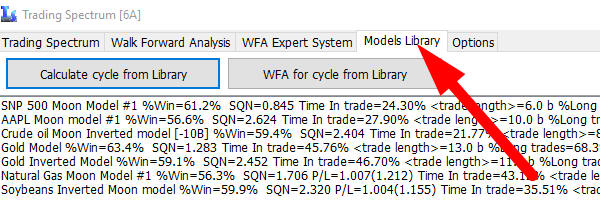
To choose any model from the librarry, simply highlight it and click on this button:
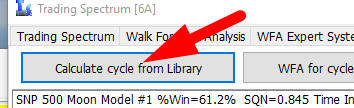
The model will be applied to your financial instrument.
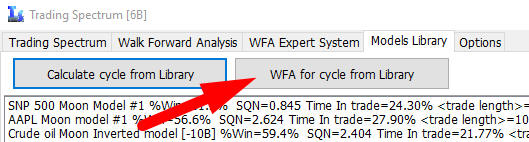
Clicking this button starts Walk Forward Analysis for the chosen model:
June 8, 2019
Toronto, Canada