Back Testing for Turbo Cycles module
edition March, 2012
Quick Start
In the first part of this article you will find the short explanation how to perform Walk Forward Analysis for Turbo Cycles module. In other words, we discuss here the approach that allows to find the optimal cyclical model for any financial instrument. After that you will find more detailed explanation regarding this issue.
Here is step-by-step guide how to find such a model:
- Step #1: downloading price history
We recommend to download 2K price bars at least, better 10K price bars or more. After downloading the price history, follow this in "Back Testing" section:
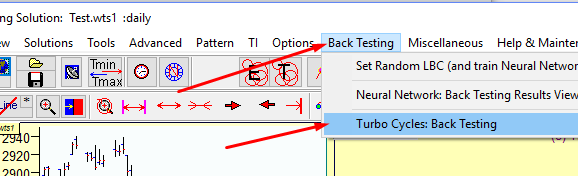

- Step #2: backtesting
Simply click this button:
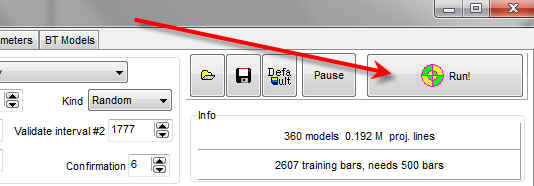
and wait while the program performs the analysis.
- Step #3: analyzing the results
After the calculation you get the list like this one:
Here are ranked Turbo Cycles models, i.e. the cyclical models that provide the best (in terms of forecasting abilities) projection line. We are proud to inform you that Timing Solution performs this work fantastically fast (Our first backtesting modules worked not minutes like this one, they worked days and weeks).
We recommend to check the dozen of the top models. In order to do that highlight these models one by one and click this button:
The program runs Turbo Cycle module with appropriate backtested parameters. Watch how this model looks, try to vary LBC position to see how this model works under different conditions.
If this model works OK, leave it; otherwise close this Turbo Cycle module, go back to backtesting module, highlight the next Turbo Cycles model and watch how it works. We recommend to choose 1-3 of the best models.
Very often the cyclical models are tend to inversions, they are marked this way:
In this case Turbo Cycles module displays two projection lines: a regular one and inverted.
- Step #4: how to interpret the results: the model should provide a "good" projection line on both Test #1, Test #2 and Test #3 intervals
When you run this module, the program sets the optimal parameters
automatically, so you need just click ![]() button and wait
while the computer will do this job.
button and wait
while the computer will do this job.
Here is the algorithm of verification of the projection line. It creates three testing pieces of price history (Test #1, Test #2 and Test #3):
These intervals are used to verify the projection line. Let's consider this line:
![]()
[Forecast 50] - means that this model allows to forecast 50 bars ahead. If you have downloaded the daily chart, it will be 50 trading days forecast, if you use 1min. chart it will be 50 minutes forecast.
[Test #3 54.3% (+89/-75)] - means that on Test #3 interval this model proved 87 "good" forecast versus 75 "bad" forecast, i.e. in 54.3% of the case we have "good" forecast. The similar information for Test #2 and Test #1 intervals is presented.
The model should provide a "good" projection line on all three intervals, Test #1, Test #2 and Test #3.
You can find the information about these intervals here:
In other words in our particular case the program uses the price history prior 1991 to calculate the turbo cycle models. The rest of 21 years of price history was spitted on three intervals this way: