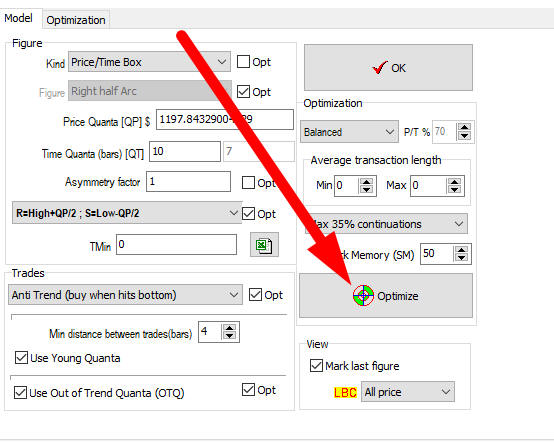
Run Quantum Figures module and click "Optimize" button there:
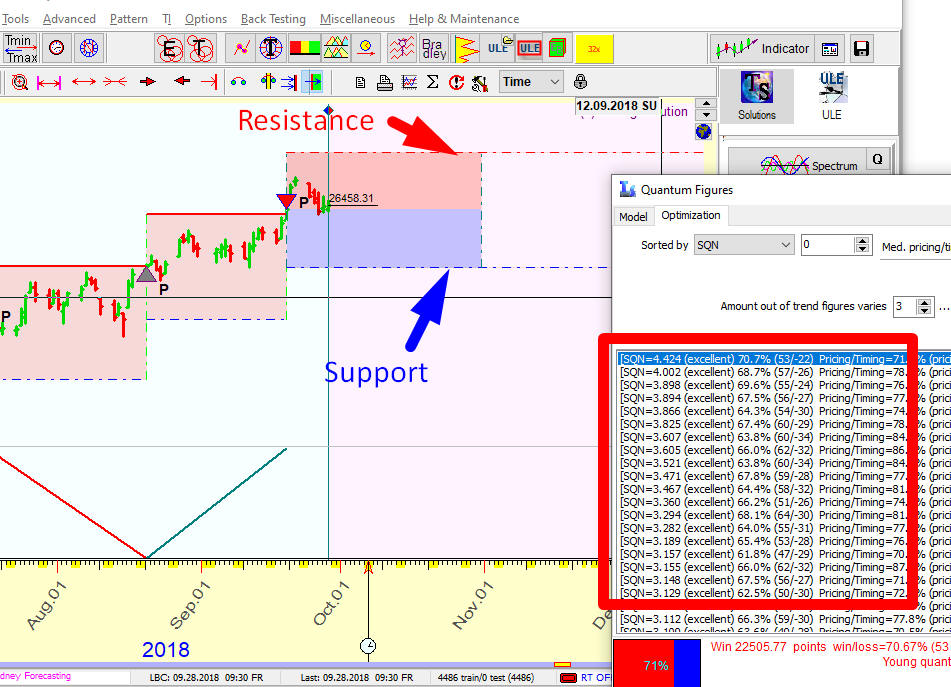
Shortly the list of most profitable quantum models will appear. It is recommend to check these model one-by-one, choosing the model with the best equity curve. Each model generates uncompleted quantum figure, the sides of this rectangle can be used as support and resistance levels for anti-trend models:
How Qantum Figures module works?
First of all, the name, "Quantum Figures". It comes from a Latin word "quantum", having several meanings. We consider it as "a particular amount", "a share or portion". The use of Quantum Figures is not an application of Quantum Theory, though the definition from physics ( "a discreet quantitty of energy proportional in magnitude to the frequency of the radiation it represents" or "an analogous discrete amount of any other physical quantity, such as momentum or electric charge") might help to understand the idea better.
Quantum Figures module is designed to single out special geometric figures in price/time space; we call them "quanta". Here is the example of one of them:
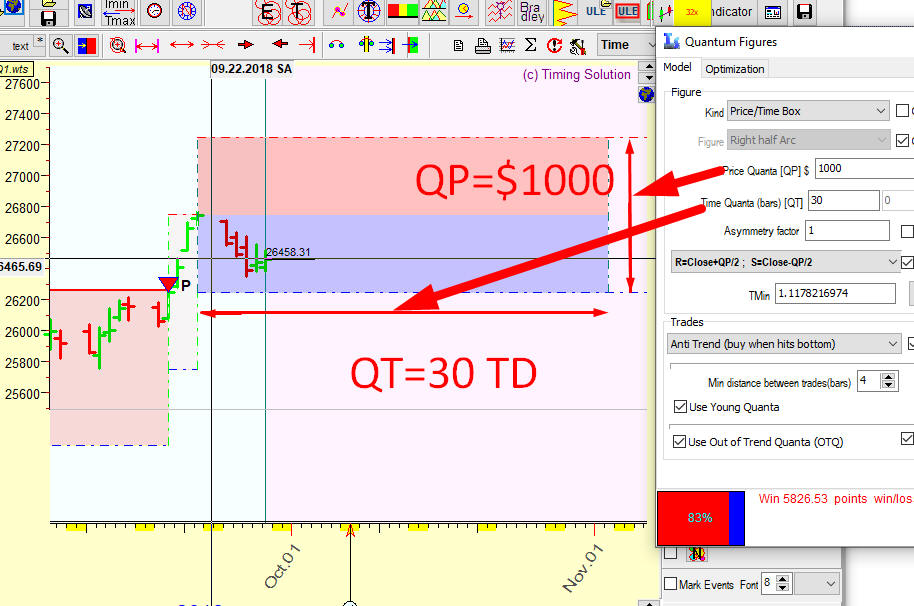
This particular quantum figure is constructed as a price/time rectangle, the height of this quantum is $1000, while its length is 30 trading days. We ignore the price moves within these rectangles. We expect some important event happening when the price hits the rectangle's sides - quanta breakdown:
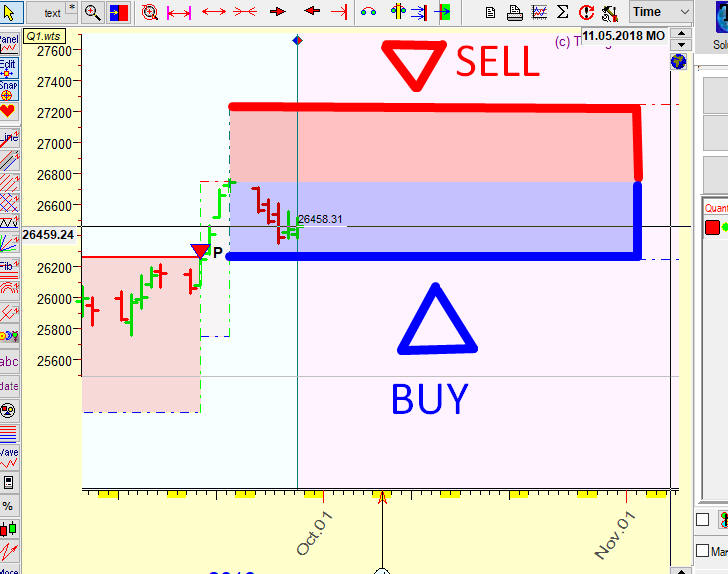
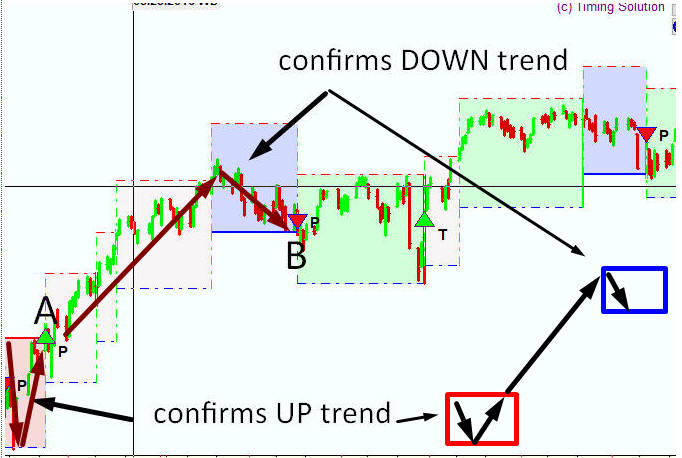
We consider BUY signal when the price hits a bottom side or a middle of the right side of this rectangle. This portion of the rectangle is marked by blue color. In other words, we expect an uptrend movement when the price leaves a blue rectangle.
And vice versa: we consider SELL signal when the price hits the top side or another half of the right side of our rectangle (marked as red); - we are expecting a down trend movement.
When the price leaves our quantum figure, we immediately begin building a new quantum figure based on another piece of the price chart information.
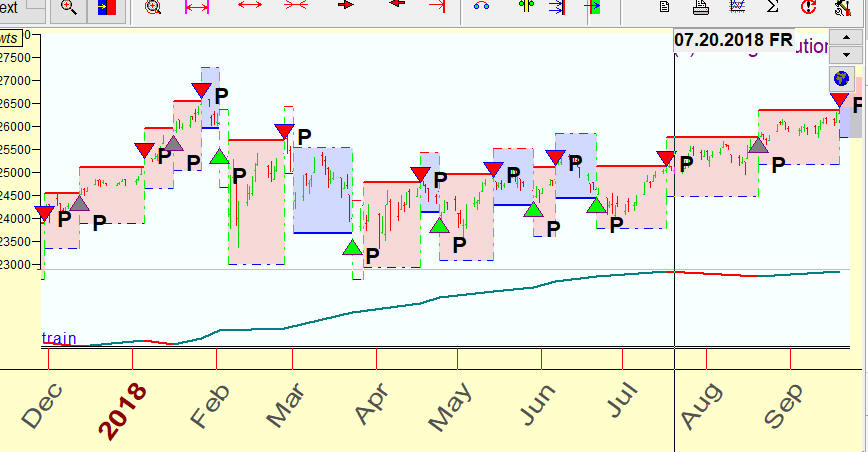
Here is an example of buy/sell signals generated by quantum models:
How to use this module for trading? The program optimizes parameters of quantum figures, finds the most profitable quantum figures and shows the uncompleted quantum figure based on the latest price history (its parameters can be used as support/resistance lines):
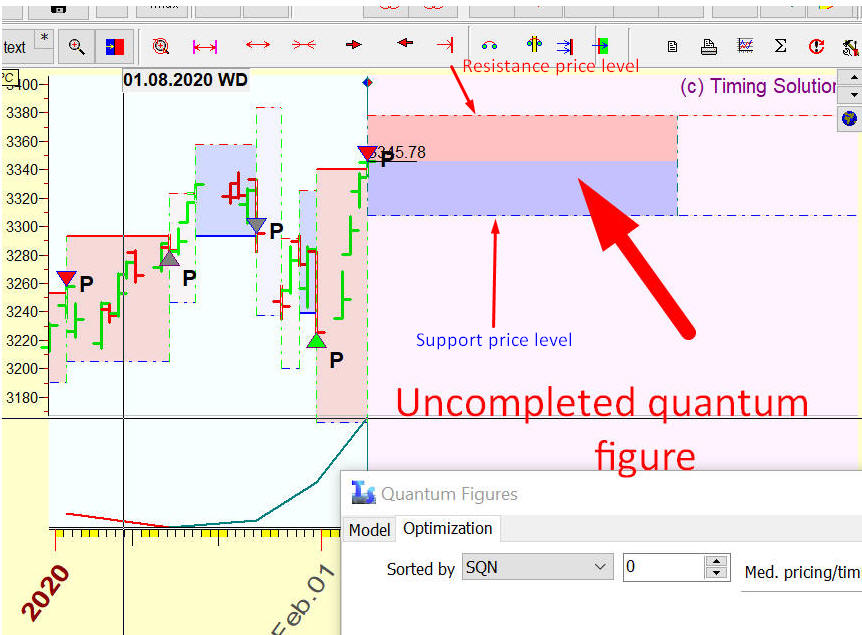
With this module, a trader gets a notice of critical price levels where the price tends to change its trend, together with possible dates where a trend change is more probable. In the example above, a blue rectangle generates the support level (buy signal) while a red rectangle shows the resistance level (sell signal).
The price can hit/break our quantum rectangle from the price side (top and bottom sides of the rectangle) or from the time side (a right side, or a height of the rectangle):
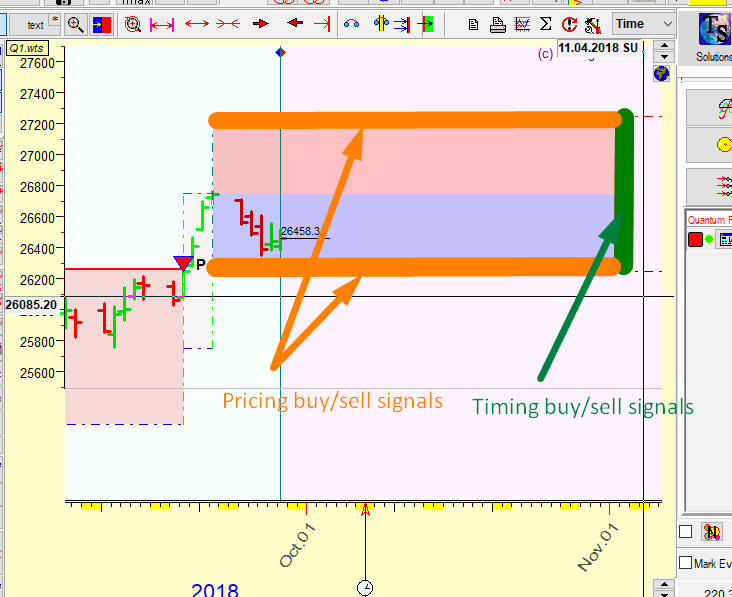
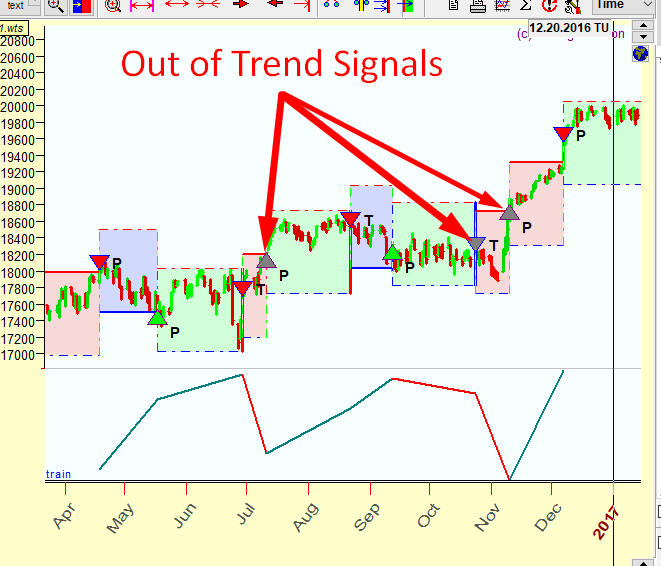
Thus, one and the same quantum figure provides two types of trading signals. We can call the first type of those signals "PRICING signals" and the second ones "TIMING signals". These signals are marked by symbols P (i.e. pricing) and T (i.e. timing) accordingly:
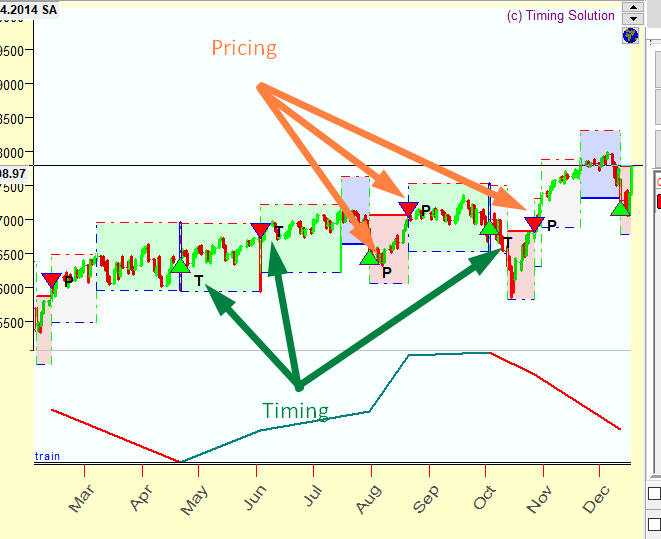
For your convenience, quantum figures that generate timing signals are marked by lime color, while figures that generate pricing signals are marked by light red and light blue colors:
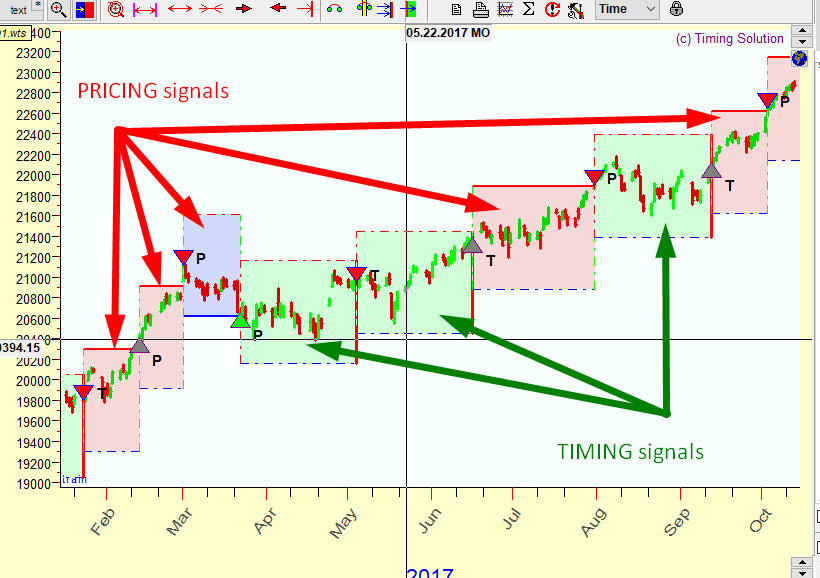
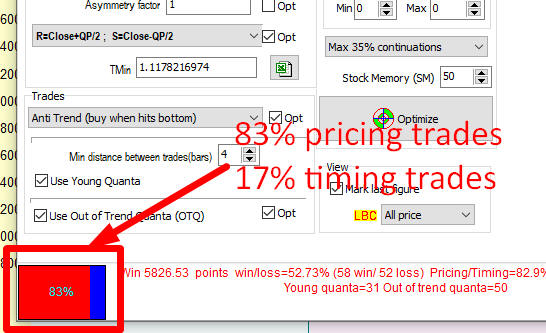
It helps you easily see where pricing or timing works. Also for your convenience, there is a bar that shows the balance between trade signals derived from pricing and timing:
Pay attention: in this approach we analyze timing and pricing using exactly the same mathematical procedures. We do not do price detrending (that would be mandatory in applying classical cyclical analysis). Classical cyclical analysis is more about timing, and necessity of price detrending is a big issue when cyclical analysis is applied for the stock market. Quantum Figures approach allows to consider a cycle existing in two domains: price domain (pricing) and time domain (timing). We do not need to preprocess the price (like we would have to do applying classical cyclical analysis); instead, we can work directly with the price as it is.
Trend/Anti-Trend option allows to invert signals, from buy to sell and vise versa:
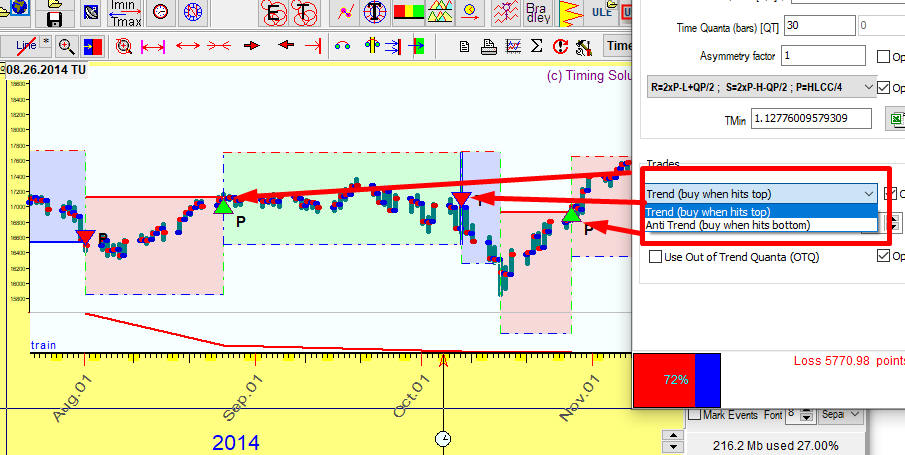
In other words, using anti-trend model we have BUY signal (expecting an uptrend movement) when the price hits the bottom side of the rectangle. And, for trend model, BUY signal is generated when the price hits the top side of the rectangle. Trend and anti-trend models incorporate a different logic of the price movement.
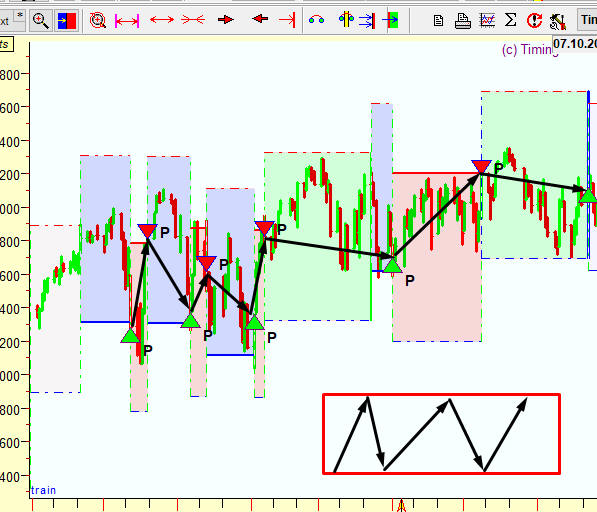
Anti-trend model incorporates the side trend price movement, when the price moves within some channel. This channel changes in time, though the general price trajectory is the same; the bottom and up sides of the quantum rectangle play the role of support and resistance price levels of that channel:
Trend model represents a trend following strategy. The hit of the up side of the rectangle is a confirmation that the uptrend starts, and we generate BUY signal (expecting uptrend movement). While in anti-trend model hitting of the upside of the rectangle means that the price has reached a resistance price level, so we expect a down trend. This is how a trend model works:
It looks like since the end of 1970s anti trend models worked mostly. We did a research regarding this subject; it is described here: https://www.timingsolution.com/TS/Articles/trend_following/index.htm
It is good when the price movement is exactly as we have anticipated it. There are moments when it is not. What to do in a situation when the price goes wrong?
Look at this example. The program generates a buy signal because the price hits a bottom side of the quantum rectangle. And - the price hits the bottom side of the next rectangle as well:
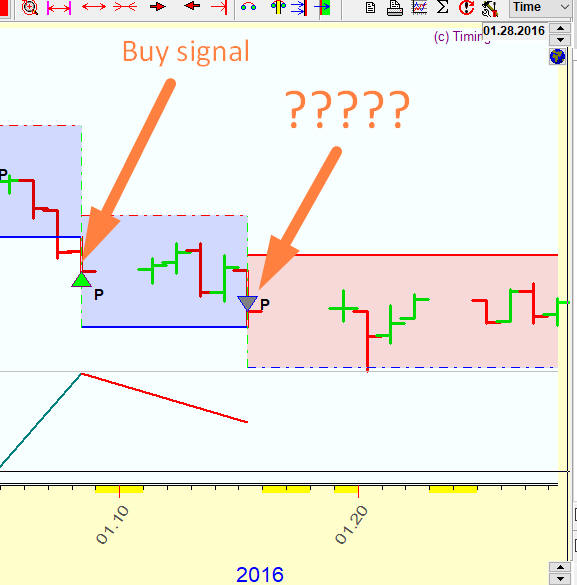
Following the rules above, here we have two buy signals in a row. How to handle the second buy signal? There are two choices here:
#1: ignore this signal accepting a loss or drawdown;
#2: SELL instead of BUY when the price hits a bottom second time. We activate here a kind of stop loss, though not quite a stop loss - we open a short position, i.e. we are expecting a down trend movement.
We call these quantum figures Out of Trend Quanta (OTQ). The trading signals generated by OTQ are marked by grey color:
You can activate/deactivate OTQ using this option:
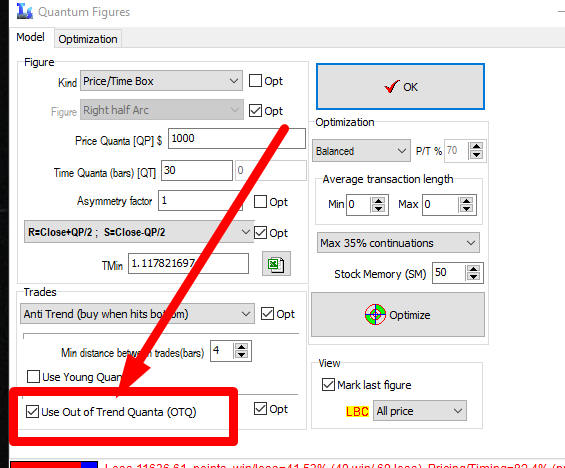
It is recommended to keep this option ON.
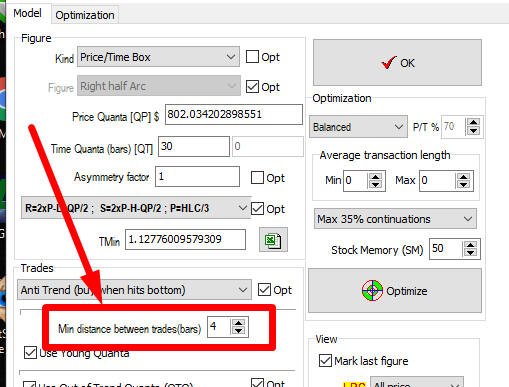
To avoid too fast trades, set the minimal distance between the trades here:
Sometimes the price may break a quantum figure earlier than that. We call that "Young Quanta". What to do in this situation?
Again, you have two choices here:
#1: ignore this breakdown
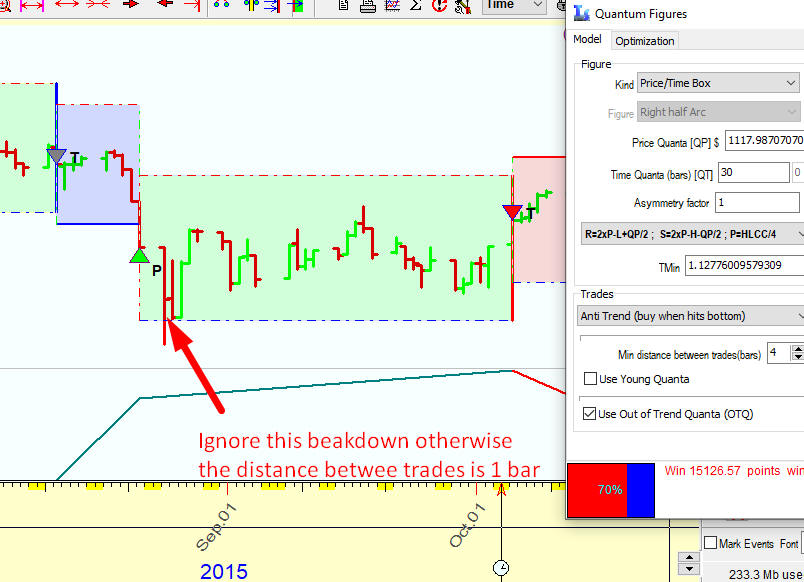
#2: build a new quantum figure that is based on this early breakdown and trade using this new quantum figure:
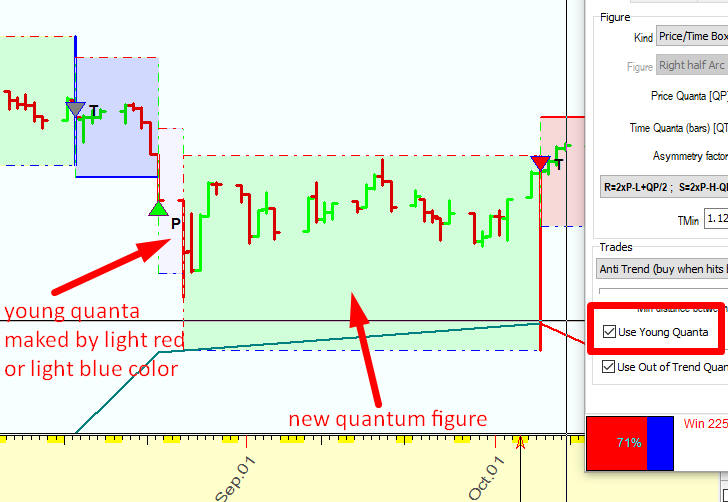
To use this algorithm, set "Use Young Quanta" option ON. The young quantum figures/quanta that are generated by early breakdown are marked by light blue or light red colors.