TRADING WITH TIMING SOLUTION
By Anthony Tsousis
The
first thing to consider is a useful wave; this is derived from a bit of
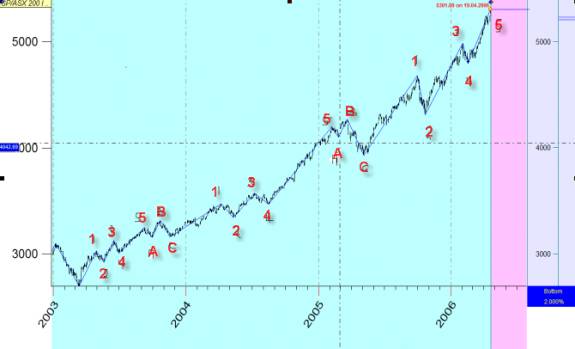
experimenting and fiddling. Look at the first chart. This is a 2% swing on the
close price, easily done with Timing Solution. It is the Aussie SPI 200
Index from March 2003 Low. Nothing sophisticated, just a basic Elliot Wave
count, 5 up waves, and then a 3-wave ABC corrective count. It just keeps
running perpetually. This may not be, to Elliot theory specialists, anything
near what they consider accurate, but with the 2% swing it filters all the
noise out and is useful. We are at wave 5 so the ABC correction is looming, we
are expecting a minimum swing down of 2% based on the close of the High bar.
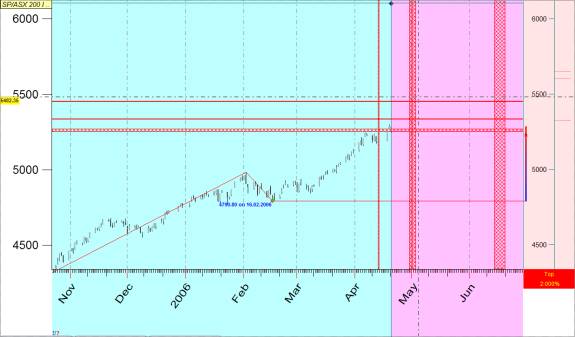
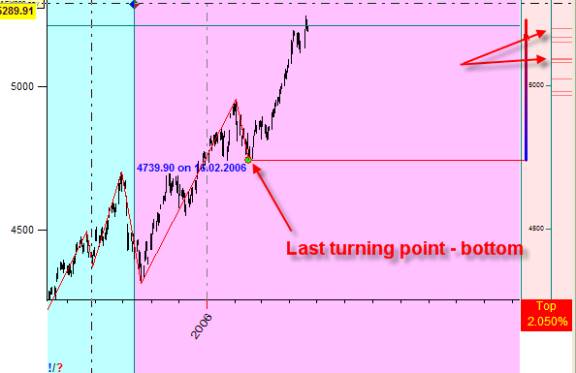
�But before we consider the down swing, let�s
try and see if the upswing is reasonable in time and price by using the Turning
Point Analyzer. By using the last 8 waves for Time and Price movements, we can
do series of cluster projections and present them on the chart as red
lines and can see the last pivot on 16/2/2006 at 4790 points. You can see
prices at between 5300-5400 or so, and timing points in early May and well into
June. Will it keep on going or correct down by a minimum of 2% to satisfy our
swing criteria? Top picking is an expensive past time, so we need an entry
filter.
You can
look in any Technical Analysis text for an education on all the various
reversal bars; these are useful some of the time, but hit and miss; so we need
something else as well. In this example we will use the crossover of 2 moving
averages, the 4 day and the 18 day, both simple and on the Close price, the
purple is the 4 day and the green 18. On the next chart you can see the swings
coinciding with the crossovers.
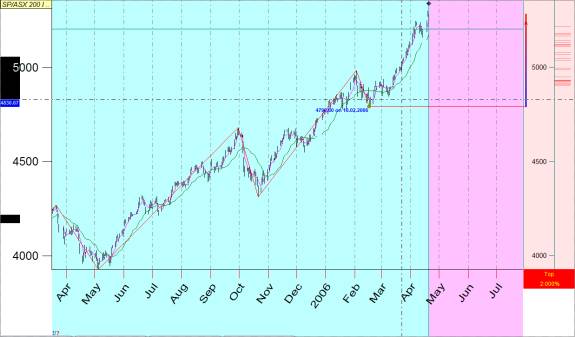
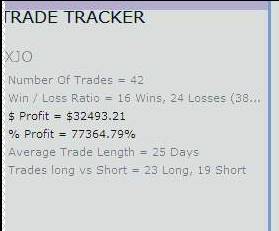
On the
next chart, which has data from March 2003 using the 2 M.A.S and only that
technique for the entry and exit to reverse position etc., there have been
about 40 trades, 16 wins and 24 losses and on 1 contract at 25.00 dollars a
point you could have accumulated about 32500 dollars.
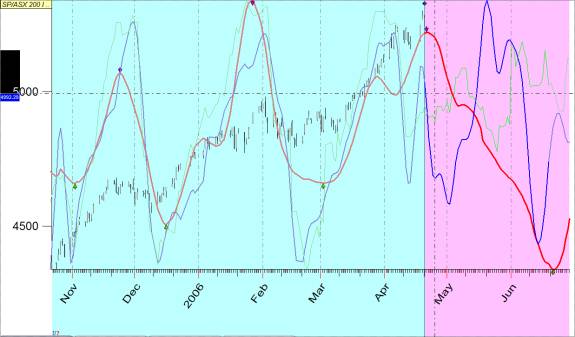
This
seems to be a better strategy. To further refine the process, we will run
another series of models in Timing Solution. The next chart has 3
independent projections, an Astro, a Dynamic and a Spectrum � all based on the
2% swing (they can be based on RSI, RPO or any indicator that you fancy, but in
this case it is the swing). You can see in the rated model that the Astro wins,
it is calling the top and descent into mid-June while the blue line, the
Dynamic, is taking a more circuitous route to the same time and place.
So let�s
go short when after a reversal bar and the 4 day crosses the 18 day and ride it
down for at least 2 %. Let�s assume that�s going to happen; we can see a down
projection (make sure it is the pivot point and do not pull the trigger too
early, never just trade the forecast, it must be the market showing the way and
not your hopes and wishes.)
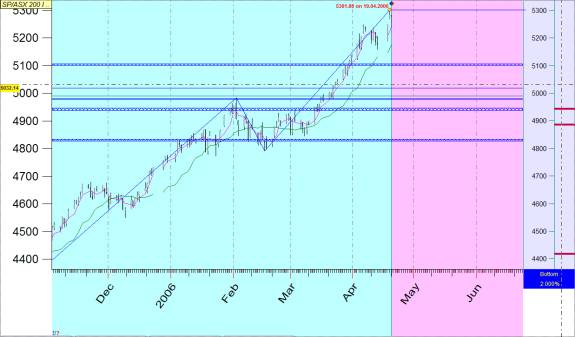
As can
be seen, we have a series of to waypoints from 5100 down to the low 4800s, you can
also do timing lines as well. This way we can refine the mechanical entries of
the 2 M.A. crossovers and have realistic projections based on a number of
models for added certainty. What if it goes pear-shaped? Have dollar stops
proportional to your account size and risk aversion in place. And do not be
afraid to re-enter when it does go in your desired direction.
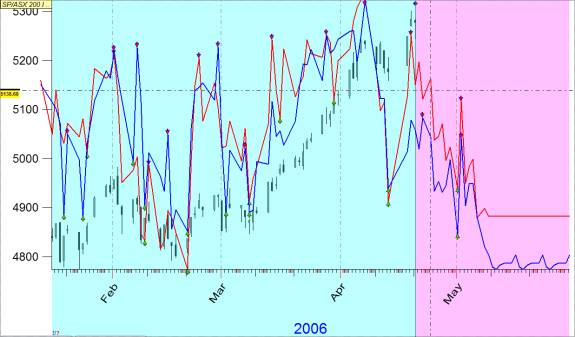
Just to
demonstrate the versatility of the software, we�ll do one more projection using
the regression and candlestick model and see what it comes up with, the horizon
is for 7 bars, the top may well be in. When your confidence grows with
experience, you can enter closer to the pivot as may be seen the moving average
is indeed a lagging indicator, but it is all about money management and risk aversion
or aggression. The chart shows a descent into May, time will tell. I hope you
find this informative and useful.
I have
profitably traded currencies with this style and you will find it useful for
any instrument. The trick is finding the swing size for your stock, currency,
index, commodity etc. and a decent pair of moving averages and of course TIMING
SOLUTION software.
SOFTWARE TIPS
By Sergey Tarassov
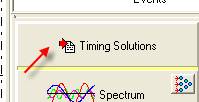
This
technology is mainly based on Turning Points Analyzer and Solutions modules.
Turning Points Analyzer: after downloading the price history, open this module by clicking this
button:
This
module does the statistical analysis for zigzag swings ratios and displays the
high probability zones � the zones where the price reversion is most probable.
You need
to keep your eyes on the last turning point:
Zigzag
parameters are pretty important here as well:

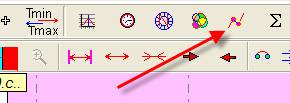
Timing Solutions module: it is a way of getting the projection line easily. Just click on this
button:
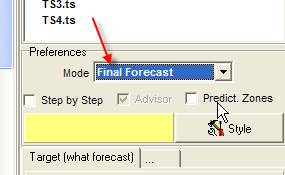
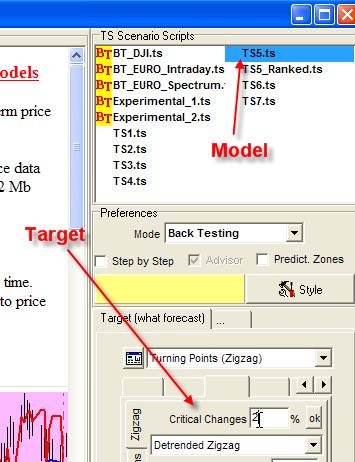
In the opened
window, chose the solution (TS5, as� in
our example) and the target � the thing you would like to be forecasted:
But
before actually running this Solution, click on this button:
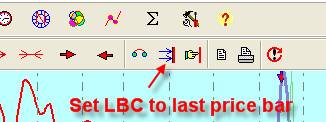
Thus you
tell the program to provide the final forecast using all available price
information. The same result can be reached by choosing this parameter in the
Solutions window: