Annual cycle in July-August: "August drop"
Annual cycle is the most important cycle in finance. However, we face with one problem while calculating this cycle for Dow Jones Industrial index.
Look at this chart
:
Here you see three Annual cycles:
Red is Annual cycle that is based on latest 3 years of Dow history, it shows the most typical tendencies that took place within 3 last years.
Blue is Annual cycle that is based on all available Dow history since 1885.
Aqua is Annual cycle that is based on the last 10 years.
You see, there is a significant discrepancy between these Annual cycles in July-August.
According to the Classical Annual cycle (blue curve) that is based on whole 127 years Dow Jones history, we can expect the continuation of the rally till the beginning of September - "September drop".
While the "younger" Annual cycles (red and aqua curves) indicate the drop in the end of July (July 26-30). Let's call this phenomenon "August drop".
This phenomenon "August drop" has appeared in 50s years. In other words, some economical gears used in 50s brought this phenomenon to our life. Then it has disappeared or became uncertain It returned back to our life in 90s- 2000s.
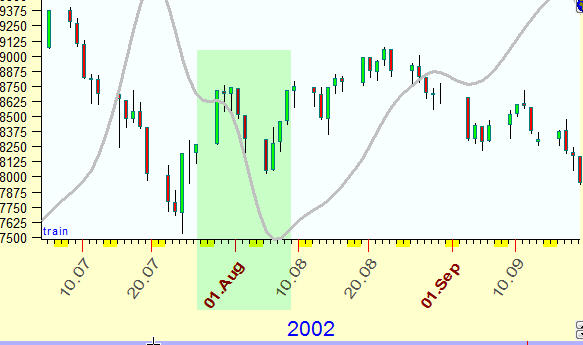
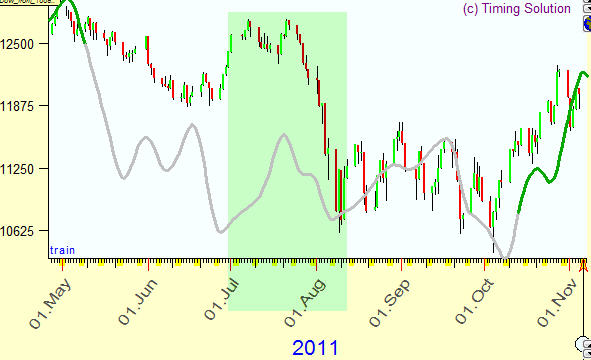
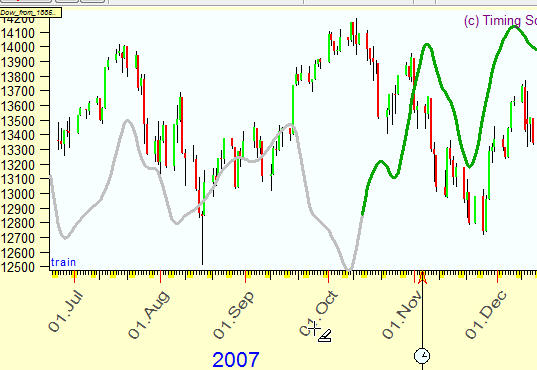
Within last 10 years August drop/correction took place 6 times:
in 2011:
2007:
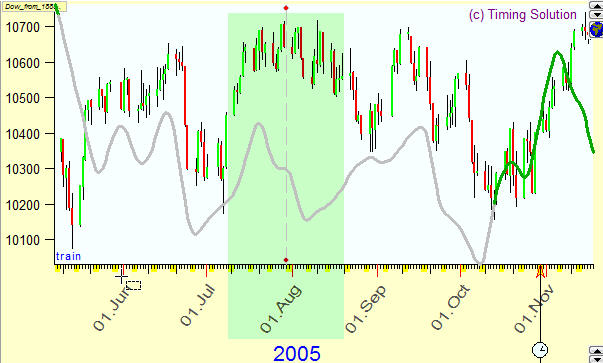
2005:
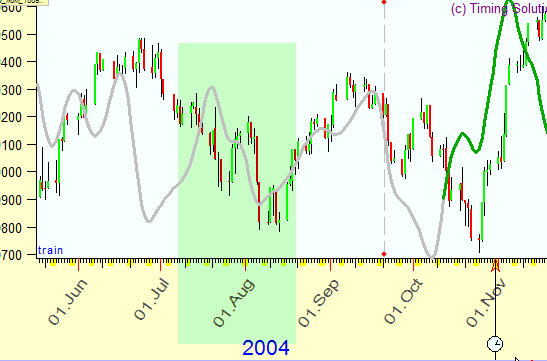
2004:
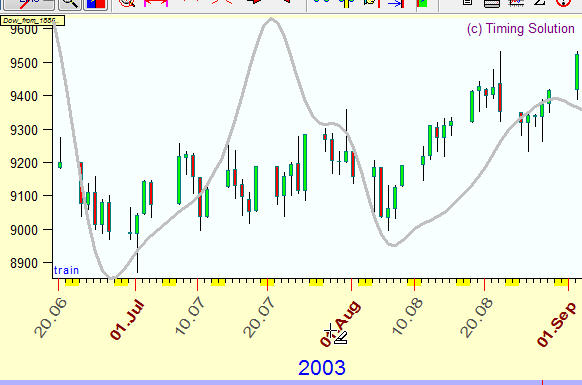
Small correction in 2003:
and 2002: