Layer Your Analysis to Improve your Forecasts
This article is an example of using multiple modules and timeframes that are available in Timing Solution that may help to improve your market analysis.
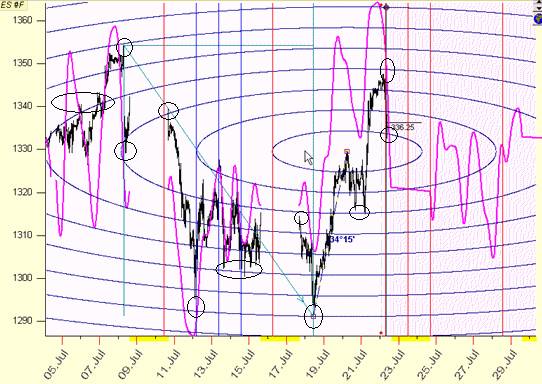
We will start with the Fibonacci module and using only the time option, I am using a 15 minute chart and trading the S&P a500 e-mini.� Drawing from the high on July 8th to the low on July 18th, we can identify three possible targets for a tradable high and possibly a tradable low.
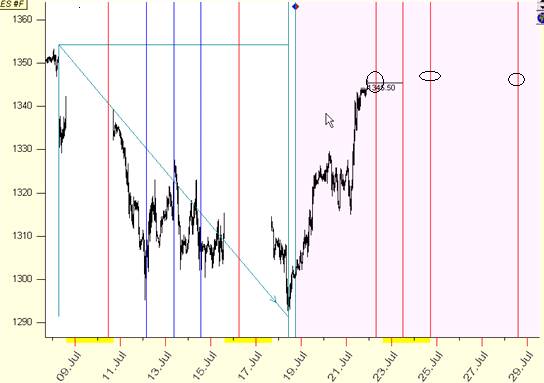
Lets try and narrow down the options by using the spectral analysis module.� In the diagram below we see the same three suspect highs.� I left the LBC a couple days before the current time to increase the confidence level that the forecasted neural net turning points remain valid.
Notice how the Fibonacci timing analysis� coincides with the same turning points as the spectral analysis on Friday July 22nd and the 29th.� The high on Jul 25 is a Monday morning and the neural net has placed it there instead of the fib timing of Sunday evening.
This has not resolved our tradable turning point questions other than giving us confidence the indicated areas may still be of some interest.
.�
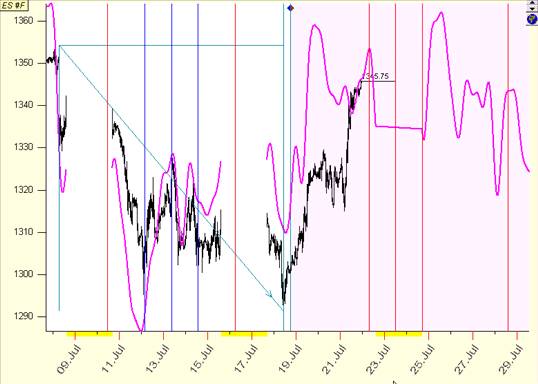
Lets move out to a larger time frame, this time using either a two or three hour window
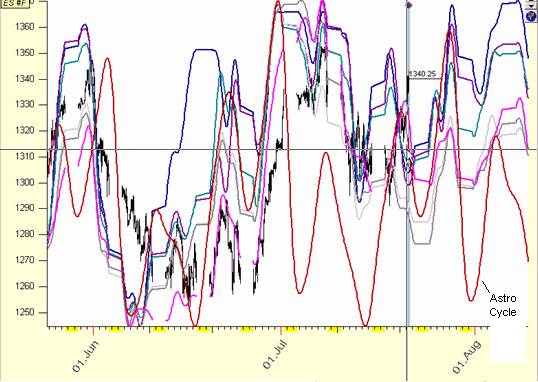
Here spectral analysis has voted for the high on July 28th as being more significant but as you can see, it has also identified a possible low on or about the end of the month and another possible tradable high between Friday Aug 5th and Monday Aug 8th. Lets see if we can get some help from our Astro Indicators.�
Here Moon Moon geo votes for turning point at July 28th with secondary high at the first week of August. In the second capture Sun annual cycle argues for high on Aug 5th to 8th, also showing a possible high on the 29th. Our next picture using the composite box and adding another term involving the inner planets, we begin to finalize our turning point analysis.
Here Composite Box appears to confirm our neural net spectral analysis for highs to occur on or about the 28 and 5th with an apparent low at the beginning of August.
 �
�
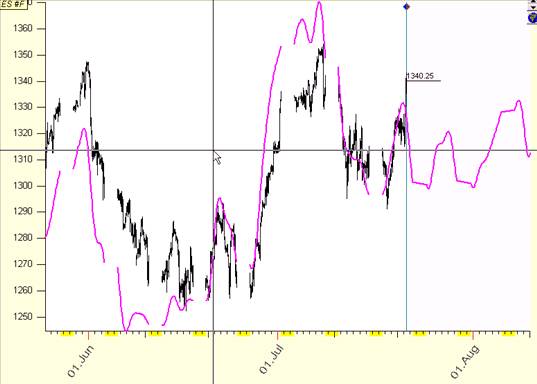
The following diagram is the same as above but with the addition of the LBC being placed at every Monday over the past 6 weeks and the neural net retrained.� Note the persistence of the cycle analysis highs and lows all seeming to confirm each other.� Today�s projection is virtually the same as that forecasted 5 weeks ago and every week in between. Also take notice that the composite astro cycle seems to confirm these turning points.� This persistence gives further confidence that the cycles may continue into the near future.
Lets try and tighten this up a bit by returning to the 15 min chart and moving the LBC out to its final point and retrain the NN. This is the following morning. The market has turned down as anticipated in diagram #2 This increases confidence that our cycles are active.
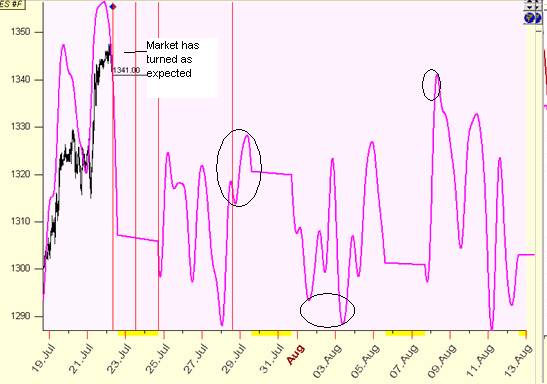
I�ve circled the areas of interest.� If the Market continues to act as expected and moves up into the 28th, these areas may turn out to be tradable turning points.
One last point here.� You may have noticed I completely ignored price here.� The prognostications seem to indicate probable directions especially on the longer-term chart.� You must always be aware the Market IS BOSS and we may see inversions at any time.� If the forecast is not being followed, something has changed, protect your capital.
There is a reason I ignored price.� I am not really that concerned where the price is at the time the turning point is reached.� I will buy or short against support or resistance when the time is appropriate.� As Gann once stipulated Time is more important than price.� In this I am a firm believer.
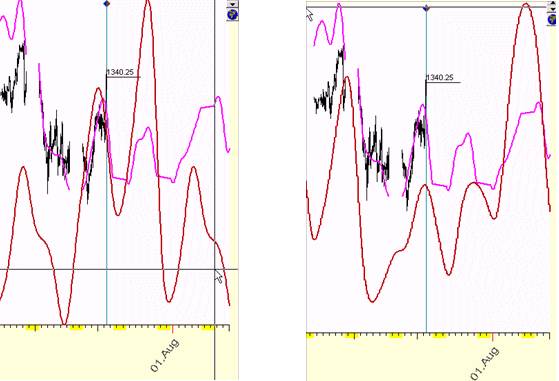
Case in point. Using 2d Time Price Planetary Distance module, here are expected levels of support or resistance. Notice how at the turning points the PX is usually at or approaching a planetary line.
Look back in time and verify that this does in fact occur when setting up your charts.� Then go forward in time and verify that it continues to do so.� This builds confidence that your expectations will be correct.
Conclusion:
We started with a simple Fibonacci time forecast on a relatively short term 15 minute chart.� We than continued to build the analysis by adding a Spectral Analysis and optimizing it with the Neural Net.�� Since this was inclusive we moved out to a longer time frame and rebuilt our Spectral analysis.� This seemed to verify our turning point date of the 28th but also indicated another high and intervening low on the 5th and 1st of the month.�
�
Again we layer another analysis with the Astro tools and these seem to confirm our last analysis of probable highs and lows.� Even within the Astronomy module we layer our forecast by using multiple objects.� Sun, Moon and inner planets, all confirming our prognostication of multiple highs on the 28th and 5th to the 8th of August.
Finally we finish with the 2d Time Price Planetary module for possible price support and resistance. We could have gone deeper by using other modules and/or other Fibonacci price and time indicators. But I think you get the idea, where ever possible use multiple confirming analysis for increased accuracy and confidence.
This is educational material only. This is not trading advice nor is it a solicitation to buy or sell any product.�
Juan Cruz
Private Investor
�