Phenomenological Models
How to make long term forecast models using Timing Solution software
written by Sergey Tarassov
A good forecast is based on a proper model. It means that the choice of the forecasting model is important. Actually, this is the first thing to do in forecasting - choose the model that is the best for the problem that needs to be solved.
Let look at one practical example. Somebody wants to know what is most likely to happen to the financial instrument X. In other words, we need to do a forecast for this financial instrument (here I do not provide the name and actual data file for the financial instrument X as it is a part of a commercial project for one of our users; however, I understand that it is an additional information that helps to choose the proper model).
The available data file covers more than 200 years of history. And the task is to make a long term forecast.
First question is: what this forecast should be based on? The Timing Solution has a huge arsenal of methods that allow to make a forecast easily, just by few mouse clicks:
The specially developed Object Oriented Neural Network allows to get the projection line that uses the maximum of all available historical data.
The question is: what technique is more suitable for this particular task?
We state that the use of astronomy based models is the best approach for this task. It looks like this is simply the best choice. The long and hard Back Testing work shows that the regular spectrum based model very often reminds the kite without the rope. It is there, and we cannot do much; it follows some high winds that we may not be even aware of. The Spectrum module reveals the playing cycles very well; however, this approach fits very well to the short term forecast. But when we try to apply this technique to the long term forecast, we fail. To make a long term forecast, we should find a support of something more fundamental. Astronomical cycles are the best for this task.
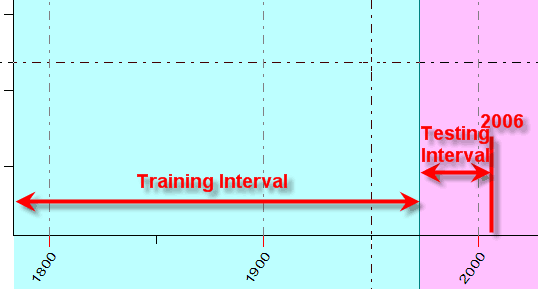
So, we download the price history (sorry, the price chart is not displayed due to reasons mentioned above; the main idea of this Study article is just to show how to make a long term forecast):
Usually we divide the price history on two intervals: blue - training interval - we use this interval to research our data and train the Neural Net. Red - Testing interval serves to verify our models. The "future leaks" are excluded.
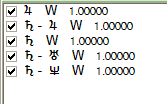
These are monthly data, and we need to decide what astronomical cycles can help with our research. Keep in your mind this table of planetary periods:
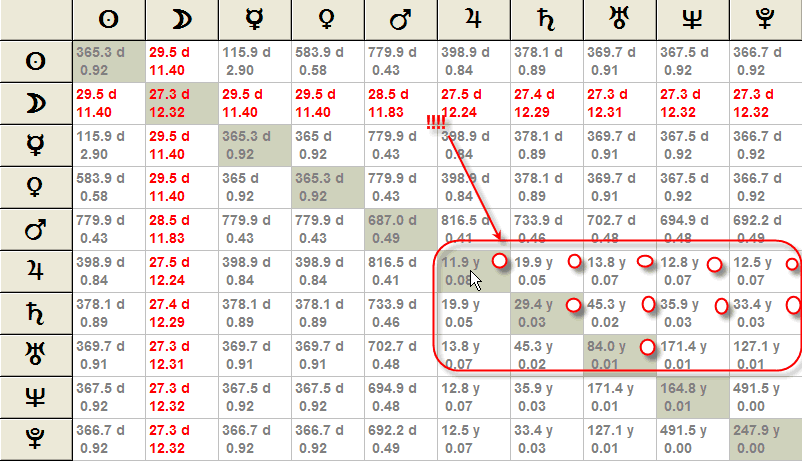
I marked the cycles that are more suitable to research 200 years of monthly price history.
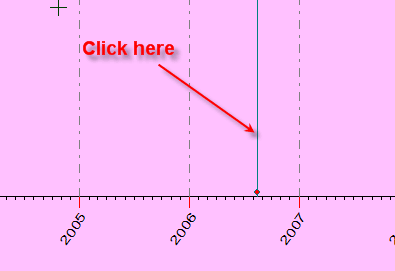
Do a mouse click somewhere in the middle of 2006, to mark down where we are now:
Run ![]() module to reveal the astronomical cycles and set
this parameter in "Options":
module to reveal the astronomical cycles and set
this parameter in "Options":
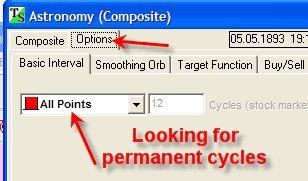
In other words, to calculate the composite, we will use all price history on TRAINING INTERVAL.
This option reflects different approaches to the nature of astronomical
cycles' impact on markets. Setting "All Points" option, we state the permanent approach.
We assume that some planet affects the stock market the same way in the year 1790, in
the year 1850,
in 1900, and now - the effect is always the same; we speak here about the
infinite memory of the market.
Another approach is finite memory (under this approach, we believe that the Moon's impact on the stock market in 1980
differs from what it is now).
We have not find a final answer to that question; however, it looks like this scheme works better for slow planets.
Now we need to look at all composite diagrams one-by-one.
Look at this Jupiter cycle composite:
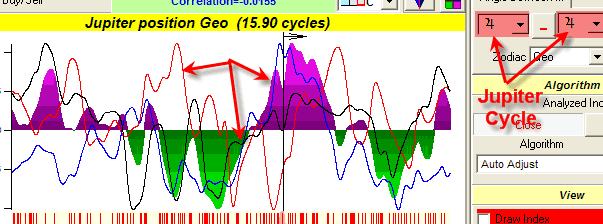
Besides the major colored diagram, you can see three red, blue and black
lines that correspond to composites calculated on three different independent
price intervals.
We can take this cycle as an important one if these three lines demonstrate the
same tendency. We speak about tendency as it is very difficult to make formal
criteria to estimate the cycle's importance. This diagram gives us some hints
though we understand that these criteria are not mathematically complete, the
intuition is very important here. It is why we call these models
"phenomenological".
Something tells us that Jupiter is very important for this financial instrument, the diagram confirms this fact.
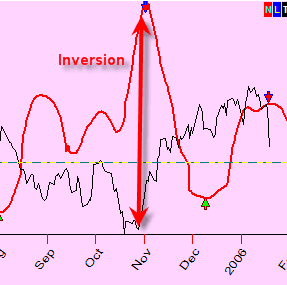
Please be aware that the "inversions" are possible in our diagram:
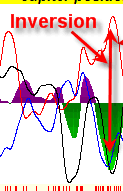
The existence of inversions points at the non-obvious and/non-linear reaction of the stock market to this cycle. The black vertical line on this diagram shows the cursor position; we set it in the middle of 2006. It is necessary to figure out what phase of this cycle we are now in.
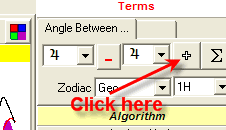
When you decide that this cycle is important, click "+" button:
Another important cycle is Jupiter-Neptune cycle:
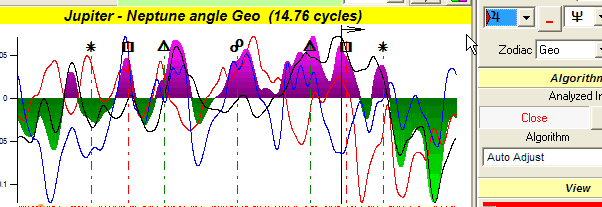
Click "+" button again.
Also, the Saturn cycle looks appealing:
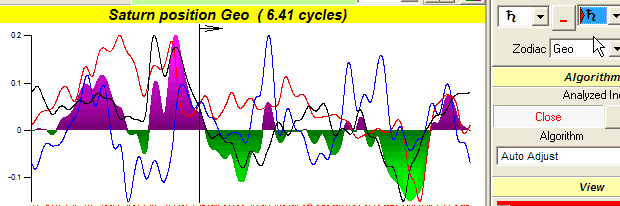
Thus, we choose three cycles that we believe are able to move this financial instrument.
To prepare these cycles for the Neural Network module, send them into the clipboard:
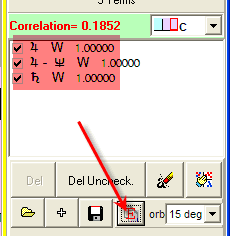
You can play with "orb" parameter as well, let's set it on 15 degrees.
Now is the time to make a projection line based on these 3 cycles.
Run Neural Network module.
We need to define what we want to forecast. Because our financial instrument has a trend, we recommend to use the relative price oscillator:
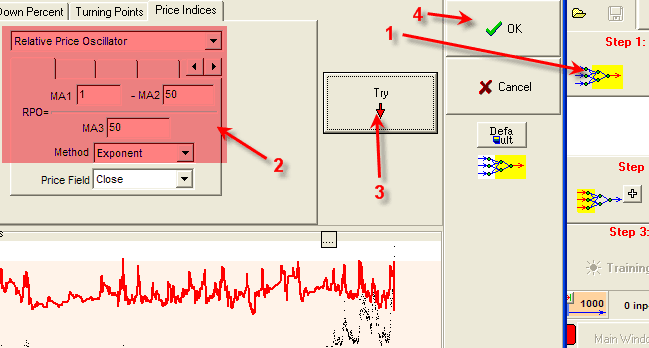
We can play with different variants.
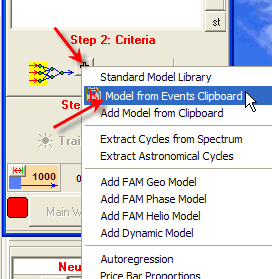
The next step is to define "inputs" - what this forecast is based on. We just need to pick up these cycles from the clipboard:
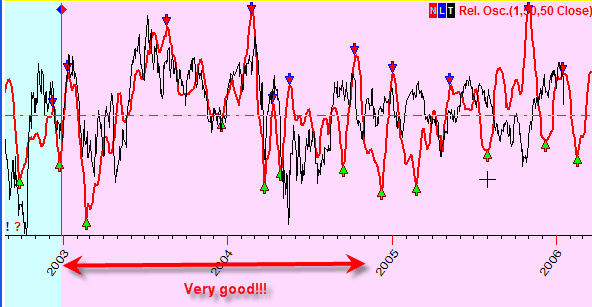
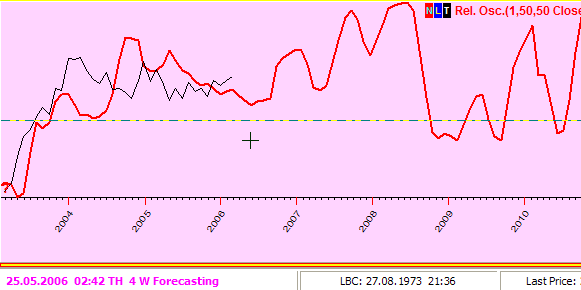
Train the Neural Network ("Training" button) and look at the projection line:
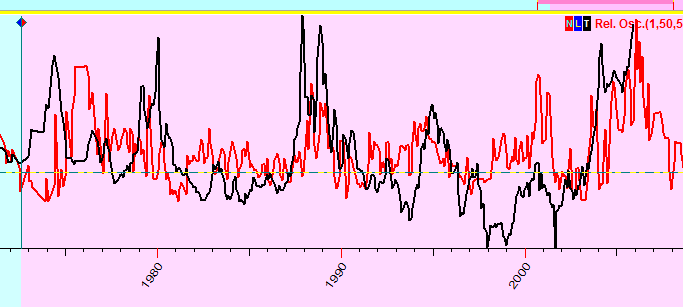
Here the red interval is Testing interval, we do not use the price points from this interval neither to calculate cycles, nor to train the Neural Network. The "future leaks" are excluded.
The red curve is Neural Network projection line, while the black line is the
Relative Price Oscillator for our financial instrument.
You see that the red line reflects the major movements of the real price rather well. This gives
us the some confirmation that we are on the right track.
Now we are ready for the final optimization - ready to make the final forecast that is based on ALL available price information. Click here to set LBC (Learning Border Cursor) to the last available price point:
This is the forecast:
To be sure that I am not missing any important factor, I have created the Neural Net projection line with more astronomical cycles added. They might be not so important, however it is good to see...
This is the forecast:
Compare this with the projection line produced by Spectrum based model; we will face the "reaction" effect. The Spectrum model does not support fundamental cycles, and it looks like it is blind regarding the long term forecast. This model is good enough to pick up the latest cycles and make short term forecast. If we apply the Spectrum model to our instrument, we will get:
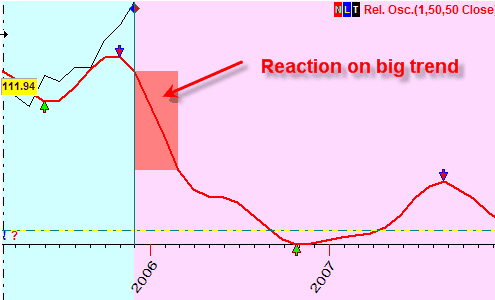
Our financial instrument has a big up trend within several last years while the Spectrum model tells that the trend will be finished immediately (you can easily see that varying LBC position). The usage of fundamental cycles allows to avoid this effect.
The difference between Spectrum and Astronomical models is like the difference between a person who makes his/her decisions based on rumors and gossip and a person who prefers to know fundamental factors. But, as I said earlier, for short term forecast, the Spectrum model is pretty good. (Why I consider the astronomical cycles being fundamental is a theme for another article.)
These are some notes regarding this kind of models:
As one more example, let us look at one more financial instrument, TWM. This is Taiwan stock, and I have spent many hours searching for its appropriate model. These are all my steps:
As a first attempt, I have chosen 14 astronomical cycles. I decided that all these cycles were important, and I made a mistake. The projection line based on these cycles was reflecting a noise mostly.
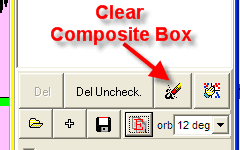
So I deleted all these 14 cycles from my composite box (clicking this button):
Then I disabled all additional information in the Astronomy window and concentrated on most important information:
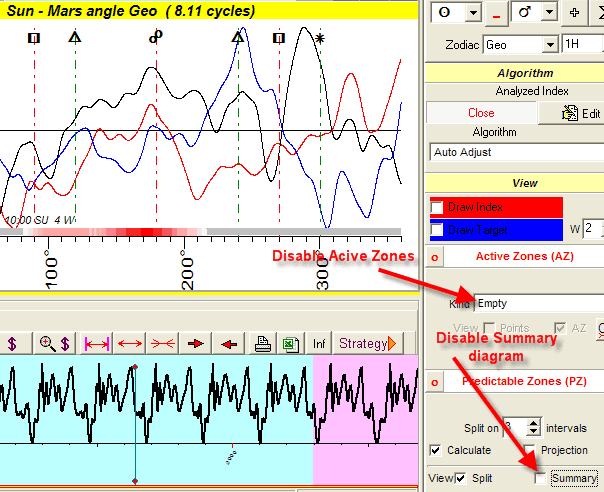
Here you see three independent composite diagrams: red, blue and black. Be
careful while checking all planetary cycles involved. Think twice before clicking
on "+" button to add this cycle to the Composite box. It is like you
are making the decision to buy a new laptop in a big shop. Non-correct decision
- and you will
get a headache solving many different computer problems.
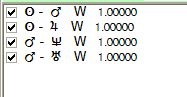
I have selected these cycles:
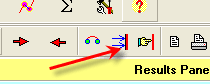
The next step in verification of my hypothesis is creating projection line, here it is:
Practically for two years this model worked very good. This coincidence is definitely not occasional. But then, in the end of 2004, something has happened. It looks like the new factor/cycles started to affect this financial instrument. The market still remembers its old cycles, but very often the reaction to these cycles is opposite to what has been expressed by the inversion effect:
I got the same result applying another alternative model (Dynamic model).
This example allows to make the projection line for Dow Jones Industrial
index. As a source, we take monthly data for DJI from 1895 to March 2006; for
the years 1789 - 1885 the specially developed indicator that reflects the pulse
of American economy has been chosen. These monthly data were developed by the Foundation for the Study of Cycles. Bill Meridian
has obtained these data in 1988 and maintains them since that year.
I selected these cycles:
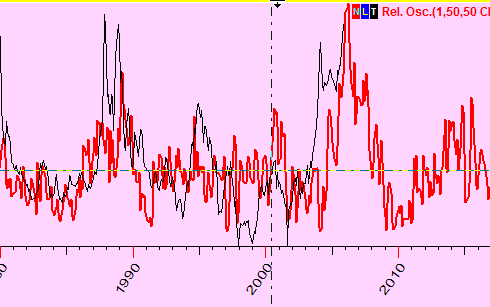
This is the Neural Net projection line:
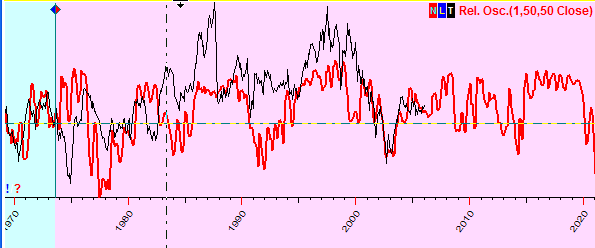
You see that the red projection line describes the DJI changes pretty good. This is more detailed picture:
Why and when should we use phenomenological models?
I specially named these kind of models "phenomenological" because I
have no idea regarding the formal criteria of cycles' selection. Believe me, I tried
a lot, see the documentation, there are eight different criteria of choosing the
cycles. But all formal criteria provide formal results, without adding a "hand" work,
we might lose something.
When pure math efforts are not enough, it is time to give more room for human intuition.
This is the reason why I spend a lot of time setting the parameters "by default".
It allows to the user of Timing Solution software to see the structure of
the model for some specific
financial instrument easily. If the user would spent one second changing some parameter,
there is a strong chance that he/she might forget and miss something really important.
The default settings are like landmarks in models' creation. When the user is
familiar with them enough, he/she is ready to create his/her own models.
The accuracy of math methods applied in the program are guaranteed. To be correct, I must say that we have got very good results for pure mathematical models. See Back Testing results. But all these models are concentrated on short term forecast. When we are interested in long term forecast, math methods are not enough. We have to include something else.
A single human brain contains the information of human evolution from the simplest live forms to the modern humankind. It covers several hundreds million years of data!!! As an example, when we define our orientation in the physical space, we rely on the experience of ancient live forms. Our movements, emotions, thinking are not a product of simple Aristotle logic, their source is much more deeper.
Thus, creating a forecast we should be armed with the modern math for sure. However, we should remember as well that the price can contain some hints invisible in the frames of the formal math. Simply we have not enough price history for that. Our Stone Age ancestors did not trade (at least, there are no records regarding this) and did not have stock exchanges, though we use nowadays their survival experience as well. Sometimes intuition and experience provide better hints - like choosing Jupiter cycle as a fundamental one in the Example #1. We observe here not only the composite diagrams, we keep in our minds as well the information that Jupiter is the largest planet in the Solar system, it is very important in Chinese tradition.
March 9, 2006
Toronto, Canada