Stock Market behavior: Presidential and Fashion Cycles as Fundamental Factors
written by Sergey Tarassov
Lyric Introduction
I believe nobody will argue the fact that the stock market movement depends strongly on mass psychology (which is the way how the masses respond to the events happening in the world). The other fact is that this reaction is changing when the time passes by. Remember yourself 20 years ago, your hobbies, your reactions and affections. They were different then, at least a bit. This is so not only because you are now older or wiser or due to technology advances. Something has changed during this time, something "in the air", and you, being in a good shape and right mind, look at the same things differently. As one poet said: "The other time has other songs; I would sing them too if I would have other ears..." Our behavior is changing with the time as well the behavior of the markets. This article shows some approach to reveal the behavior patterns of the stock market. All calculations and diagrams are provided by Timing Solution software.
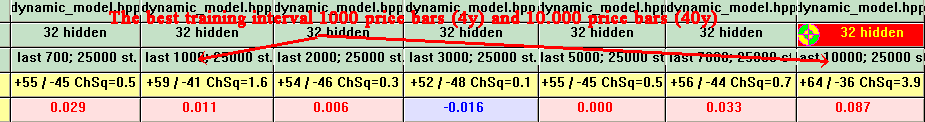
Instead of exploring selected stocks, I have started with the pattern behavior analysis for Dow Jones Industrial index. The end-of-the-day (EOD) data were analyzed, and the Dynamic Model based on astronomical parameters was applied. Doing the detailed Back Testing procedure for this model, I have got these results:
The program has trained the Neural Net based on that Dynamic Model, created the projection line and back tested it. Then the program has analyzed the back testing results from the point of view of the Statistics. The table above shows that, in attempt of getting a good (reliable) forecast, no more than 1000 price bars are enough to train the Neural Net. This corresponds to 4 years of price history data. Logically, if we add more data for training (8 years, or 12, or 20 years of price history), we should get better results. In reality, the results become worse - till we use about 10,000 price bars (which corresponds to 40 years of price history data).
In other words, to get a good forecast, we do not need to have a long price history. 8 or 12 or 20 years are not a simple extension of the data; it looks like the stock market reflected by DJI has some other rules for its behavior for these extended intervals. Therefore, for this model, the usage of all these points does not help us, we only got our cards all mixed up. Making a forecast for the DJI, we need either 4 years historical data (to find the important factors) or 40 years of price history - to find out how these important factors might interact with each other.
Regarding the 4-year data, there is no question about this cycle. It looks like it corresponds to the well-known Presidential Election 4 year cycle. This very important fundamental factor of the changes in political elite has a great impact on the economy in the whole and the stock market as well. The computer analysis based on the applied Dynamic Model confirms the importance of this factor.
Still, two questions have been unclear to me - until I have heard from one of the users the word "fashion".
Question N1: Look at the table above. If we use 40 years of price history, the Neural Net provides a much better projection line than while we use 4 years of history data. Thus, choosing the training interval, we have this dilemma: 4 years or 40 and more? In other words, choosing 4 years of data to train the Neural Net, we have a strong chance to find the playing factors within this interval. While choosing 40 years of price data (and more), the program reveals the existence of some nonlinear process. What is the nature of this nonlinear process?
Question N2: If the Presidential cycle exists, how we can explain this spectrogram for DJI, 1900-2004yy data? The spectrogram is shown here:
It does not show the 4 year cycle, though 3.6 year cycle is present. This cycle corresponds to 40-42 month "Kitchin Cycle" discovered in 1923 by Joseph Kitchin. This cycle is 0.4 years (5 months) shorter than the Presidential election cycle. However, every 40 years the Kitchin Cycle and Presidential Cycle reach the same phase. Thus, we can assume that the 40 years is the interactive period for these two cycles. We can see the same 40 years in Back Testing procedure report.
The following is a possible explanation for these facts.
Presidential and Fashion Cycles
In 1863, John Mills in a paper "On Credit Cycles and the Origin of Commercial Panics" presented "the theory that the mental mood of businessmen tends to run in cycles. According to Mills, business cycles are essentially cycles of credit" (see "Financial Astrology" by LCdr. David Williams).
The extended Back Testing for the DJI forecast based on the Dynamic Model shows the existence of (at least) two cycles: Presidential election cycle with the 4-year period and another Cycle with a period of 40 years (approximately). The interesting fact is that these cycles do not interact linearly. In other words, their summary effect is not just a single superposition of the two sine curves. As it is not that simple, we can assume that these two cycles interact in a nonlinear manner. The non-linearity means that 4-year Presidential election cycle reveals itself in the context of the phase of the bigger, 40-year cycle. The interaction of these two cycles is rather complicated and is similar to the relationship between human beings. Thus, in 20 years the stock market's response to the same events that form the base of the Dynamic Model is the opposite to the original one (to be precise, the astronomical events are mentioned here). But the response 40 years ago was the same.
The closest analogy that comes to my mind is the family relations. Imagine any family with parents, children and grandparents. They all represent different generations, each one with its own values. But - there is more tension between parents and kids than between grandparents and grand children. The same with the market: the market reaction now (grandchildren) is opposite to the reaction 20 years ago (parents) while it is typically similar to the reaction 40 years ago (good relations between kids and grandparents). This issue worth enough to be one more lyric introduction...
Here are some more math details (if you are not so interested in them, you may skip the italicized text; it does not affect the understanding of the main idea).
The following simplest math model may help you to explain the possible ways of interaction between 4 and 40-year cycles. The whole picture looks like this: there is an ideal 4-year Presidential election cycle presented by the ideal 4-year sine curve. We have assumed that the 40-year cycle interacts with the first cycle this way: every 20 years the 4-year sine curve is inversed; what has been good 20 years ago is bad now, and vice versa. I have reconstructed the data series to get this assumption as a true one and have calculated the spectrum for these reconstructed data:
Thus, we have got the main cycle of 3.6 years (which is confirmed by the spectrum results for the real DJI data - see above). Besides, there is one more cycle with a period of 4.5 years approximately (for the real DJI data, it is 5 years).
How to provide a similar analysis by means of Timing Solution
This is a "hot" theme. It is only the first stage of our research. So, we can give you just general recommendations. In any case, the right training interval might be the key element - because the analyzed financial instruments usually change their structure with the time. So, here are these recommendations:
Be careful while choosing the training interval for the Neural Net.
As an example, let us create the forecasting model based on fixed cycles for crude oil prices. The 20 years of price history are available, and we need to find the model that provides the best forecast for the year 2004.
The first thing you should do is to find the optimal training interval for the Neural Net. "Optimal" means the interval that is enough to find the major important factors. We do it through Back Testing module:
The model has been defined this way:
Here the program has calculated the Spectrum, extracted cycles and then created the Neural Net forecasting model using different amounts of price bars. We worked with 500, 750, 1000 ... price bars.
The Back Testing shows that the best model for the year 2004 is based on 2,000 price bars (that corresponds to 8 years of price history data):
As it has been described in the documentation for the software, to get more reliable results it is necessary to shift the LBC and check these results on different intervals.
Another possible approach is the usage of the selected training features in the Neural Net module.
As an example, let us train the Neural Net using not all available price bars, but only those that belong to some special intervals. Here is the diagram from the documentation:
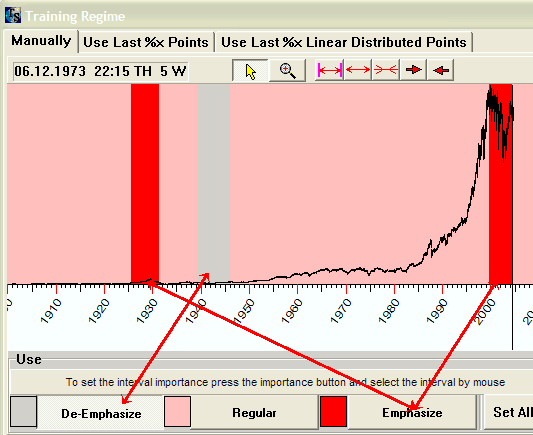
Looking at the past history, we inform the Neural Net in regards to some historical analogies. Thus, in the process of training the Neural Net, these selected intervals are emphasized, and the Neural Net works more attentively with the information from these intervals.
Generally speaking, the usual approach to cycles analysis is a linear one. After extracting the cycles, they are superposed mostly. But we believe that the relations between cycles are more complicated than that. As in the example above, the smaller cycles play the role of triggers (the 3.6 cycle or 4-year Presidential election cycle) while the bigger cycles show us how these triggers impact the analyzed process (40-year cycle for DJI). It is one of the direction of our research - to find the models that take into account the cycles interaction.
December 26, 2004
Toronto, Canada
� Timing Solution