Evolution of cyclical analysis in finance
Written by Sergey Tarassov
Introduction
In this article I want to explain the evolution of cyclical analysis applied for finance from my personal point of view. I started to develop software for the stock market in the mid of 1990 and at that moment I did not have any questions/doubts regarding cyclical analysis. I knew at that moment how to apply cyclical the analysis and what we may expect because I did this analysis in physical research. I thought that the only thing we need is to apply standard mathematical routines for stock market. Now after more that 20 years I have many questions and have doubts regarding this subject, though all these 20+ years I am working with this subject.
Take this as a good example of Socratic paradox: "I know one thing for sure; that I know nothing". Though ... something we know ...
Classical cyclical analysis
Harmonic/cyclical analysis this is one of the most beautiful, most developed and most demanded branches of mathematic. So in the mid of 1990 having mathematical background (Kolmogorov math school) and having experience how to apply math (Institute of nuclear research in Russia) I did not have any doubts. I know how...
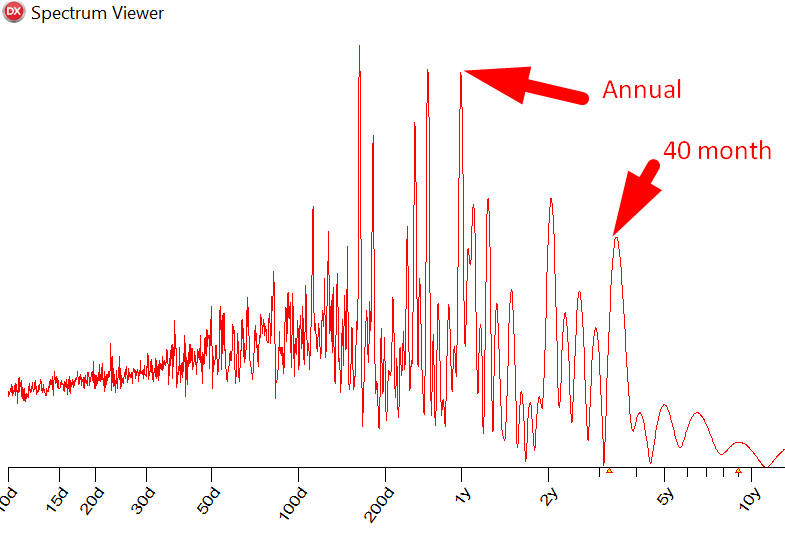
But my first attempt to conduct cyclical analysis using standard library (CERN's Roots library) for Dow disappointed me. It was kind of like a breath of Chaos, this is how it looks calculated with Timing Solution software:
A specialist looking at this chart will tell you that it looks like white noise, not 100% white because some tracks of cycles are present there like Annual and 40 month Kitchen economical cycle. But background noise is still too huge and makes it impossible to model Dow using cyclical model only.
To get some impression about the power of this background noise let's take two cycles Annual and 40 months cycles. The area under the peaks that correspond to these cycles corresponds the energy concentrated in these two cycles. I have marked this area by green color:
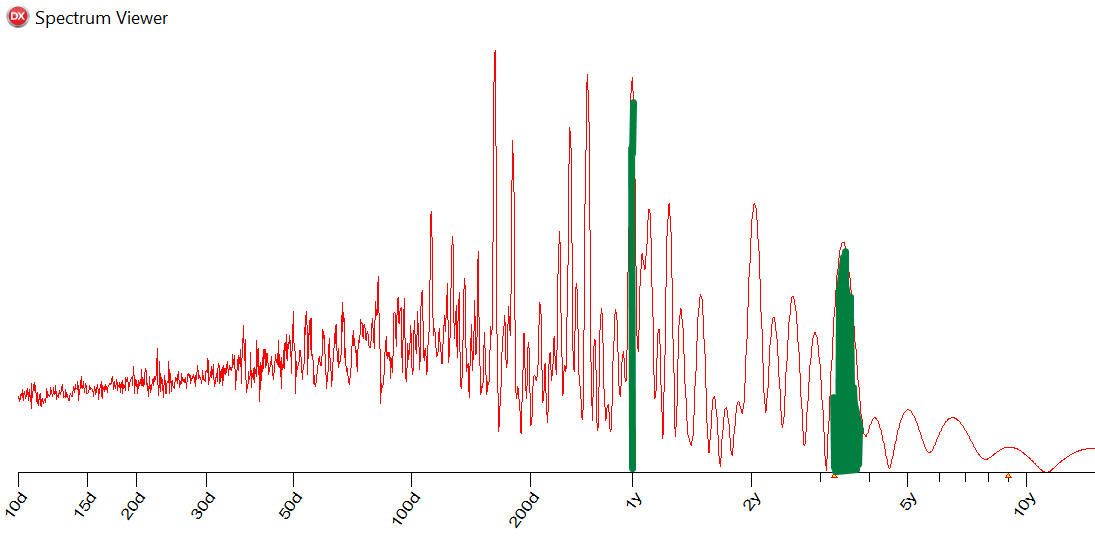
The rest of the area under this chart belongs to other players/factors. As you see this "cyclical green area" is very small when compared to the whole area.
This is why scientific community prefers to stay away from harmonic analysis applied for finance, they prefer to say that stock market is unpredictable demonstrating periodogram (like above) calculated with standard tools which is very chaotic. But the reality is much more interesting and less more certain. See below...
Dominant/Temporary/Dynamic cycles
In the beginning of 1990 two new cyclical techniques started to apply in finance: digital signal processing (books by John F. Edlers) and a more modern wavelet analysis. Both these techniques do not try to find the cycles that work forever, instead they assume that cycles live some finite period only, they are born, they live and they die. Our main goal now is to reveal the newly born cycle as early as it is possible. And this is a major issue: when a cycle is just burn and is accordingly most suitable for trading it is not easy to reveal it, and vise versa when cycle is old enough and it is easy to reveal BUT this cycle is not good for trading, this cycle, it lost his energy already.
On the website http://www.timingsolution.com I've written many articles about wavelets, you can read them there.
Classical cyclical analysis - in the trap of irresistible temptation
For almost twenty years all the techniques I have developed for cyclical analysis are based on ideas explained above. Timing Solution reveals cycles very fast, a cycles hunter module calculates wavelet diagram even in real time http://timingsolution.com/TI/7/index.htm . It was developed a special module to conduct backtesting for cyclical models: http://timingsolution.com/TI/5/index.htm It works fantastically fast.
But I always felt constricted in the circle of classical cyclical analysis, it is like being in the a closed room without fresh air. This room is beautiful but for trading we need something else. Classical cyclical analysis works in terms of Fourier transform, correlation coefficient etc. while for trading we need profit factor, win/loss ratio, drawdown etc. These are two totally different Universes: beautiful Universe of cyclical analysis and not so beautiful sometimes painful Universe of trading. It is not easy to find the bridge between these Universes, believe me.
First step - Q Spectrum
The first bridge between cyclical and financial Universes has been found in the beginning of 2016 year - this is Q spectrum module: http://www.timingsolution.com/TS/Articles/anti_information/
In classical cyclical analysis when we estimate the strength of cycle we mean the amplitude of this cycle or energy concentrated in this cycle (PSD - power spectral density). This is good if we deal with physical data - the more amplitude or power the stronger the cycle is. For trading we need something different - we want to trade this cycle, we can not trade power density, we can not trade correlation, we can not trade amplitude.
In Q-Spectrum module we still use correlation, but to estimate the the cycle performance we use Walk Forward Analysis (WFA) criteria. We do not care about the cycle's amplitude or power density we are focused on forecast ability of this cycle.
Briefly the idea of WFA can be explained in this way: we make a difference between curve fitting (i.e. how good a model worked in the past) and forecast (how good a model works in unknown future). We can spend a lot of time finding the model that practically ideally works ion the data from the past bu when we decide to put our money in this model - the model turned out to be unreliable and has lost you your money. What happened here? Nothing new, welcome to the financial World! When you build a practically ideal forecast model you did curve fitting, it does not mean that this model will work good in the future. To get an idea how your model really works you need to leave some untouched price history, price history that you don't use for curve fitting and then you try your model on this unknown price history. So Q-Spectrum module shows how cycle works on this unknown price history and this fact totally changes the picture.
Classical cyclical analysis does curve fitting, this is what it was developed for - find track of cycles in data. In the meantime, Q-Spectrum is more concentrated on how well the cycle forecasts the future.
There is a important feature of Q Spectrum: it sheds light upon inverted cycles, it allows to analyze them. I faced inverted cycles many times before and have always ignored them, all 20 years. From the point of view of classical cyclical analysis inverted cycles this are nonsense: cycle can not deliver negative energy or negative information. Applying financial criteria we legalize inverted cycles, because a cycle can help to make money and also can help to loose money. Both values are possible here: profit maybe positive (win) or negative (lost).
For twenty years I fill myself as hostage of beauty of classical harmonic analysis until one day I've figured out how to build the bridge between cyclical analysis and finance Universe. In few days the update with this new Q Spectrum module was available for users and now in one year I see this is one of the most used modules in Timing solution software. It took a long time to create this idea but after that everything goes very fast.
Trading Spectrum - Paleolithic simplicity
Now let's pretend to forget about cyclical analysis at all, pretend that we do not know about Fourier transform, correlations etc. The only mathematics we know is how to calculate our profit (and loss); all other things we do not know and do not want to know. How to make the cyclical analysis understandable for such a person?
Let's consider a 12-day cycle. It starts on the 1st day and goes for 12 days.
After that the cycle repeats and would be counted like this:
1-2-3-4-5-6-7-8-9-10-11-12-1-2-3-4-5-6-7-8-9-10-11-12..., etc.
Let's call this procedure "cyclical counting": for each day we have its own cyclical number that varies in 1-12 diapason for 12-days cycle. The 1st cyclical day is the beginning of this cycle, the 6th cyclical day is a half of this cycles, and the 12th cyclical day is the end of this cycle. This is the same as phases in classical cyclical analysis; 1st day = 0 degrees, 6th day = 180 degrees, 12th day = 360 degrees.
Now in trading the strategy based on cycles can look this way (not a
trading advice, just an example): "we can recommend to trade a 57-trading day
(TD) cycle , where stocks are bought on the 10th day of the cycle and
sold on the 36th day".
Without any other knowledge of the stock market we are simply expecting that the stock will rise in the period between the 10th and 36th day of the cycle, hence we should buy on the 10th and sell on the 36th. Zones like this (between 10th and 36th days) we call "predictable zones" when we expect some certain price movement.
So for trading we need to know two things: 1) the period of a tradable cycle and 2) predictable zone/zones for that cycle.
"Digital fortress" - in the trap of Paleolithic simplicity
It is easy to work with classical spectrum, this is a well-known territory. The first periodogram has been calculated in 1898 by Arthur Schuster, and since that a periodogram is a part of a very sophisticated and very developed branch of mathematics. It is a part of the University course for those who will apply spectral analysis to their research. This is what we know...
Developing from scratch a spectrum based on trading criteria is a totally different story, this is a kind of Terra Incognita as it is. There are many pitfalls there, and it needs time to recognize them and to find a proper solution. Here are some of them:
1) The main problem here is the speed of calculations. For example, to calculate the classical or Q-spectrum with doubled accuracy, the time of calculation will be doubled as well. For this new spectrum, the time of calculation will increase 8 times (=2x2x2). For tripled accuracy: classical spectrum calculates 3 times slower, new spectrum 27 (=3x3x3) times slower.
2) Another problem is a drawdown, and so far I am not sure yet how to handle this situation. The problem is: analyzing predictable zones, i.e. intervals suitable for trading, we often get trading strategies like this:
The price here between points A and B goes UP, i.e. this is uptrend strategy. But the drawdown is very big here. To get 5% profit, we experience 7% drawdown:
i.e. this strategy looks very risky. You can restrict this drawdown here:
Here drawdown does not exceed 100% of profit. This is actually the same as a risk profit ratio. If you set low value of drawdown (for example, 20%), probably the program will not find this strategy. Settings bigger drawdown (like 50% or 100%), we have more strategies though we have the higher risk as well.
September 9, 2017
Toronto, Canada