Variety of data
written by Sergey Tarasov October 22, 2016
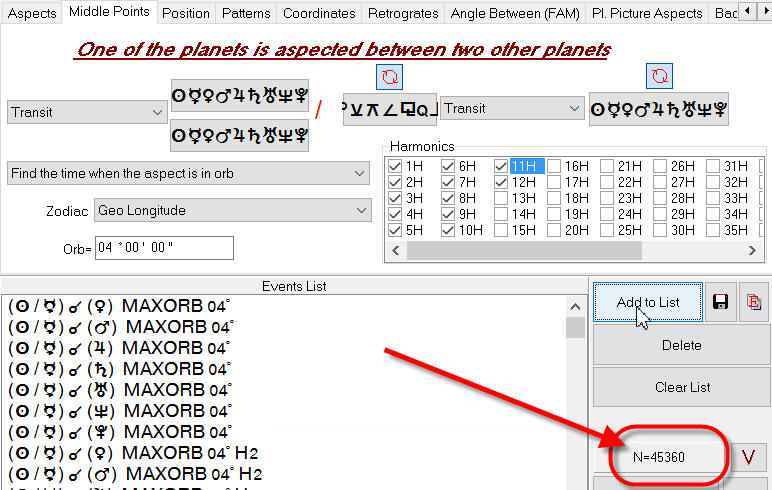
Example #1: a user is trying to make a forecast based on huge amount of midpoints. Technically Timing Solution allows you to create a list of midpoints aspects, like this list of 45K different midpoint aspects:
And then you can build a projection line based on these aspects and verify it. You can make more complicated models based on more complex figures like
Sun+Moon+Mercury=Venus
Timing Solution allows easily to create a list of 131K planetary pictures and make a projection line based on them:
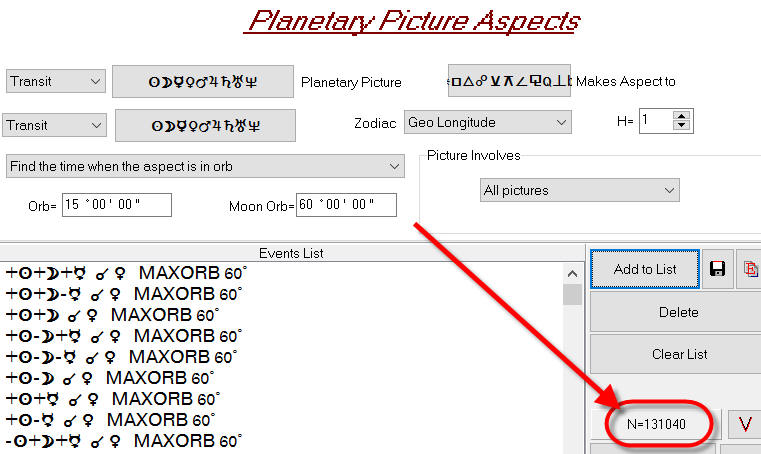
It is an irresistible temptation to make a forecast based on these events. Just think that - maybe! - a billionaire stock market secret is hidden in these simple mathematical expressions for planetary positions!
Example #2: with Timing Solution you can easily build a projection line based on any astronomical cycle. As an example, look at the projection line based on Venus heliocentric cycle; here it is:
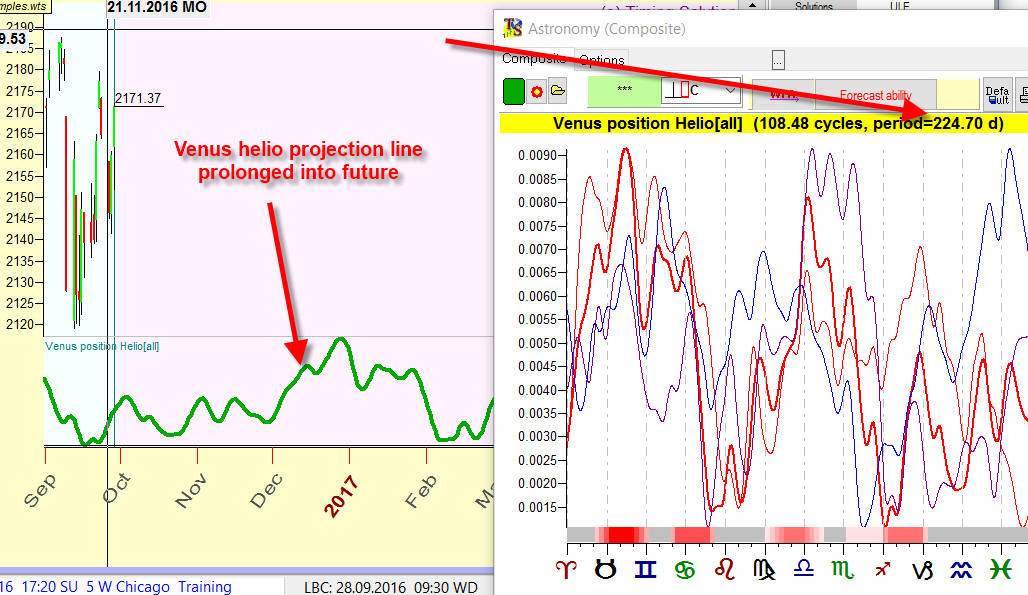
As you see, the average period of this cycle is 224.7 days. And we can also apply different harmonics, like 2H harmonic to analyze half of this cycle:
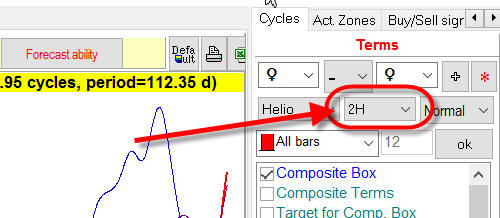
The period of this cycle is 112.35 days, and it provides another projection line. Maybe, the stock market secret is hidden in these harmonics? You can create a lot of them: 3H, 4H, etc...
My answer is: "My friends, there is nothing new under the Moon. I tried this approach, many other people tried to do that too before me, and I amd sure, many will try it after me. This way leads to nowhere, and I can explain why".
The root cause here is VARIETY OF DATA. Not the amount of events used for the analysis, but their quality, variety. You should understand that well after reading this article. Using the language of mathematics, we can spell it as DEGREES OF FREEDOM. What is that? Let's look in Wikipedia; here is what it says:
"In many scientific fields, the degrees of freedom of a system is the number of parameters of the system that may vary independently. For example, a point in the plane has two degrees of freedom for translation: its two coordinates; a non-infinitesimal object on the plane might have additional degrees of freedoms related to its orientation."
In the mid of 90s I had a chance to figure out what the variety of data is and how important it is. Some guys tried to trade using some technical analysis software; that software applied hundreds (as I remember, 400) of technical analysis indicators; it claimed that the software can find the best strategy for any financial instrument (like moving averages crossover, RSI breakouts ..., it had a lot of strategies based on different technical analysis indicators). These guys asked me as a mathematician why that so promising system did not provide good results.
Checking suggested strategies, I came to the conclusion that, in spite of advertising (which stated that the sustem is able to apply 400 or so strategies), this system in realily used not that many truly different strategies. From some moment these strategies became very similar, while we would expect more variety. The problem with this approach is: all these 400 indicators were built from the same material, from the same bricks: OHLC (open, high, low, close), maybe with addition of volume and/or open interest. All these strategies were built using these six bricks only, tossing them in a different way. Variety, the degree of freedom here is six or less. We are restricted by this variety, that is why from some moment our strategies look similar.
I would say, the more promising example would be this: a software (a hypothetical one) analyses 400 different, independent fundamental indicators (not technical analysis indicators), like weather, temperature, different sentiment indexes, etc. - and finds the indicator that forecasts your financial instrument the best way. In this situation, we would have much more variety and, accordingly, we might expect more promising results.
BTW, ten years I have found Robert Colby's book on technical analysis indicators. The restriction of this approach is explained there quite well.
Let's go back to our astro models. When you build a projection line that is based on 52K midpoints aspects, you are in the same trap. All these midpoint aspects are constructed from the positions of ten planets. The variety/degree of freedom here is 10, not 52K. These ten planets provide a great variety of projection lines if you consider their aspects, dynamics, speed, etc. models. And the variety of what we use here is restricted, so from some moment we will find these models as similar ones. We are here like in the box with ten degrees of freedom; to leave this box, we have to find something new and fresh that is built from another material.
Regarding harmonics, this is the same story. We are tossing the one and the same cycle. I've prepared a special example to explain how it works. I have downloaded SNP500 since 1960 and have added 5H Sun cycle to this data. In other words, in this data 73.053 days cycle is definitely present. Let's conduct walk forward analysis for 5H Sun cycle; it shows that - Yes, this cycle works. But let's conduct walk forward analysis (WFA) for the whole Sun cycle; and WFA shows that this cycle works as well. Here are results of both WFAs:
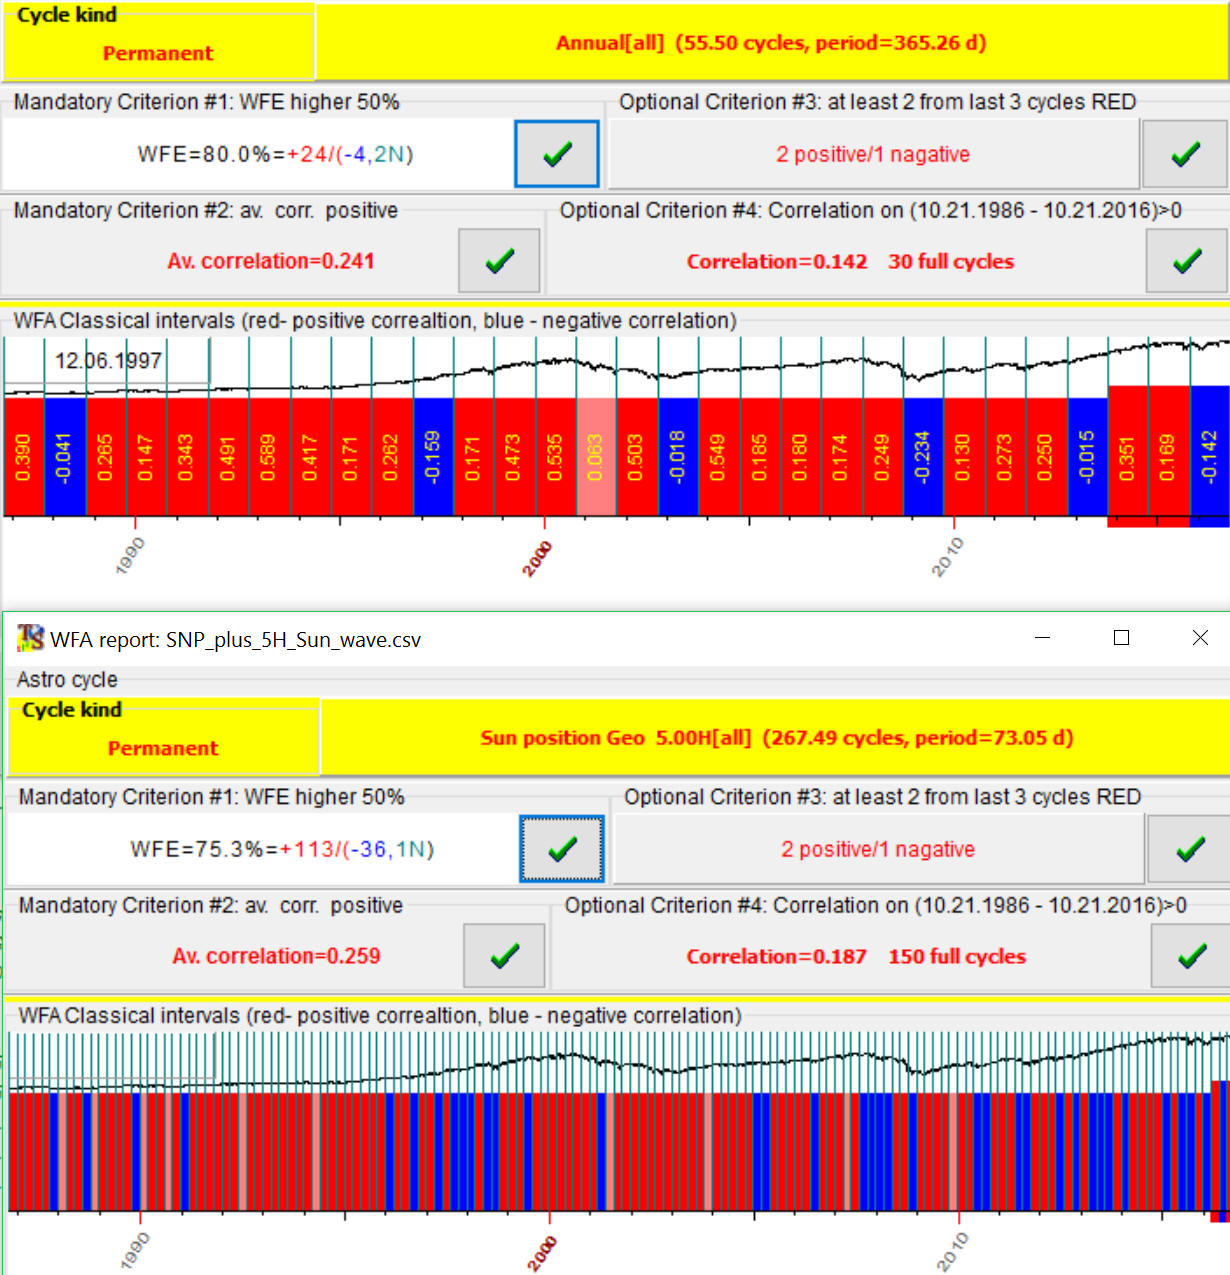
You see, walk forward efficiency for whole Annual cycle is 80% while for 5H Sun cycle 75%. The price history (SNP500+ 5H Sun cycle) is here: SNP_plus_5H_Sun_wave.zip
Mathematically it means that if 1/5 Annual cycles works, then the full Annual cycle works as well. It works this way if we analyze integer harmonics like 2H, 3H, 4H, 5H etc. For fractional harmonics like 5.23H Sun (1/5.23 of Annual cycle) this approach does not work; fractional harmonics are provided by other cycles.
Answers to users questions (October 24, 2016)
1) Does it mean that to build astro based we need to use 10 inputs events in Neural Net module?
Of course not, the amount of inputs in NN can be much, much more. As an example, let's consider one degree of freedom - the Sun position. To cover this one dimension, we may create FAM events like these:
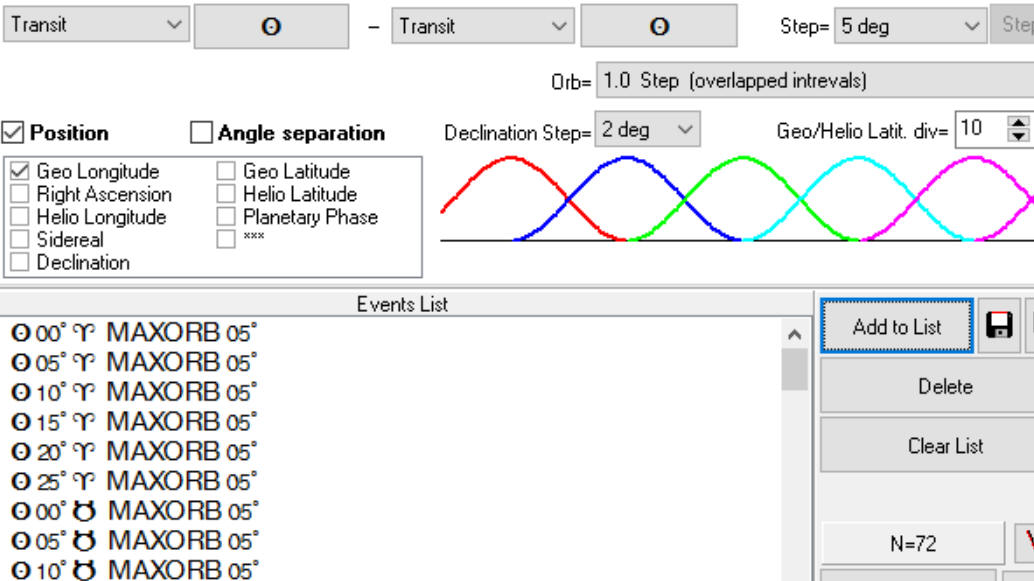
Here we used orb=5 degrees, i.e. we analyze events such as the Sun in 0 degree of Aries, 5 Aries, 10 Aries .... In total, it is 72 events for the Sun position. We can increase the orb => get less inputs and less accuracy; or decrease the orb => get more inputs.
Therefore, to cover planetary positions for all 10 planets with the accuracy=5 degrees, we get 10 x 72=720 events.
If we want to add the angle separation between those planets, we get 3960 events:
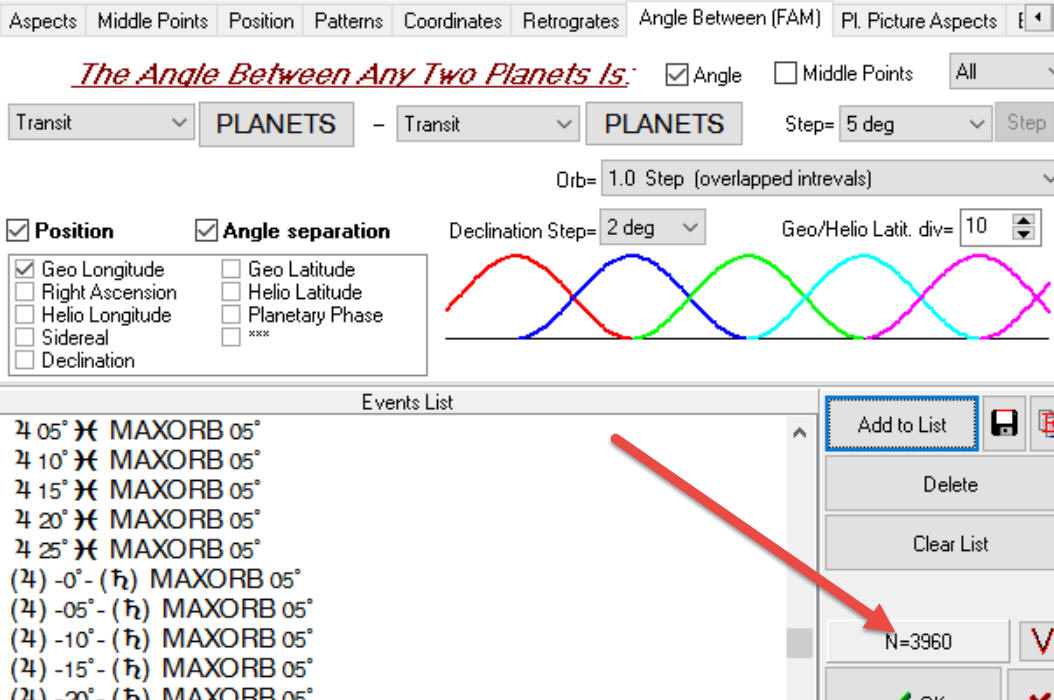
Here again we may vary this amount by changing the orb.
We still work with the same 10 degrees of freedom, 10 planets, though the number of inputs for our NN may differ significantly.
The important thing here is to find a proper balance. Having too many inputs, we open the gate for Chaos. And having just a few events, we may miss some important information.
2)
My point is a bit different. The main point of this article is: we cannot increase the amount of inputs forever, as it does not increase the accuracy of our calculation. Moreover, increasing the amount of inputs we increase the role of random factors, i.e. the forecast ability after LBC will decrease.
I will show one example. I've downloaded SNP500 since 1950 and have create two models based on aspects of midpoints:
The red projection line is aspects for 1H and 2H harmonics, totally it is 2500 events:
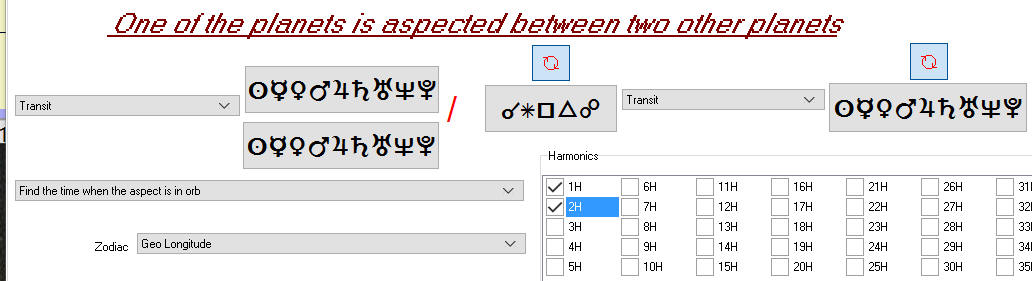
The blue line is aspects of 1H..8H harmonics, totally 10000 events:
You see, these projection lines look similar:
Here are the similar projection lines based on planetary pictures:
The main factor in your example is the amount of downloaded price history. The results that you get depend more on the amount of the price history used for NN learning than on the amount of inputs.