Timing Solution and
DayTrading
by Yuri Shramenko
My next area of research will be for daytrading - this precipitated by futures contracts like EurFX, Crude Oil, and the Russell 2000 Stock Index routinely having daily ranges greater then $1,000 a day per one contract. This while daily charts show sideways trading ranges with choppy volatility. Times change, and while for decades it was routine for a good swing-trader to make more then a good day-trader, I believe the globalization of our markets has effected a long-term change - daytrading now offers more reward to those who can time the markets.
Towards this end I've been eyeing a new software research product titled Timing Solution, designed and programmed by Sergey Tarassov (www.TimingSolution.com). In this brief I'll describe a preliminary structured setup that looks promising, developed with this software. I encourage those who are proactive in their market research to take a look at the Timing Solution (TS) web-site. For my current TechEdge clientele reading this you'll get a feel for what its store for us.
Those familiar with my work know that most of my trading efforts are directed towards knowing when not to trade - the derogative element in trading is market noise. Every trade setup I've used or recommended has at its base some method by which market noise is mitigated. Market noise is defined as choppy volatility which triggers false trading signals. In forecast research it has the effect of erroneously assigning a directional bias where none actually exists.
In beginning my intraday forecasting research with TS the first step is data-preparation. In the below examples I decided on a combination of 15-minute and 5-minute data. I'll be showing one day of the Russell 2000 Index, whose futures contract I trade daily. In forecast research using "raw" data is unwise as the "noise levels" are prohibitive - some means must be found to both detrend and smooth data. Of the two, smoothing is far more important to me. Why? Because my primary interest is in trading the largest swings of the day, not in predicting the little zig-zags that make up the trading day. The below example will clarify this.
The first step in reducing market noise, or smoothing as I call it, starts with deciding how you'll present each row of intraday data. In the below image the black line connects the closing price of each 15-minute price-bar. The purple line connects the median price, defined as (High + Low + Close) / 3. By looking at the below image we see that both lines clearly show the price movement for the day. But the median price without a doubt reduces the market noise, or choppy volatility. How this is relevant is shown in the example.
In trying to determine what cycles are present in a price series or what criteria effects price movement it would be good to repeat again that we don't use the price-bar data itself due to excessive market noise. What I've settled on is using a Relative Price Oscillator (basically a no-lag formula using three moving average). Below the red-line is a Relative Price Oscillator (RPO) that uses the Median price and values of 3 and 30, the blue line is a RPO using the Closing price and values of 1 and 10. (for TS users, both are Symmetric) As my goal is to forecast the largest swings of the day, and nothing but that, I can immediately see that the Median RPO captures the swings with none of the noise! Its a milestone checkpoint to be able to pre-process non-linear data like this.
My assumption is that it is unlikely that I will be able to develop one forecast that guides me thru the trading day, day after day, with consistent success. To increase my odds of success with forecasting I'll be creating two very different non-correlated price-movement forecasts and also a model that predicts support and resistance levels for the next day. For the first forecast, a physical fixed-length cycles forecast, and the support and resistance model, I used 5-minute data. For the second forecast, astronomical cycle based, I used 15-minute data.
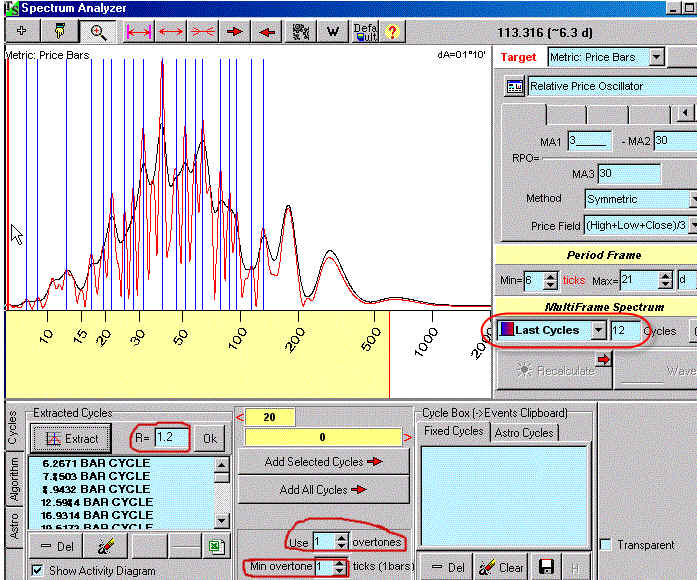
For the physical fixed-length cycles forecast I'll be delivering my Median RPO to TS's Spectrum Analyzer. This is an evolved form of John Ehlers popular MESA (Maximum Entropic Spectral Analysis) cycle extraction process. It finds cycles in relatively short price series. Below we see the cycles it found in the RPO I fed it. Each blue vertical line is an identified fixed length cycle. For TS users note I set the "R" value to 1.2 (from the default of 1) so as to not include small cycles - in the below diagram, the larger red waves are stronger cycles. Again for TS users note I set the Overtones ( they are like harmonics) to 1. I did this because I felt my pre-process smoothing of data was sufficient for building a cycles forecast. Now that I've identified the physical fixed-length cycles in this price series, I'll be passing them to TS's Neural Net to create a forecast.
While TS possesses a sophisticated Neural Net, I set its parameters to use it in its simplest possible form - in linear mode, where it will mainly just combine the cycles to produce the forecast. In creating this forecast I took care to just let the Spectrum and NN see data between March 1st and May 8th. This makes the below image a real forecast that could have been created prior to the start of the May 9th trading day. Looks pretty good but its not tradeable by itself. We'll see how to use it further down.
For the astronomical fixed-length cycles forecast I'll be using TS's Astronomy module. Again, I'm using the same Median RPO used above (but for 15-minute data) instead of raw price data. What is exciting about this module is the internal development of a new zodiac specialized for intraday data - its called the "mundane zodiac". It rescales planetary cycles by focusing on the Sun's movement - in our 24 hour day, the Sun moves 1 of its 360 degrees in 4 minutes. In the Mundane zodiac all the other planets are scaled proportional to the Mundane Sun.
Below is an image of the selection screen I used. For my approx. 12 weeks of data it assigned a preliminary forecast to each planetary cycle I selected. I then entered a processing screen (not shown) where all the planets forecasts were summed together. Here I was able to optimize this summed forecast on the most current 3 weeks of my RPO.

The resulting forecast is shown below. As in the previous fixed-length forecast only data up to May 8th was visible to the forecasting engine.
Now we have something of interest - two forecasts derived by very different means allow me to see if there is agreement as to the largest swings of the day. I'm minimizing the forecasted large swings being wrong by using two non-correlated forecasts. Indirectly I'm also looking to see where the forecasts predict small moves or moves in opposite directions, as I may choose to not trade those times. Though I have some valuable info here, its still not tradeable by itself. After years of forecasting research I know that the times predicted for large swings are approximations - I don't expect them to be "to the minute". For additional insight into the trading day I looked at TS's Turning-Point Analyzer.
Instead of using an RPO I'm applying a .3% zig-zag indicator. As you can see by looking at the parameters I'm looking to find price levels that correspond to retracement levels (a bottom). Some of these parameters are a bit complex to describe in this brief - more info is available in an article devoted to this module on the TS web-site (www.TimingSolution.com). The process applied is similar to the method know as Symmetry popularized by Robert Krausz in the 1990's, where the size of prior price swings are used to predict the end of the current price swing. The diagram window (in the below image) shows the areas of support this module found.
These areas of support are transferred to the main screen - see the blue margin on the right of the price chart - the areas I circled are where two or more support levels clustered together. As it worked out these were the actual levels where price found support that day. By using the forecasts I could anticipate price rising from the lowest area around 10:30. I could anticipate the forecasted downswing ending at one of those two zones - by 14:45 (2:45pm) you'd know it was the higher zone.

In actual use, TechEdge course owners know I'd be using SwingLines to actually enter and exit the market using the above tools. By knowing approximate times of large swings and support-resistance price levels, along with the other TechEdge day-trading tools we can much more easily avoid trading "chop-zones" while jumping on larger intraday trends - consistently!
This is preliminary research - over the next few months I've a few more TS setups I'll be investigating. The purpose of this article was to show that this research is warranted, and to present a means of integrating methods together to increase the probability of success.
Yuri Shramenko
yurips@verizon.net
www.TechEdgeTrading.com
