The Earth-Air Indicator
The Balance Between the Virtual And the
Real Economy
Recently, while thinking upon what is happening to markets now, I have tried a very simple and interesting idea. It came to me some time ago, and there was no time to consider it properly. Now I have returned to it. Let me introduce Earth/Air indicator. It is calculated very easily: we consider how many planets are located in the Earth signs of Zodiac (Taurus, Virgo, and Capricorn) and how many planets are located in Air signs (Gemini, Libra and Aquarius) and subtract these values (Earth-Air).
Thus this indicator shows us the balance between the amount of planets in Earth and Air signs of Zodiac. The higher this indicator the more planets are located in Earth signs. When this indicator reaches bottom, we have more planets in Air signs:
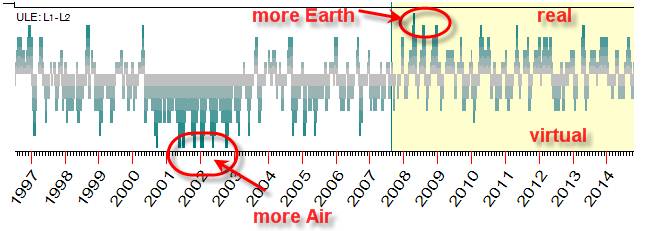
The index may be telling us that the economy tends to fail when the index is low, far away from earth signs. It makes sense: because air is so heavily tenanted by planets, people collectively begin having new ideas and concepts about the money and the economic system; the abundance of ideas not confirmed by practice leads to the weakness of the system as whole.
We state that when this indicator is low (many planets in Air), important changes in US monetary policy have taken place as depicted below:
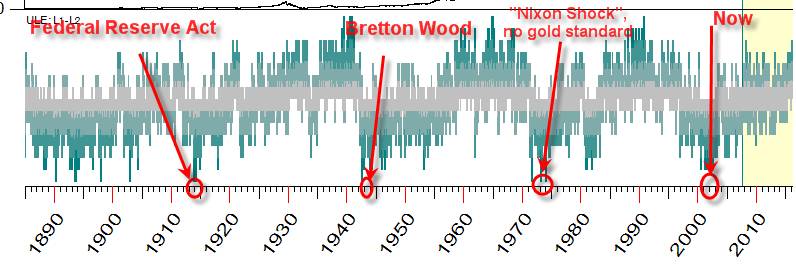
1913 – Fed Reserve Act, the initial point of modern financial system
1944 – Bretton Wood Agreement, the post WW2 financial system
1971 – Bretton Wood Agreement abandoned, US dollar no longer convertible into gold
Beginning of 2000,- Era of “creative” financing, derivatives growth, later financial crisis 2007 – 2008.
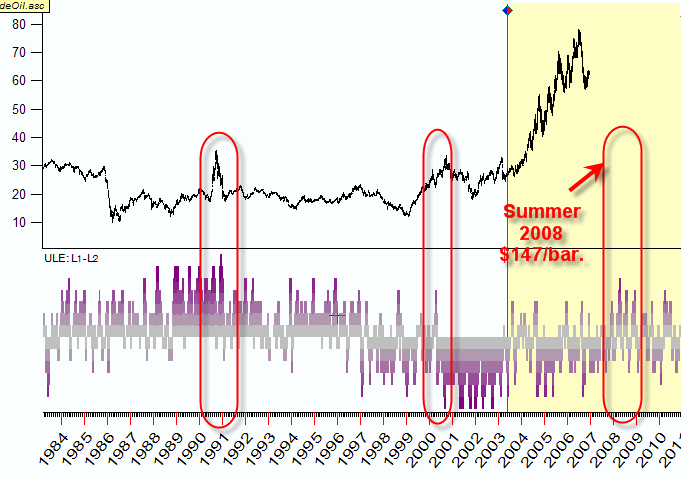
The current high value of this indicator shows more planets in Earth signs. This indicator began to grow in 2000, and higher commodity prices began as well. It appears that this period brings a shift to the real sector of the economy and some protectionism.
See below this indicator together with oil prices:
Here is the index versus the gold price:
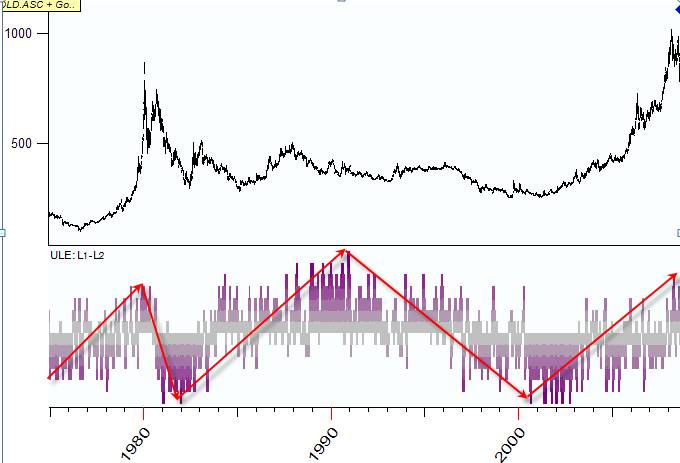
This is how this indicator looks for our near future:
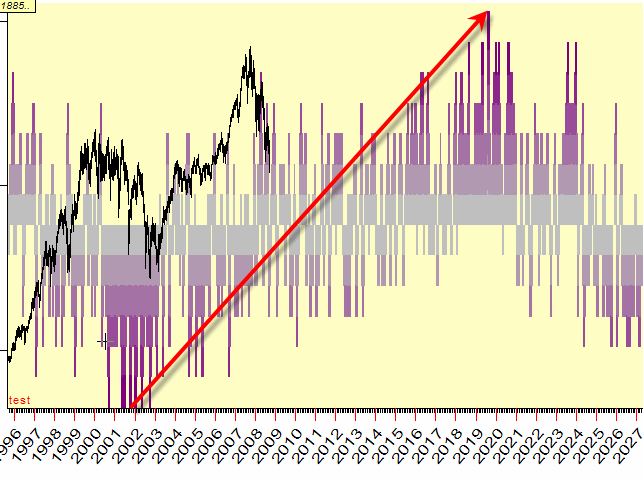
The indicator suggests that the next great shift in the economy will take place at the end of the next decade in 2019-2020. The changes will likely be of the magnitude of the prior turning points in the index. It also tells us that the trends that began at the index low early in the decade are not ending with the current crisis. The current ‘solutions’ to the crisis are unlikely to cure the illness, but only to put off a real solution to 2019-2020.
October 30, 2008
Sergey Tarasov (Toronto)
Bill Meridian (Vienna)