Astro based trading systems
Definition
What is an "astro based trading system"? This is a system where the trades are performed according to planetary positions and a specific angle between the trades. Exactly like a classical trading system which is based on the intersection of two moving averages (fast and slow), it is possible to construct a trading system where trading signals are triggered by astro phenomena. In this article I will not advertise any astro trading system, I will show you the tools to create them and discuss some issues that I believe are relevant.
Here are the examples of these trading systems:
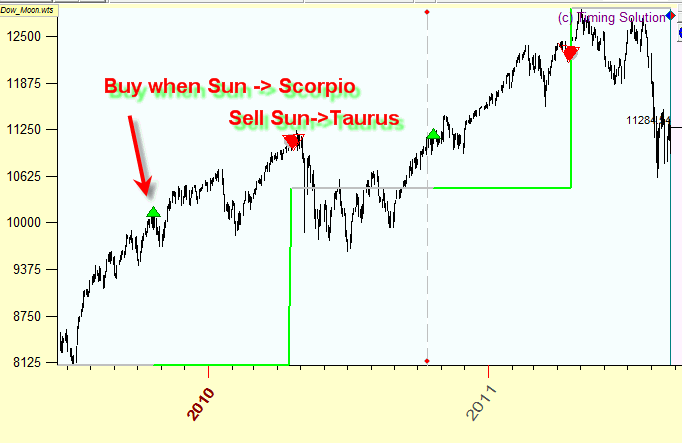
Example #1: once a year we buy the shares of some company X when the Sun ingresses Scorpio and sell them when the Sun ingresses Taurus. We expect that within this six month period (October 21- May 19) the price for these shares of the company X will rise; here money is made by taking a long trade. Do not forget, this is just an example; I want to show that it is possible to trade using astro phenomena as trading signals. This is how such a trading strategy looks:
Example #2: We may trade using the Moon phases. Researchers all over the world note that the Moon actually affects the stock market. Usually a typical research states that the price is higher around the New Moon and lower around the Full Moon. This is a practically ready trading system: buy when the price is low i.e. at the Full Moon and sell around the New Moon. This is how this strategy works within last six months:
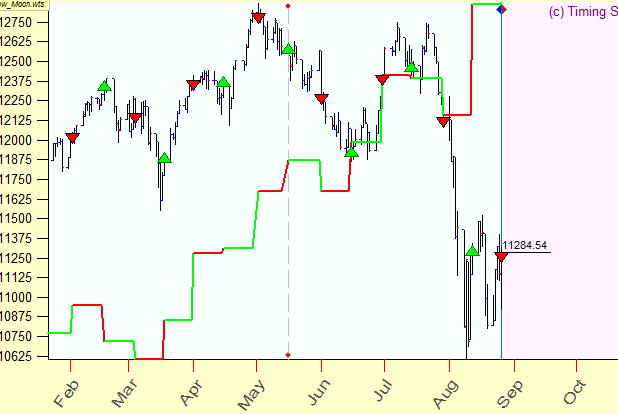
The equity curve looks very well. However I do not recommend to make any judgment based on 15 trades only.
Example #3: we may trade using Mars phases cycle (which is the angle between the Earth and Mars in heliocentric coordinates). Buy when this angle reaches 203 degrees and sell when this angle reaches 237 degrees.
This is the equity curve (lime line) for this system:
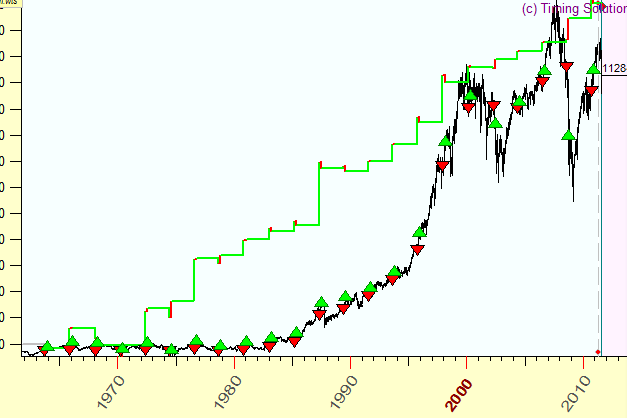
During 50 years this system made 27 win trades versus 18 loss, average Annual profit is 16%:
Why the angles 203 and 237 degrees, not some other values? These values were received by a specially developed module that allows to reveal "the most profitable" planetary angles.
The examples above are just a small portion; there are a lot of other astro phenomena. So, here the question appears: can we really use this kind of systems for trading? Astro phenomena may serve as signals that provide a valuable information for the trader. I do not think that such a system can be used as a fully automatically trading system, at least I do not believe that this is possible for a daily price history data (if we speak in terms of real back testing). However the information provided by astro based signals is very compatible with technical analysis indicators, plus it gives another view on the stock market behavior.
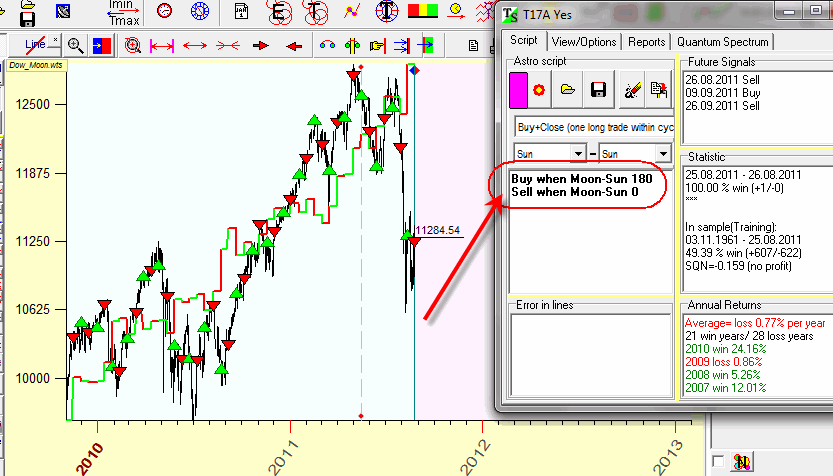
Creation of a such system became possible when the new module, T17, has been developed for Timing Solution software. This module allows fantastically fast and easy to verify this kind of a system. It means that we can take practically any astro statement regarding the stock market and make its quick evaluation. And you should do just a few mouse clicks, like in example #2 with the Moon phase trading system I simply type this:
Buy when
Moon-Sun 180and the program immediately has calculated these signals,. And you can see right away the signals, the corresponding equity curve as well as some statistical information:
Therefore, we have a tool. Now a research and discussion is needed.
Annual trading system
We start our research with the simplest astro based model - Annual cycle for Dow Jones Industrial Index. (The main purpose of this article is an educational one, so you can apply the same approach and find a trading strategy for any financial instrument. There is one restriction though: you need to have enough price history to create this model, at least 20 years.)
Our research was conducted for the last 50 years of available DJII history. Mathematically the task is obvious - we calculate Annual cycle for Dow and consider tops and bottoms; here they are:
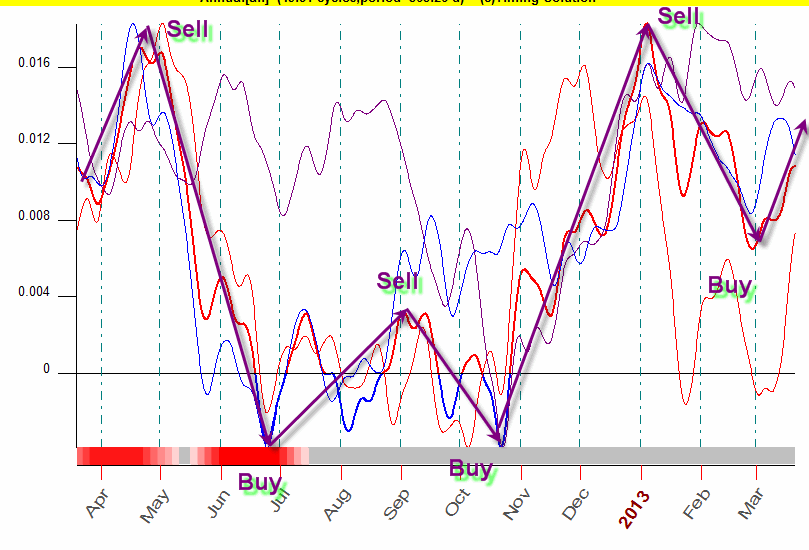
As you see this strategy based on the Annual cycle recommends six trades within a year: the beginning of March - buy, the end of April - sell, the end of June - buy, the beginning of September - sell, mid of October - buy and sell just before the New Year. This is full Annual trading cycle. I was almost ready to announce this trading strategy as a basic one when the more detailed analysis revealed some unexpected results.
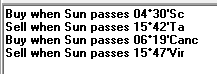
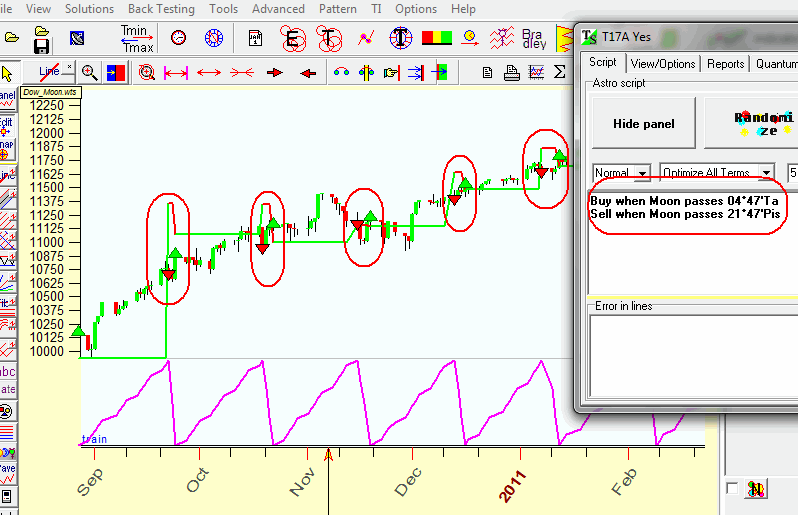
I have decided to put it through T17 module. That module (by the way, it is available under Terra Incognita project of Timing Solution) allows to find the best trading strategy. So, in regards to the Annual cycle, I was looking at strategies based on the Sun position. And look what I have got:
This is what we see if this trading strategy overlays the Annual chart:
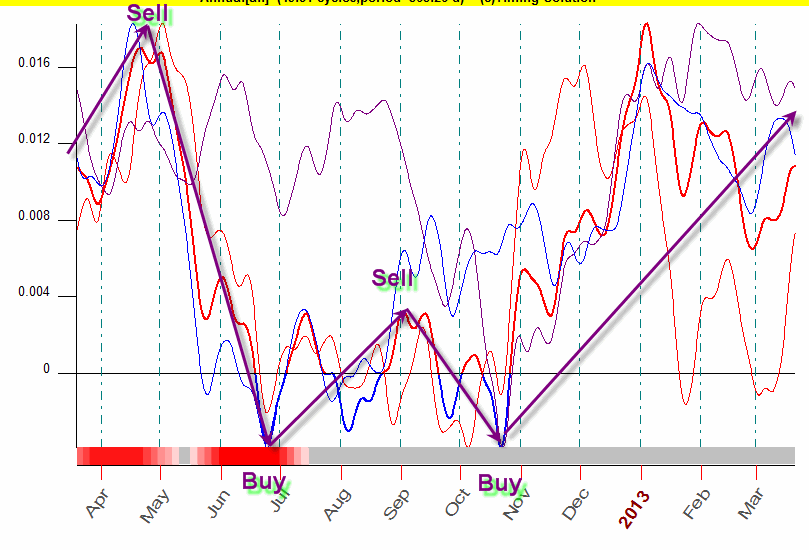
The interesting fact is: the program for some reason has skipped two trades: sell signal around the New Year and buy signal in the beginning of March. This information cannot be revealed by a projection line; I believe T17 module provides a deeper insight in astro cycles. It incorporates the risk information in regards to some specific planetary movement or astro phenomenon..
And then we can evaluate this trading system. Here is its equity curve:
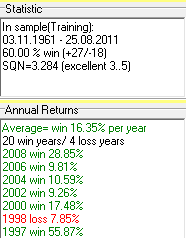
A little bit of statistics: if this system would be used for trading since 1961 till 2011, it could make 200 trades (four trades per year), and 68% trades were winning:
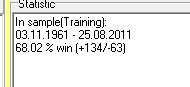
Look at these would-be Annual returns for this strategy (only 8 years of 50 were losses):
Average= win 12.12% per year
2010 win 10.99%
2009 win 7.26%
2008 win 30.67%
2007 win 0.86%
2006 win 16.96%
2005 win 10.99%
2004 win 9.74%
2003 win 3.46%
2002 win 2.91%
2001 win 0.81%
2000 win 15.59%
1999 win 44.72%
1998 win 15.34%
1997 win 23.72%
1996 win 5.44%
1995 win 10.10%
1994 win 8.04%
1993 win 7.12%
1992 win 15.48%
1991 win 23.81%
1990 loss 2.70%
1989 win 16.42%
1988 loss 0.61%
1987 win 55.02%
1986 win 29.79%
1985 loss 4.60%
1984 win 6.31%
1983 win 27.76%
1982 win 14.06%
1981 loss 8.24%
1980 win 0.52%
1979 win 16.79%
1978 win 24.97%
1977 win 0.59%
1976 win 20.03%
1975 win 23.02%
1974 loss 19.03%
1973 loss 0.21%
1972 win 17.57%
1971 win 45.63%
1970 win 2.58%
1969 loss 3.57%
1968 win 3.88%
1967 win 22.58%
1966 loss 21.68%
1965 win 16.70%
1964 win 7.15%
1963 win 27.17%
What I would like to say? It is possible to use astro phenomena and create a trading system based on them. With T17 module (which does a testing of strategies), you are able to fine-tune the signals generated by that system.
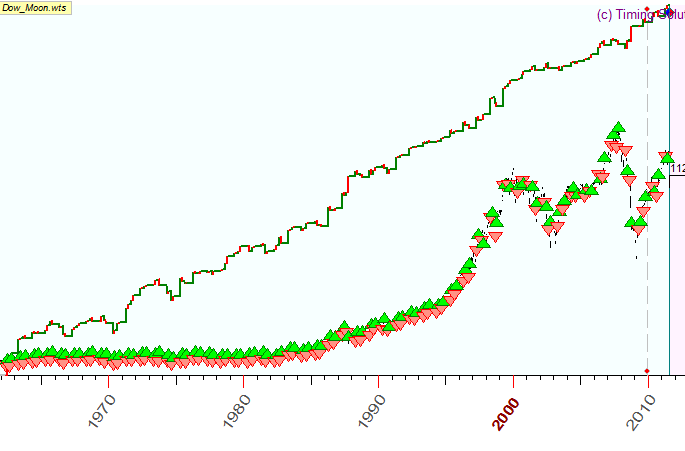
Lunar trading system (Moon Zodiacal position)
The situation with Lunar cycles is much more complicated. The central question here is to find a correct STRUCTURING cycle for the Moon cycle. What am I talking about? Consider this: a hundred years ago the Moon cycle worked differently than it does now, the same is true for 50 years ago - we had then a different stock market, with different mood/fears/hopes. But 5 years ago, i.e. in 2006 the Moon cycle worked pretty much the same as now. The question is how many years Moon-related behavior of the stock market keeps being the same - 5, 8, 10 or 20 years?
This is what I mean under "structuring cycle for the Lunar cycle". Let's find its period. We need a lot of price history for that; let's start with 50 years of price history. Download it and run the optimization procedure for the Moon cycle. This is what I got:
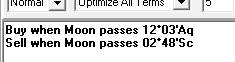
As you see, this system generates Buy signal when the Moon passes 4th degree of Taurus and Sell signal when the Moon passes 21st degree of Pisces. In other words, buy and sell signals are located very close, 2-3 days difference. Close located signals mean that this system does not work, this is practically a "buy-and-hold" system. It also means that within 50 years interval we cannot specify some stable Moon pattern, within 50 years this pattern has being changed. So now try to download less price history and perform the Moon cycle optimization once again. Download 40 years of price history, optimize signals and watch them. If these signals are close (i.e. the system does not work), download 30 years of price history and check this system again. I Have found that the system works when the last 15 years of price history are downloaded. Here is:
Buy when the Moon passes 12th degree of Aquarius and sell when the Moon passes 2nd degree of Scorpio. The angle separation between these signals is big enough. This system provides 56% winning trades (223 win versus 174 loss). This is how this model would work for the last year:
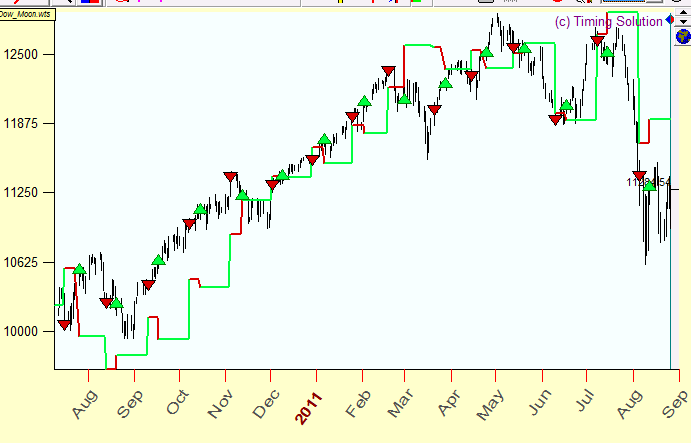
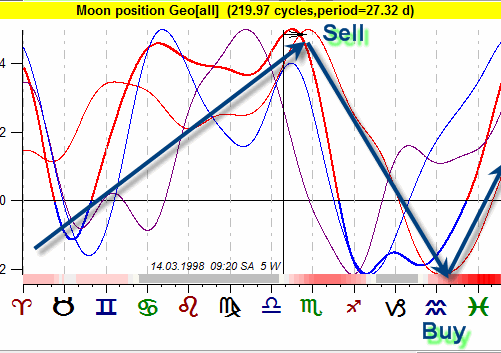
Here are these signals displayed together with the Moon in Zodiac composite diagram:
It looks like the period for structuring the Moon cycle in signs of Zodiac is 15-20 years. So you need to download 15-20 years of price history history to calculate the Moon based trading system. I have also got a good result downloading 8 years of price history.
Moon phase trading system
It seems to me that the Moon phase cycle works better than the Moon Zodiacal position cycle. It looks like the structuring cycle for the Moon phase cycle is about 30 years, though it works OK if you download 5, 10, 20 years of price history.
This is how this trading system looks:
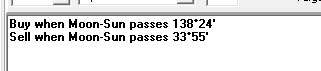
Buy when the angle between the Moon and the Sun reaches 138 degrees and sell when this angle reaches 33 degrees. We can formulate this trading system easier to memorize: buy three days before the Full Moon and sell three days after the New Moon.
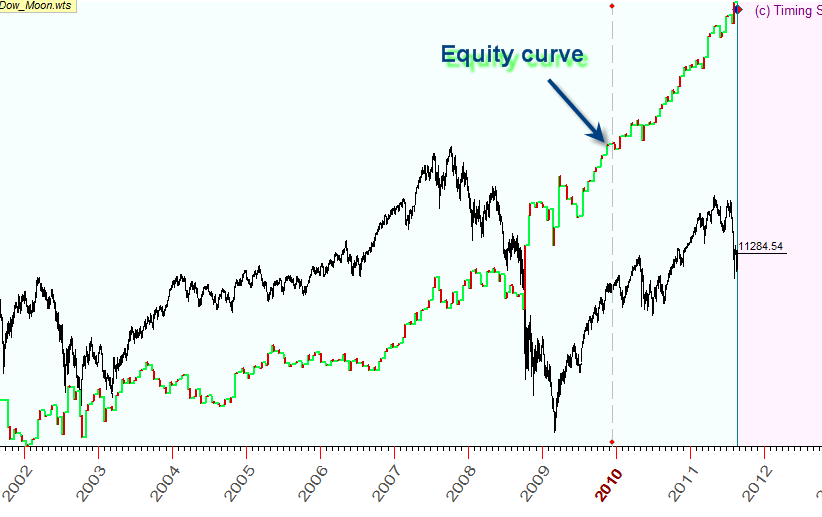
This system provides 59% win trades (145 win versus 100 loss), and this is the equity curve for this system:
Beware of "good" systems
In this article the general approach of astro based systems has been introduced. Do not take them as a ready-to-use trading system. I do not think that for daily data this is possible. For deeper analysis of this trading system we need to use back testing approach.
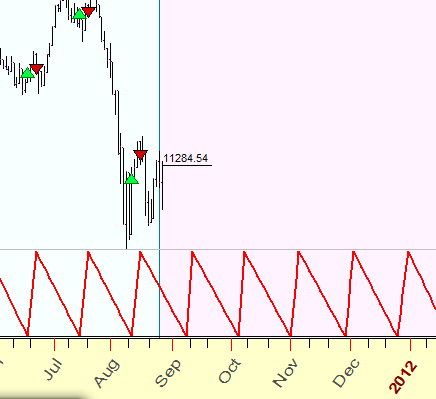
This system should be used together with some other techniques, like turbo cycles model. I recommend to use this model as a regular indicator, we call it "Astro zigzag" indicator. This is how it looks:
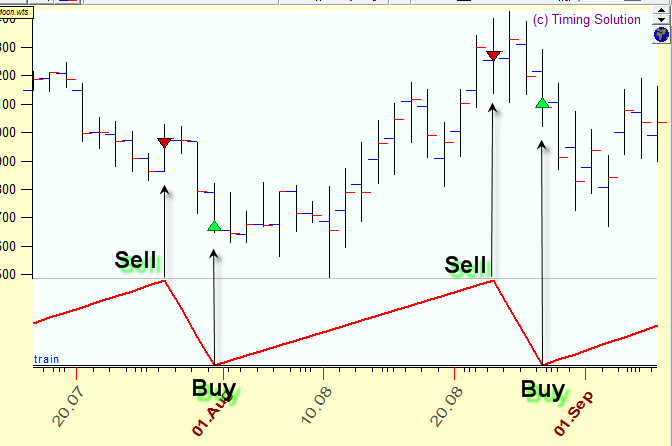
It looks like detrended zigzag, tops there correspond to sell astro signals, bottoms - to buy signals.
The advantage of this indicator - it can be prolonged into the future (this is just an example):
Sergey Tarassov
September 18, 2011
Toronto, Canada