The common sense is first ...
written by Sergey Tarassov
The greatest French scientist Louis Pasteur said once: "The more I know, the more nearly is my faith that of the Breton peasant. Could I but know all I would have the faith of a Breton peasant woman.".
In this article, I would like to discuss again math concepts and math techniques available in Timing Solution software. And I would like discuss them from some other point of view. Many different techniques and math methods are used in the software. Sometimes they are very complicated from a professional point of view while used to express very simple things. For a mathematician, it is normal. However, a regular user may see here some difficulties. One is the complexity of math methods and techniques applied in the software which demands a certain level of education. The user may feel some fear and confusion, especially when some time it is difficult to decide what is really important and what is not. From the other side, the ability of the software to deal with very complex math concepts gives a false sense of security. The user may assume that it does not matter what model is used - there is always some math trick that can help. My point is: take these math methods as your tools, no matter how complicated they are, and remember that behind any complicity some very simple things are hidden. Trust you common sense, do not be fascinated by complexity.
That is why I have started this article with the phrase by Louis Pasteur. The correlation between very complicated math technologies and our common sense is exactly the same as the comparison of the faith of the greatest scientist and the faith of a Breton peasant woman. They make look like polarities, but they meet, at the same point. Things the most important for humankind are very simple, though we may go to them by different ways; we simply have to learn to see these obvious things. This is not just some philosophy, this is my experience obtained while answering Timing Solution users questions regarding techniques available there.
When I say about your common sense, I mean a giant computer, the fastest and the most powerful computer in the world. It is in your head. A single human brain contains the information gathered during the process of human evolution, from the simplest live forms to the modern humankind. It covers several hundreds million years of data!!! As an example, when we define our orientation in the physical space, we rely on the experience received by ancient live forms. Our movements, emotions, thinking are not a product of simple Aristotle logic, their source is much more deeper.
Thus, creating a forecast, definitely we should be armed with the modern math. However, we should remember as well that the price can contain some hints invisible in the frames of the formal math. Simply we have not enough price history for that. Our Stone Age ancestors did not trade (at least, there are no records regarding that) and did not have stock exchanges, though we use nowadays their survival experience as well. Sometimes intuition and experience provide better hints.
So your first step when you evaluate any of your models should be a common sense filter; you browse your model attentively, you run the most powerful computer in the World - your brain.
If this model looks promising, you can apply more advanced math techniques; they can help you to approve or disapprove this model. This is the time for statistic techniques: it may be some correlation between the projection line and the price, it may be chi square statistical criterion to estimate aspects' effect in the Efficiency test module, or any other technique...
Both these steps are mandatory. If you apply the common sense only and have found a very good projection line that generates fantastical signals, the strict statistical criteria may say you that this is just an occasional coincidence. Without it, your wonderful picture may change drastically when you consider more price history data to estimate the performance of your projection line. Formal math criteria know well how his majesty Chaos can mimic the Universe.
Vise versa, if we apply formal stat criteria only ignoring common sense, we will meet that same Chaos though this Chaos uses now other gates to enter. The formal math criteria can easily confirm that the stock market volatility perfectly correlates to the amount of crows in the park.
I have started to develop financial software in 1995; I remember well what I did then. I thought then that the main problem was the ability to program different math techniques. I was so fascinated by different kinds of neural networks, genetic algorithms, fuzzy logic and other things... And I have found ways to incorporate them into my software!.. But - where are we now, in 2013? I figured out that math itself is not a knowledge yet, this is a tool, just a tool, and nothing else.
You should understand the models you use, at least you should try to do that. For example, if you analyze Annual cycle and consider Christmas rally pattern, simply watch how this pattern has worked earlier, in the years 2012, 2011, 2010, etc. So now developing financial software my main concern is to show/to visualize what is inside of the models that we use, how the projection line is formed, what forces lie behind any analyzed model. Take it this way: when you watch your market data, to understand how this model works apply first your common sense - the most powerful computer in the world. It is a base of your understanding. Do not overestimate the role of math; correctly applied math can improve some working model though it cannot make a working model from that one that does not work. Huge and sophisticated math apparatus is ready to serve you, it is programmed already or can easily be programmed to your convenience. This is not a big deal now. And this is not what we are looking for if our main goal is to forecast the stock market.
So my main recommendation is: always start with simple intuitive understandable models. Simply watch the price chart together with your model. This is the first and very important step. When you see that this model works, then you can apply more complicated math to obtain a confirmation to your hints. And again, do not forget your common sense...
Now I will illustrate my thoughts using the following examples. I will show you the typical steps in evaluating the models, the typical combination of common sense and formal math criteria.
Annual cycle
Step #1: common sense
For the first example consider the Annual cycle. Let's look at it together.
I have downloaded Dow Jones Industrial Index since 1950 and run Composite module to calculate the Annual cycle:
By default the program creates a projection line for Annual cycle. You will see it immediately on your screen. Now we need to understand how well this projection line works for different time periods. We do it by moving Learning Border Cursor LBC) to different positions and then watching at the projection line in regards to the price chart. (Learning Border Cursor divides our data set on two parts. Everything to the left of LBC is used to analyze the data and assign the parameters of the model (you do nothing here, it is all programmed already). Everything to the right of LBC is untouched, so we can use this portion of data to see the performance of the model.
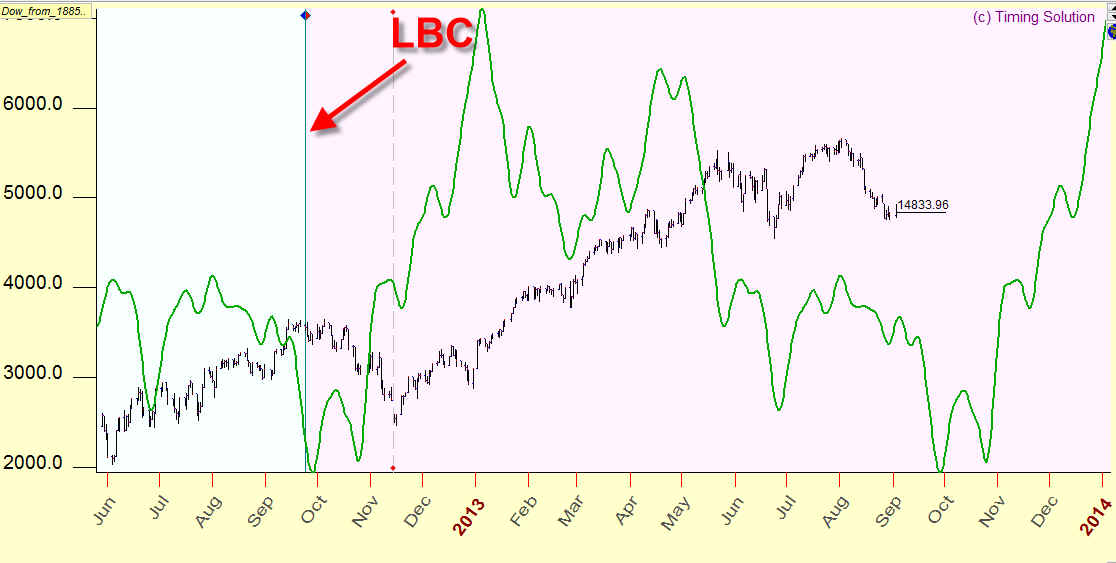
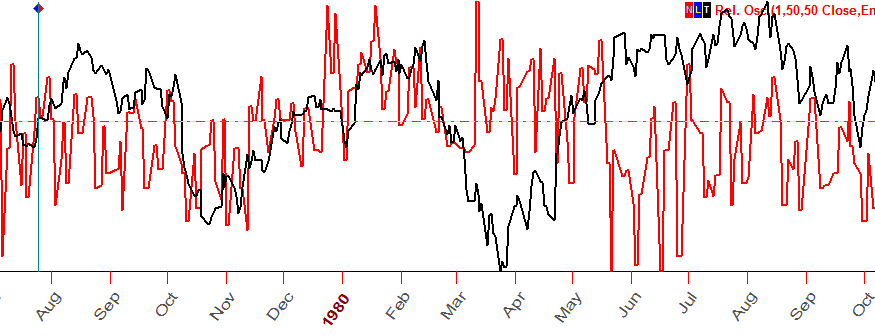
Let us set LBC to the end of September 2012; we will watch how this projection line works since the fall 2012 till now, the fall 2013. We will see the real forecast ability of this projection line.
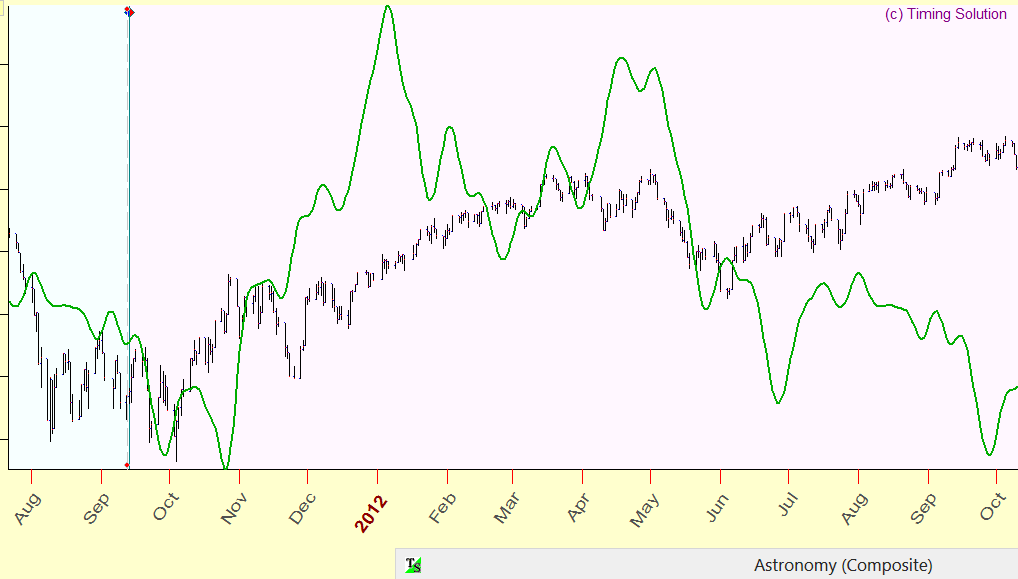
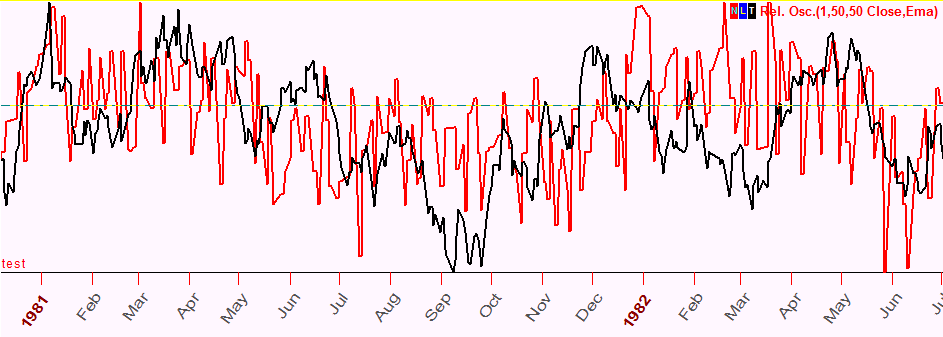
Now set LBC to September 2011 and watch how projection line worked in 2011-2012:
Do the same for years 2010-2011:
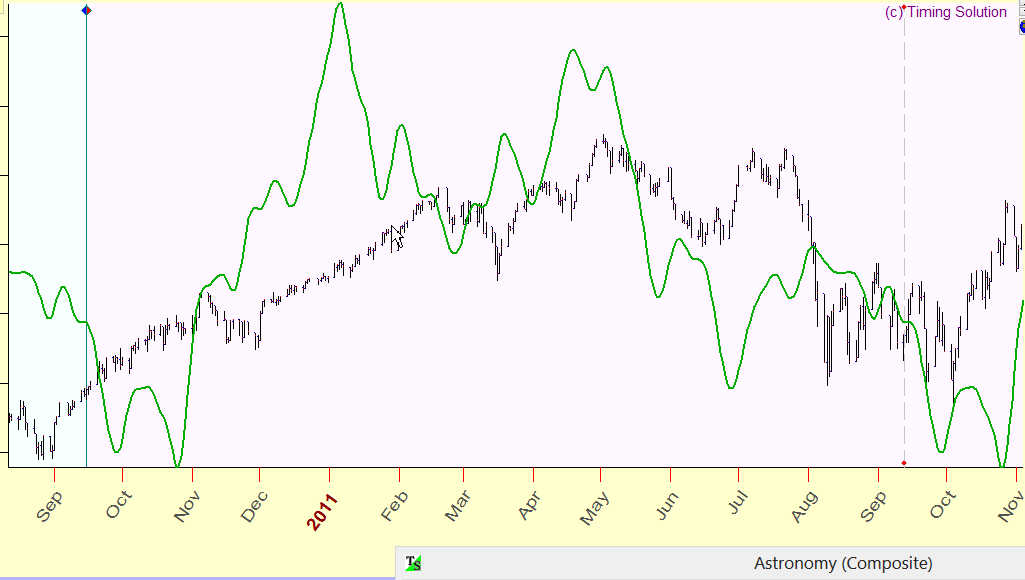
My first impression is that this projection line works, not ideally of course but works. Pay attention to Christmas rally pattern or bottom turning point in the beginning of June. Every year these patterns work differently, this is obvious, and we cannot avoid this fact. However, the track of some common behavior still persists. We have conducted informal analysis, and our common sense was the major instrument here.
Step #2: formal approach
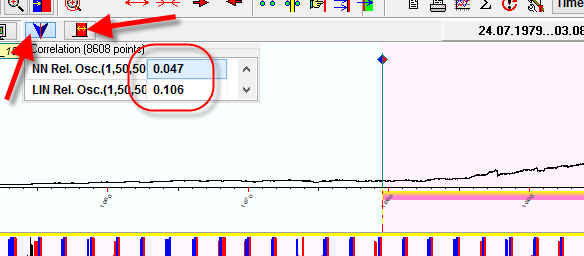
Now is the time for formal approach. Let's set LBC to the year 1980. We will watch now the correlation between the price and the projection line, since that year 1980 till now:
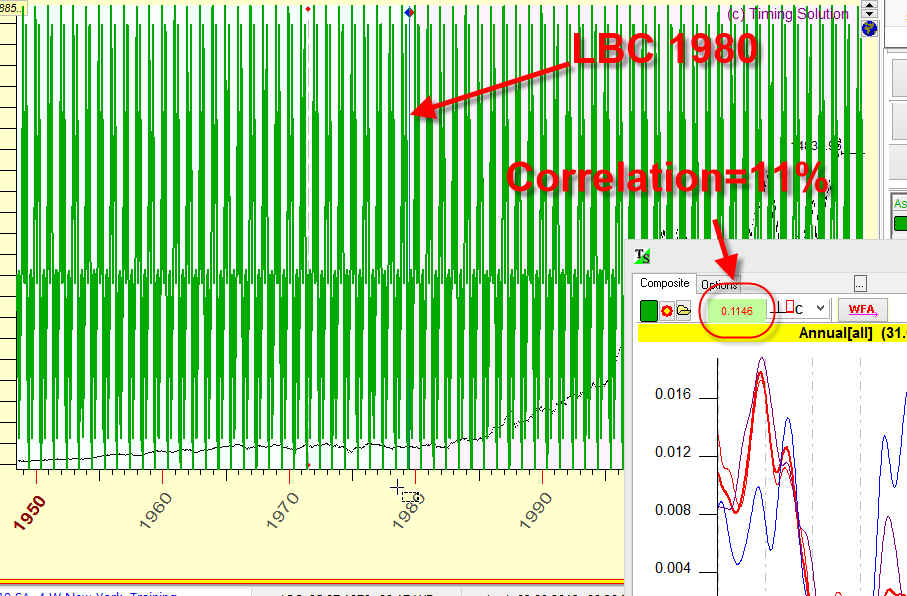
Here we can speak not about some Christmas rally or June turning point (these were tendencies), but we can add some figures. So for the last 33 years (since 1980) the projection line based on Annual cycle has produced 11% correlation (which is not bad at all). We apply here the formal statistical analysis because it is practically impossible to analyze 33 years visually.
Step #3: tuning
If we see and know that this model works, we can try to improve it, to do some tuning for it. Do not try to improve some not working model; before any tuning you must watch it and make sure that the model works. For better tuning I recommend to play with oscillator and smooth orb parameters:
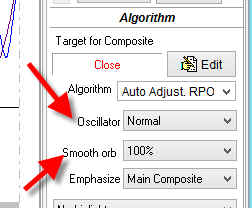
You can vary these parameters and watch how the correlation changes, what set of parameters provides the best correlation.
Double position model
What I have said above relates to data sets that you would like to analyze not having any particular model in mind. That is why I suggest to start with simple models and use your common sense first applying math techniques for fine tuning of working models. Sometimes the situation is different: you may have heard of some model that works well for some market. In this case it would be better to start with formal approach and then apply your common sense filter. The example below is about that. I will show you how to estimate some model. As an example, let us take a model proposed by one of Timing Solution users today (November 19, 2013). Initially I have had no idea whether this model works or not, so I have created Neural Network based on this model and then watched the model (is it alive or not).
Step #1: formal approach
For the last 30 years, Neural Network projection line based on this model provides a correlation of 5-10%:
It means that this model is alive and worth further research.
Step #2: common sense
Now we know that this model catches something in the stock marked movement; formal math criteria give us a positive verdict for this model. But the question is: is this model tradable or not? To answer that question, I simply zoom the piece of the price chart (black curve) together with the projection line (red curve). Here they are:
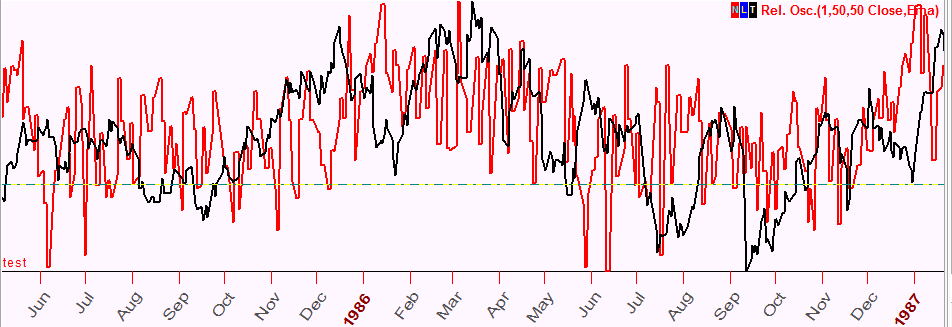
You see, this model provides a projection line that is too choppy; it would be difficult to trade using the model as it is now. It is what our common sense says to us. However, we can use this model as a initial point for further research though not as a trading tool.
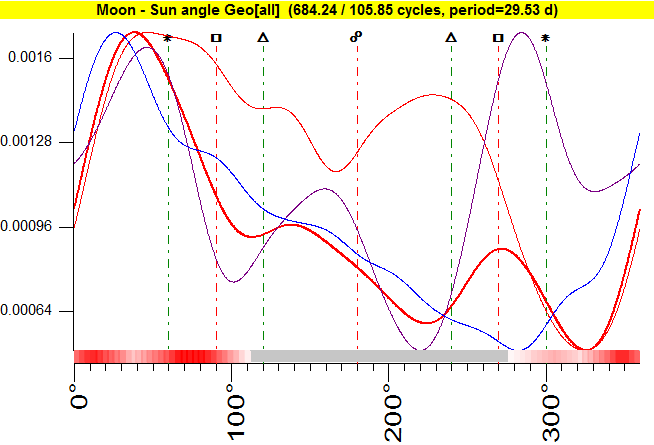
Moon synodic cycle - small piece of information
Statistical analysis shows that Moon phases cycle works, no doubts. The formal approach shows that S&P 5000 is higher around New Moon and lower around Full Moon.
The formal analysis verdict is positive, this is one of the most reliable cycle.
But - if we watch how this cycle works in time, we will be disappointed; the projection line based on this cycle does not look as good as its statistical confirmation. As a rule, users see some contradiction here; something must be wrong - either statistical analysis, or the projection lines. The trick is - there is no contradiction here. Moon phases cycle explains only some percents of the stock market movement; everything else (more than 90% of all movements) is moved by other forces.
And it does not mean that this cycle is useless. Simply keep this cycle in mind, remembering that some time this cycle can work (when and how long - it is another story). Do not over evaluate this cycle from one point of view and do not ignore it from the other side. Take it as a small piece of valuable information. To deal with such cycle, we use again a combination of formal approach and common sense.
Step #1: formal approach
This is what the formal math shows. We see here three curves, and they all show the same thing, a peak around the New Moon (zero degress):
.
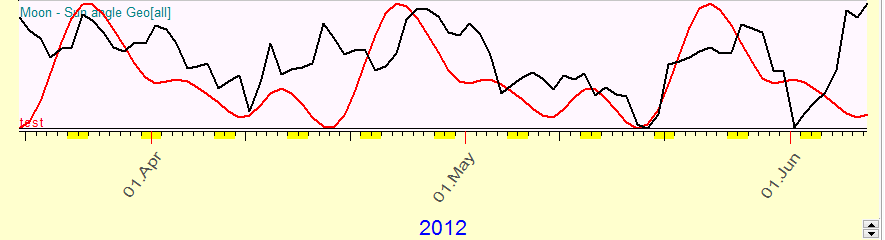
Step #2: common sense
While the projection line based on this cycle does not look good by itself, look at it together with the price chart (black - the price chart, red - the projection line based on the Moon phases cycle):
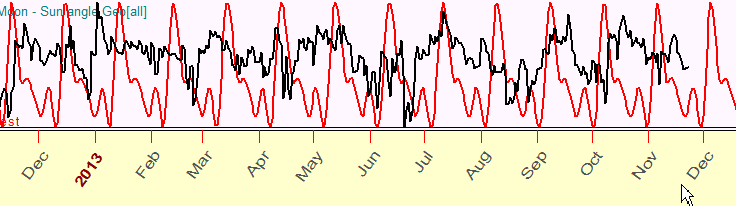
From time to time this cycle works:
Researching sets of data or some specific models, we need to apply both - formal math and our common sense. Together, they can provide results that we are looking for. Ignoring any one of the two, we definitely miss something important.
November 19, 2013
Toronto, Canada.