Moon model
In this article, I would like to introduce the technology of creating a projection line based on the Moon movement. The model that we will discuss here is a phenomenological model. It means that we have a technology of creating this model, though we do not have any formal theory that explains why we should do that... "I know how, but I don't know why".
Let's start:
Step #1: Download at least 5 years of the price history. Usually I download daily chart data for this model, though you can download hourly charts as well.
Step #2: From my observation, the most workable cycles are two Moon-related cycles, may be three cycles. Here they are:
a) the Moon phase cycle;
b) the Moon geocentric cycle;
and may be c) the Moon Draconic cycle.
Before creating any Moon-related forecasting model, we have to decide what cycle among these three is more important for your financial instrument. In order to make this choice, you have to set Learning Border Cursor (LBC) one year back.
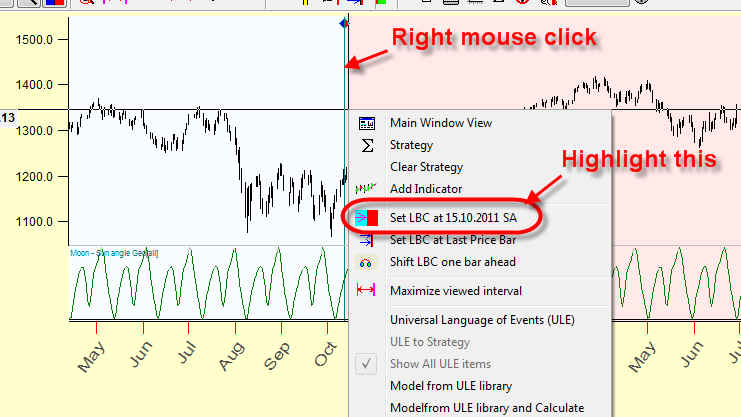
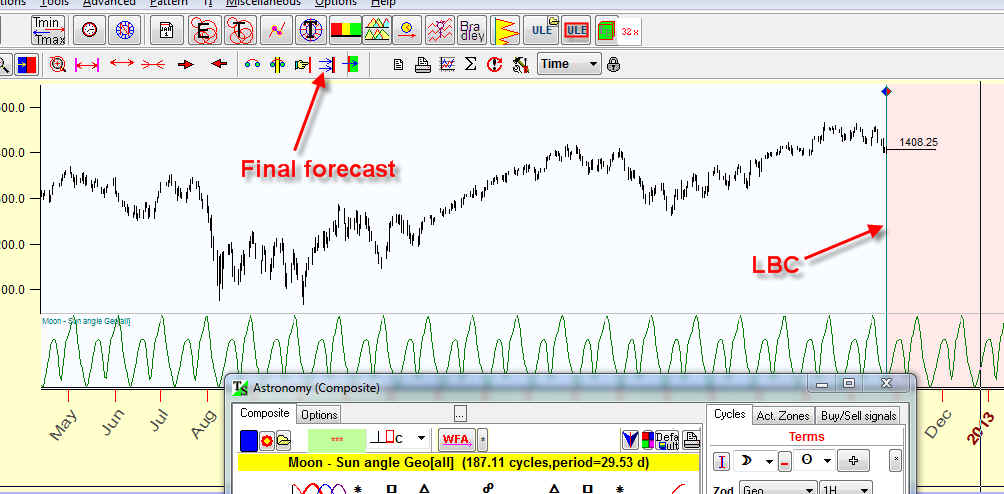
For example, I have downloaded daily chart for S&P 500 mini futures since 1997, and today is October 26, 2012. So we set LBC at the beginning of October 2011 (with the right mouse click):
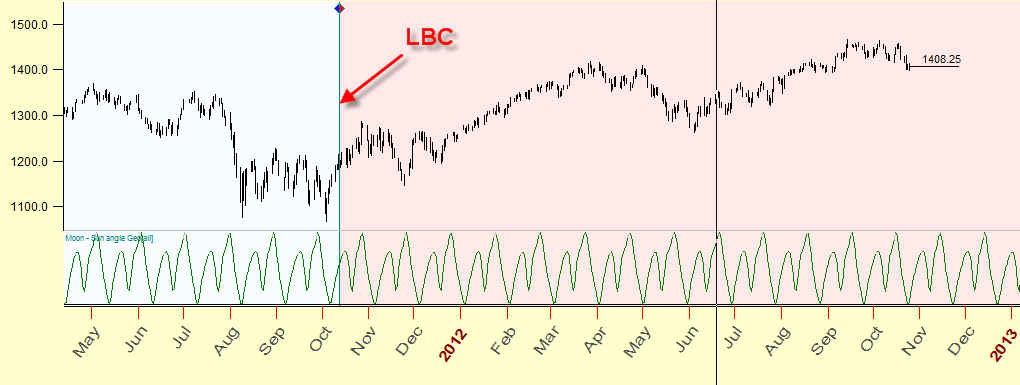
You see that this vertical line LBC separates two parts of the price history:
Now let's calculate these Moon cycles one by one and watch how each cycle forecasts the future on the TESTING (=C) interval, i.e. watch how its projection line correlates to the price history after LBC.
Run Composite module ("Astronomy" button) and set the Moon cycle there (Moon-Moon means the Moon position):
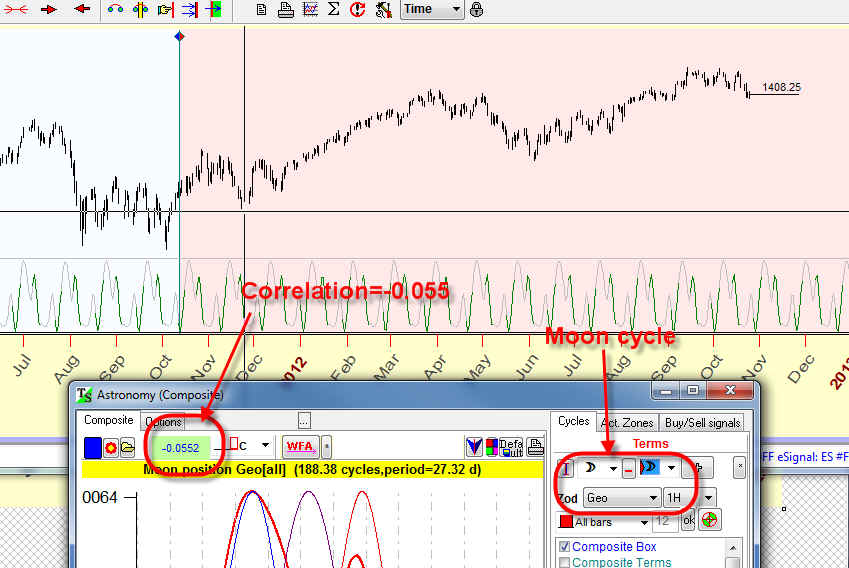
In the left upper corner of Composite module the program displays the correlation between the price (or, to be exact, the price oscillator) and the projection line. In our example, it is MINUS 0.0552.
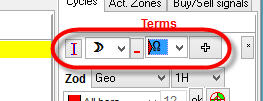
Choose the Moon phase cycle (the angle between the Moon and the Sun):
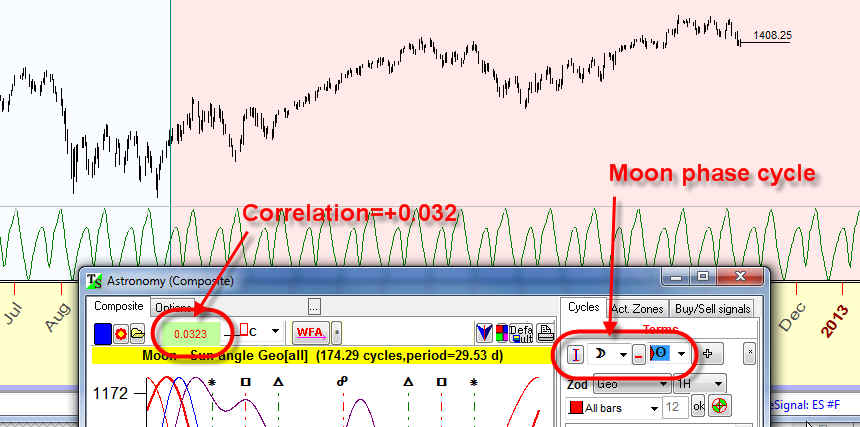
The correlation here is POSITIVE, it is 0.0323
It means that for THIS financial instrument the Moon phase cycle works better FOR THIS YEAR, so set the Moon-Sun cycle. The correlation should be positive.
In one year I recommend to repeat these calculations, to find the most workable cycle. These cycles can change from one year to another.
To set the Moon Draconic cycle, use this:
The correlation for the Moon Draconic cycle is negative in our example.
Step #3: Finding the best stock market memory.
There is some trick here. We try to consider here the Moon cycle as a dominant cycle, i.e. this cycle works for some period of time and after that stops working. This is why I have called this model a phenomenological one. Usually astro cycles do not work this way, they work approximately the same way all the time. I don't know why the Moon works this way ....
So, the next step is to find the period where the Moon cycle works in the same way. Follow these steps:
Set LBC to the last price bar clicking this button:
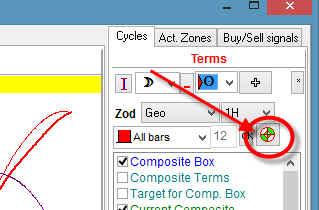
Click this "target" button:
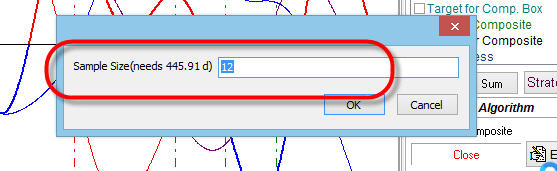
Set sample size to 12:
After the calculation, the program finds the best stock memory and sets it automatically. In our example it is equal to 7:
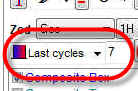
It means that this cycle (the Moon phases) works the same way within 7 months (seven full Moon phases). You can look at it as a period where the Moon keeps some specific information about the stock market.
The projection line based on this Moon cycle is displayed immediately in the Main screen:
Parameters to vary: You can try to vary these parameters:
Sample size - this parameter is used for Walk Forward analysis:
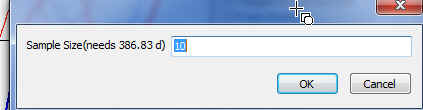
Do not use big values for the sample size, it should vary in a range of 8-18.
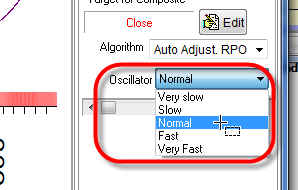
Try different oscillators (Fast/Normal/Slow):
November 1, 2012
Toronto, Canada