Building Annual and Moon trading models
Q-Models
Here the new type of trading models will be introduced - Annual and Moon based Q models. Annual and Moon models are described on our website; they were discussed many times on our Timing Solution Forum (TS Yahoo Group). In this article, I will show how we are trying to find some ready trading solutions based on these cycles (Annual and Moon). We can do that now as we are able to create projection lines based on these models and we are able to verify them. We worked with projection lines for years, and Timing Solution software is able to produce projection lines based on different ideas. A verified projection line shows the most probable direction of the price movement, and this fact gives a new breath to financial analysis. In brief, we are able now to model the market (this is what projection lines actually do), and we can find the maximum fit between the projection line and the actual price. This is what Timing Solution software does.
Our next goal is understanding how to trade a projection line. Generally speaking, if we have a projection line (or a market model), that is quite reliable, trading should be very simple: buy at projected minimums and sell at projected maximums. So, we can make a software that provides trading signals based on that projection line. It is so obvious and so simple theoretically. Practically, a task of obtaining profitable trading signals from the projection line turned out to be an unexpected problem to me.
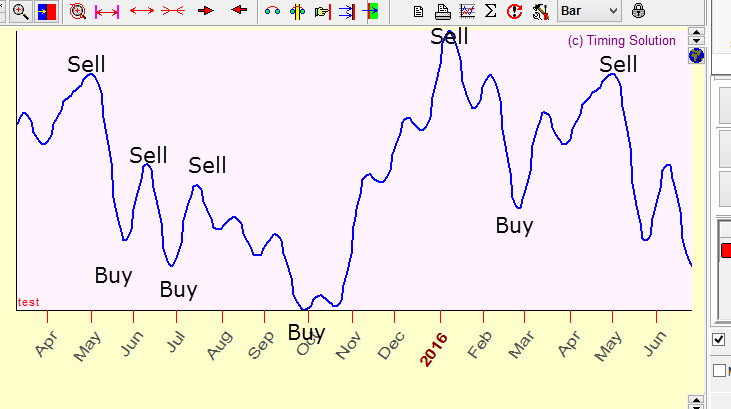
Let me explain what it is. Please consider this example. It is Annual cycle calculated for S&P500. I have assigned trading signals there using a very simple rule: an obvious low (bottom) of the projection line is a buy signal, and an obvious high peak is a sell signal:
I can do better, taking profit into the consideration. These are Annual buy/sell signals located with T17 module of Timing Solution software, created for the same projection line:
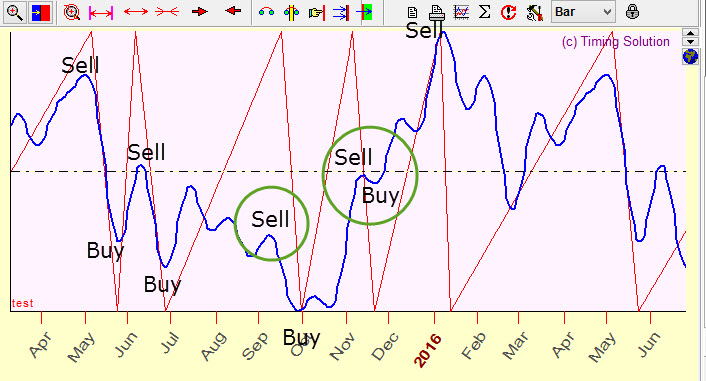
As you see, some signals coinside while others are not, as for signals in the beginning of September and November. Moreover, the local top in September is more important than the global top, if we consider profit:
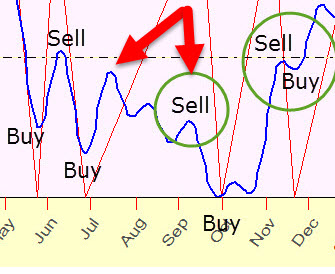
It is not an algorithm error, this is specifics of financial data.
Thinking about this problem led me to creation of a new module. It is still based on things that we can do well (as Annual and other cycles), plus it puts into action things that I have discussed so many times - things like predictable zones. Adding them to traditional algorithms improves trading signals.
Annual predictable zones (Q-Annual cycle)
So, as I have mentioned already, we can combine a regular cycle (such as Annual cycle) and its predictable zones, to create trading signals that give better results from the profit point of view.
In the software, it works this way:
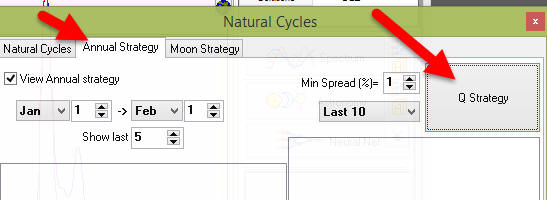
- after downloading your financial instrument data, run Nutural Cycles module clicking this button in the Main window:
As an example, NFLX data is used;
- open "Annual Strategy" tab and click there "Q Strategy" button:
- after a quick calculation, you get a list of suggested Annual strategies, like this one:
What does it mean? It is a list of suggested strategies based on the stock's Annual cycle. (Remember that this is not a trading advice; it is just a suggestion based on our analysis of the market and on the software features; it may be used only as a some point in your decision making). The very first recod there says that this stock (NFLX, Netflix), within the last ten years, since January 7 till February 8, went up 10 times (zero downs):
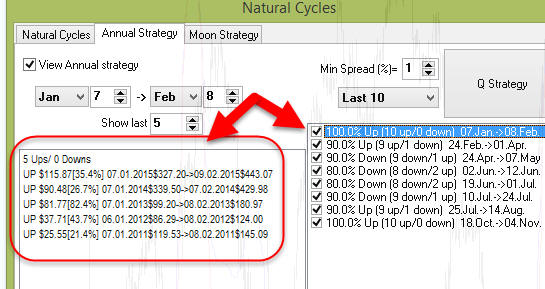
In other words, all ten years this stock's price went up from January 7 to February 8. This upward movement at this time of the year could have slightly different starting and ending dates for different years, though. You can see the details in the left panel; they appear if you highlight this strategy. So, a recommended strategy is buy Netflix's shares on January 7 and selling it February 8.
Altogether, the program has revealed eight trading strategies for this financial instrument within a year, and you may see these stretegies in the Main window overlay of the price chart:
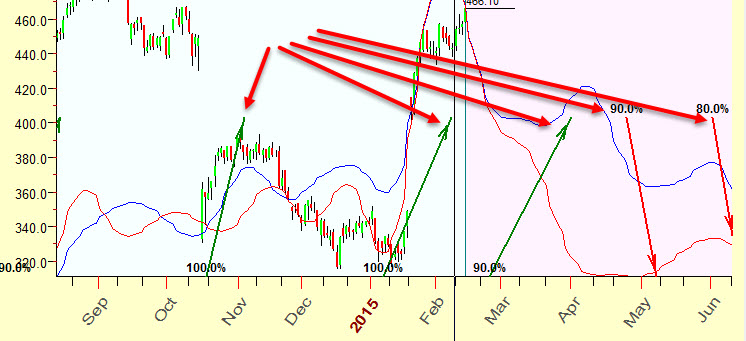
Green arrows correspond to up trend strategies (to start a long position), red arrows are for down trend (short) strategies.
PS for NFLX. There was an actual trade made, exactly at those dates, as a part of module's testing. The deal was profitable (the price per share went from $327 to $440), as expected. However, this year's up trend has started much earlier (you could buy NFLX as low as 316 in December) and goes much longer (it was around 466 on February 13). This is why this technique is experimental; there is a room for the software improvement as well as there is a room for your decisions. Also, it is important when the analysis is done. New info changes the analysis that is several months old.
One more note. This module works well for investors and for position traders (those who can afford to keep a trade for days and weeks, even months). To find a proper financial instrument, you may want to look at the industry first and then check individual stocks there.
Moon predictable zones (Q-Moon cycle)
Moon cycles are enigma for me. The cycle period is just one month; it makes this cycle very appealing for a swing trader. I have spent a lot of time trying to find an appropriate model for Moon cycles (for example, applying Walk Forward Analysis module in Composite module). This approach looks very promissing; at least it gives stable results (Walk Forward Analysis does not).
Firstly, you may do simple calculatiuons here. For example let us check the trading stategy based on Moon phases. Let 's do that for DuPont shares (DD). The strategy is:
we buy DD shares at the New Moon (which is Moon-Sun angle 0 degrees);
we sell them at the Full Moon (Moon-Sun angle 80 degrees).
We would like to know how this strategy worked within the last 5 years.
In order to do that, open "Moon Strategy" tab in "Natural cyclles" module and do as in the picture below:
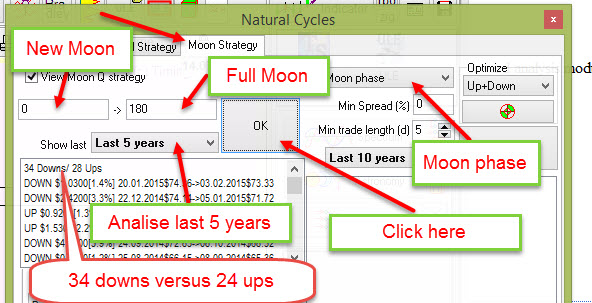
As you see, for the last five years, according to this strategy (buying at the New Moon -> selling at the Full Moon), the price went down 34 times versus 24 times up.
I am not sure how you like this strategy. Maybe, we should allow the computer to find the best Lunar strategy for DD shares, if it is possible. Moon phases cycle can be optimized, and there are other Moon based cycles as well; a lot of choice here.
Click this button:
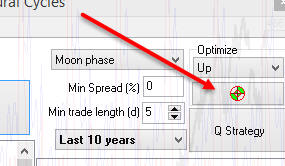
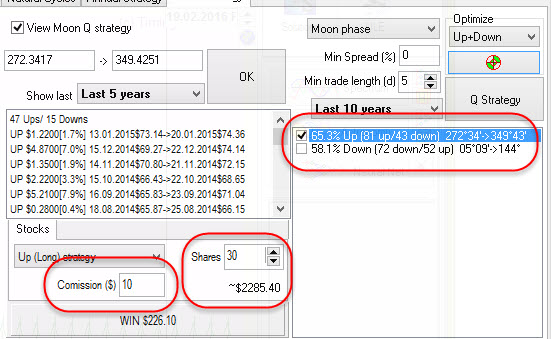
The program checks possible strategies for Moon phases and Moon tropical cycles and shows only those strategies that give the best results. Here they are:
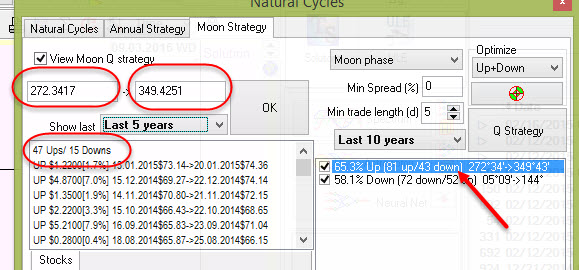
You see the best long (expecting uptrend movement) trade could be made with this Moon phases strategy (buying DD shares when Moon-Sun angle separation reaches 272 degrees (or the Moon is in its last quarter) and selling when this angle reaches 349 degrees (a day before the New Moon). For that period, within last 5 years the price went up 47 times versus 15 times down.
Look at the Main screen. The program displays these strategies as arrows (green up arrows - expecting up trend movement, red down arrows - expecting down trend movement):
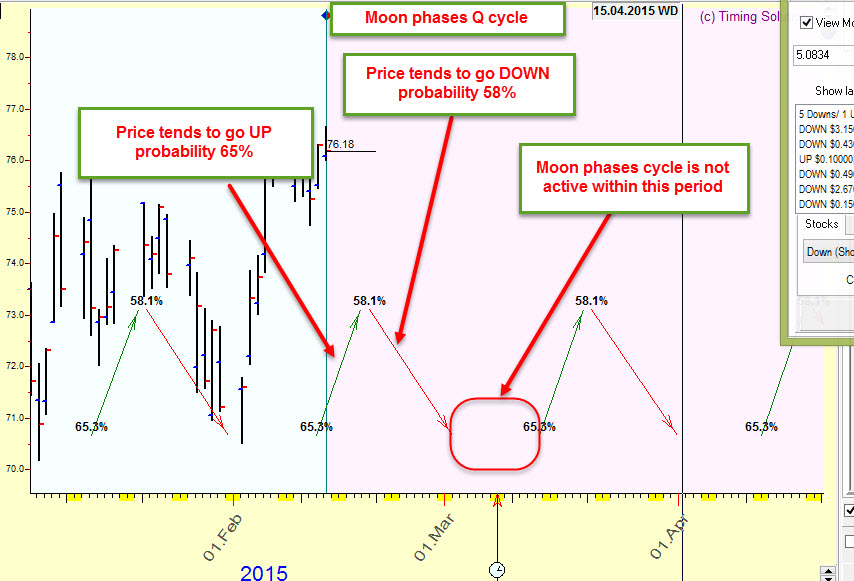
Sometimes the cycle is not active. This is the core of this technology - we are looking for some predictable zones, some certain price movement takes place inside them. Once again, this is a possible answer to the question how to trade using projection line.
For example, let's draw together Moon phases projection line (a bottom green curve calculated with Composite module) and Q chart arrows (Q here stands for Quantum):
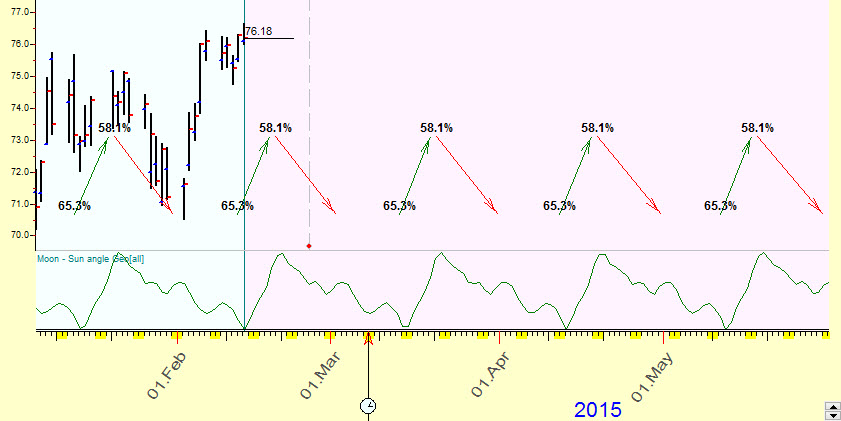
A projection line shows the general tendency of the Moon phase cycle applied to our financial instrument while Q chart shows trading zones for it.
Next step, let's model a real trade and include a comission. For Moon cycles, this fact is critical, because trades recommended by this cycle are rather short in time, typically they take about a week, and incorporation of comission values may change the picture drastically.
Let say we are buying DD shares. The latest price for DD shares is $75.18; we buy 30 shares, it will cost us $2285.40. Let a comission be $10 per a trade:
So our strategy will be:
Once a Lunar month we buy 30 shares of DD at the moment when the Moon-Sun ange reaches 272 degress (we take a trade which is the CLOSEST to this date), pay $10 for that.
in 6-7 days when this angle reaches 349 degres we sell this stock and pay $10 comission again.
During a year it will be about twelve 6-7 days trades, all other time we are out of market. No reinvesting to avoid exponental growth, I always buy 30 shares.
As you can see, this strategy allows to make within 5 years $226:
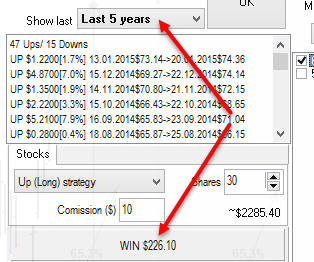
Not too much. But within last 6 months it allowed to make $334 (anually 33%):
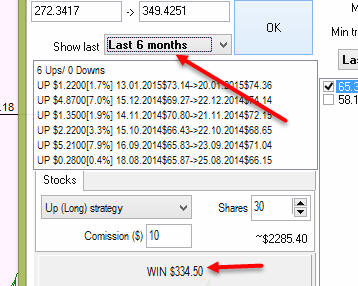
However, if we look at the profit for the last 1 year, 2 years etc., - we can see that it decreases.
It is not a good example from the profit point of view. My goal here was just to demonstrate how this technology works; you should specify the capital you may trade (the amount of shares) and check Lunar strategy. I have conducted this test for two dozens of random stocks and have found that Moon cycles work for a half of them. It means that you can use Q chart for these stocks, it provides statistcally verified information and it may be used in combination with other techniques (for example, Annual strategy).
Is it possible to trade Moon cycles alone? Honestly I do not know, this issue needs more research. I've spend too much time modeling the Moon cycle, so I am always ready for a some new suprise from it. Though results look promissing, for example anlysing Mangalore Chemical (MANGCHEFE.NS) I got $301 profit for 6 months (annualy 23%), one year 396 (annualy 15%), for two years $733 (anually 14%), for three years $1033 (anually 13%).
BTW, it looks like the Moon cycle works practically for all India stocks. You may want to check that yourselves.
Also, it seems to me that Moon cycles have some patterns they follow for ten years in a row (or something like that) and then they change it. It also needs more research. It is quite possible that we need to add some specific risk management, in case that the cycle may be changing exactly this year.
Sergey Tarasov
February 16, 2015
Toronto, Canada