written by Sergey Tarassov
In this article we discuss quantum trading strategies based on astro phenomena. I will try to do that as simple as possible. The module that creates quantum trading strategies is a part of Trading Strategy Constructor module (****). Right now this module employs pretty sophisticated math to find the best quantum strategy; it does that fantastically fast. Without those super fast algorithms, this module would be just some "Digital fortress", while the computational time would make it useless.
No matter how sophisticated and complicated all these models/math/algorithms are, there is a very simple idea behind it. I will explain below the core of this idea putting away all math details. The information that you will receive is enough for making you able to create your own quantum astro models (this is why this article sometimes may look like a documentation for this module).
When I first was introduced to mechanical trading systems (it happened in a mid of 90s), I had a feeling that technical analysis tools are not providing a whole picture of the price movement. Having open, high, low, close values plus sometimes volume plus sometimes open interest - gives us the impression that everything is under control, except some small thing, and we will catch this thing soon, very soon. We need just find one, better, indicator - and we will be the winners. And new indicators appear, and again we have the same feeling - one more step, and everything will be OK. And then we begin to see that newly invented technical indicators are very similar to what we already have, and we are still there... The situation with the technical analysis reminds me a crowd in the closed room. People there may regroup, may start different activities, - but it is still the closed room, and they are still not going anywhere. Some missing link definitely persists; what we do is attempts to find that missing link. Where is the missing link located? What is it? Fundamental analysis that considers everything that is going in the World - unemployment, economy reports, government regulations? Might be, though it is not enough, for sure...
IMHO we have to search this missing link taking a more active position. Do not restrict your activity with the explanations of what has already happened; instead, try to model the stock market behavior (and model the economy tendencies as well, considering the big picture). In this case, the usage of astronomy/astrology is very effective.
When I made my first projection line based on astro phenomena almost 15 years ago, I was very impressed. Usually such projection lines look like this:
There was something appealing in those projection lines; they were like a diagram of the stock market's breath, that was pretty clear. Still, that was not the final answer. And my main goal became very clear to me: to create a mechanical trading system that is based on the stock market modeling rather than on some combination of technical analysis indicators. OK, the projection line idea is good, but how can we get buy and sell signals from it? That was one more of missing links; and I spent 10 years trying to answer this question (Timing Solution/Market Trader users saw the steps of this quest in the programs). I always had a feeling that the projection line lives its own life reflecting the breath of the stock market while we need something different to get buy/sell signals. It looks like Quantum Astro model reveals one more missing link.
Let's consider the simplest astro phenomenon, the Sun declination. This is how the Sun declination goes within a year:
The question is: "Can we trade the Sun declination?". There are a lot of theories that employ the idea of planetary declination; most of them sound something like this: there is the price turning point when the declination reaches its extreme value (1) or crosses zero (2) or passes some specific degree. Sometimes these theories are true, however the problem is still there: we cannot create buy/sell signals using this information only (trust me, I played with that a lot!). It might be that the astro phenomena give us some hints; but - read all astro finance publications, and you will get so many hints that they become useless in the end of the day. We need something more certain than the statements like this one: "when some astro phenomena occur, the price tends to..."
Now, how about doing something together? Maybe, it would be a better way to understand what I am talking about... Let us do this: we will trade S&P 500 mini futures daily using the Sun's declination. We will use the price history since 1998 till July, 12 2010. We will do it step by step.
Everything starts with a general Idea
Before doing anything, we need to have an idea. This general idea will be used to create our models and construct the trading strategy. Let it be this one: "S&P 500 mini futures price tends to reach its turning point when the Sun's declination is high". Consider it as a hint: "You should watch the market attentively when the Sun's declination is high". We can take this statement as a direct order, and we will make several trades within a year. And I guarantee that these will be not so good trades. Astro based models are great with finding turning points, though somehow these models do not see the difference between top and bottom turning points (the "inversions" problem). So we just keep telling to our program to pay attention to the moments when the declination is high. It does not mean that this system will not trade if the declination is not high. It trades all the time, and when the declination is high, it watches more attentively for trading opportunities.
Quantum model: our idea meets the real price
Now the time comes to employ quantum algorithms. The program watches the real price and evaluates how the real price movement corresponds to our idea. The program generates quantum moving average, it looks this way:
These steps correspond to the moments when something important happens (important - from the point of view of our Quantum model). If the step is opposite to its previous direction, the program considers that moment as a potential buy or sell signal.
Look at the picture below; the program has performed a sell signal when the downtrend step appeared after four uptrend steps:
The height of these steps (quanta) is calculated by special very fast algorithms; these algorithms perform noise filtering as well.
This picture shows how the model "high Sun declination" works actually:
The Sun declination is displayed overlaying the price chart (this is practically an ideal sinus wave). You can see here that when the declination is high (it does not matter, what declination it is - North or South), we have more trades because quantum moving average is more detailed when the Sun's declination is high.
Final step before real trade
As a last step before a real trade, the program performs one more filtering removing whipsaw trades and performing risk management (if you need it).
Thus the quantum algorithm performs the whole cycle: forming an idea, looking at the real price in respect to this idea and cooking real trades. We have started with a general idea that was initially formed as a hint, and step by step we have dressed this general idea in the clothes of the stock market reality.
Particular this idea would give us the profit $217K (one 100K contract), win/loss=63.4%, it has traded once in 11-13 days (trading days):

Variations
In Timing Solution you can create you own quantum astro models. For example, you may wish to explore this general idea "the typical distance between two succeeding turning points is 9 degrees of Mercury's travel path" (in other words, it means that Mercury's move for 9 degrees covers the distance between two turning points").
We can do that. As you see on the picture below, this moving average reflects Mercury's movement, the distance between two steps of quantum moving average is 9 degrees of Mercury's movement, and we have more trades when Mercury is fast:
Or you may like this model based on the Moon phases; the quantum moving average reflects the change of the angle between the Moon and the Sun:
I would like to remind you that the program finds itself the optimal angle separation between the planets; in this example the distance between two steps of quantum moving average is 43 degrees of the Moon-Sun angle change.
Afterward
I used above the simplest examples to make my general idea clearer (use some astro statement together with quantum moving average). In reality you can create more complicated models that involve other planets and other astro phenomena. You can create as well the models that employ dominant cycles etc.
Instruction for Timing Solution users how to create quantum astro models
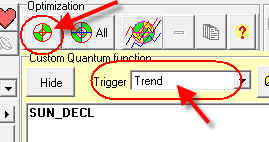
You can create quantum astro models through #4 Custom section:
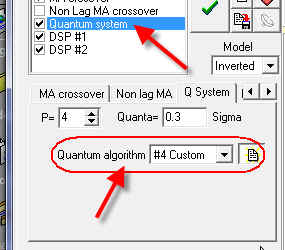
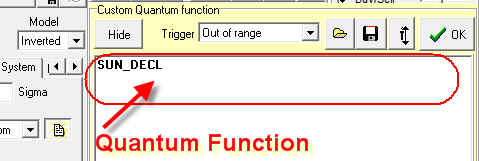
and here you should define the Quantum Function:
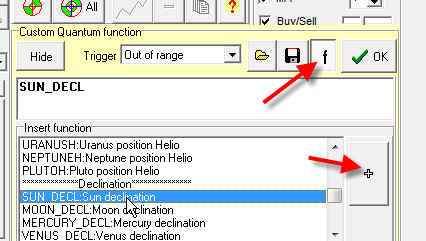
For your help: clicking "f" button you get the list of available functions; you can insert any of them in edit box clicking "+" button:
More trades when the Sun declination is high
Let start with the example in this article; the system trades more when the Sun declination is high. To repeat what I have done, follow these steps:
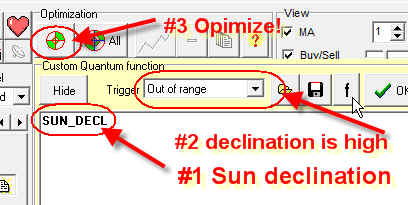
#1 Type SUN_DECL formula
#2 Set out of range criteria
#3 Click "Optimize" button
In several seconds, you will get the sorted list of trading models based on the Sun declination:
You see that the program makes trades when the Sun declination is higher than 4.57 degrees South or 5.27 degrees North.
You can create more complicated formula, like this (superposition of declinations):
(This is just a sample of the program's abilities; I did not get any good results using this formula.)
"Trend" trigger - a potential turning point takes place when the Sun declination travel path is %X degrees
Set "Trend" trigger and click "Optimize" once again:
You will get this:
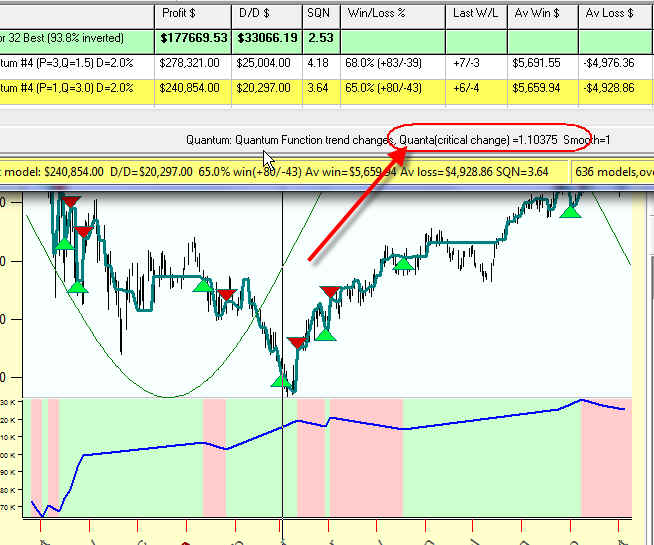
In this example the quantum moving average jumps to another price level when the Sun declination travel path reaches 1.1 degrees. In other words every time when the Sun declination changes on 1.1 degrees we check this moment as a potential turning point.
Moon phase model
Not bad results are provided by the Moon phase model. This model trades faster if Moon phases change faster.
Mercury phase model
This is quantum model based on Mercury phases:
You can create quantum models that use the planetary speed this way:
Mercury helio speed:

and Mercury geo speed: