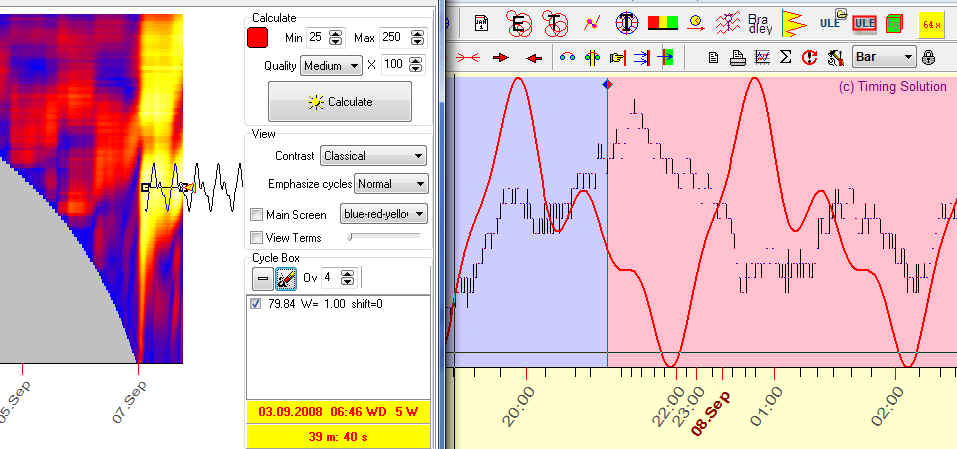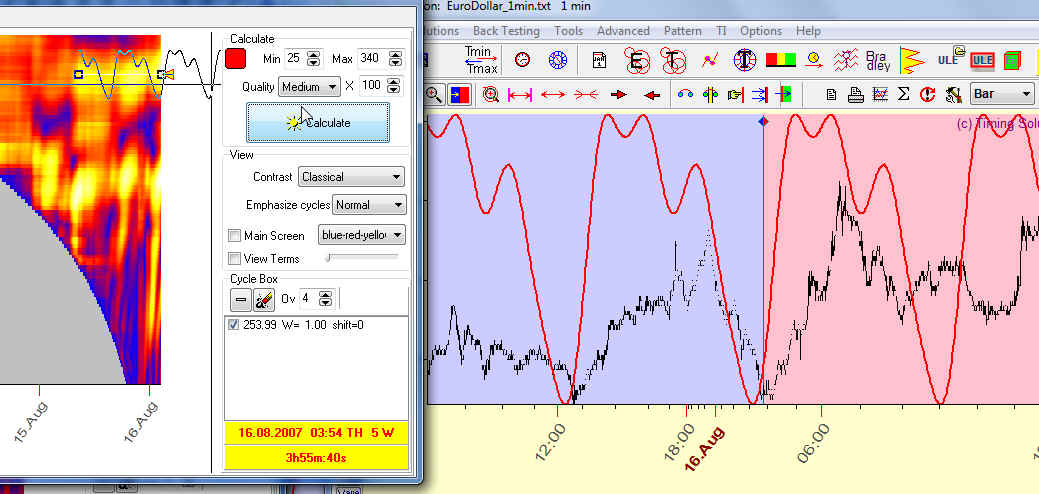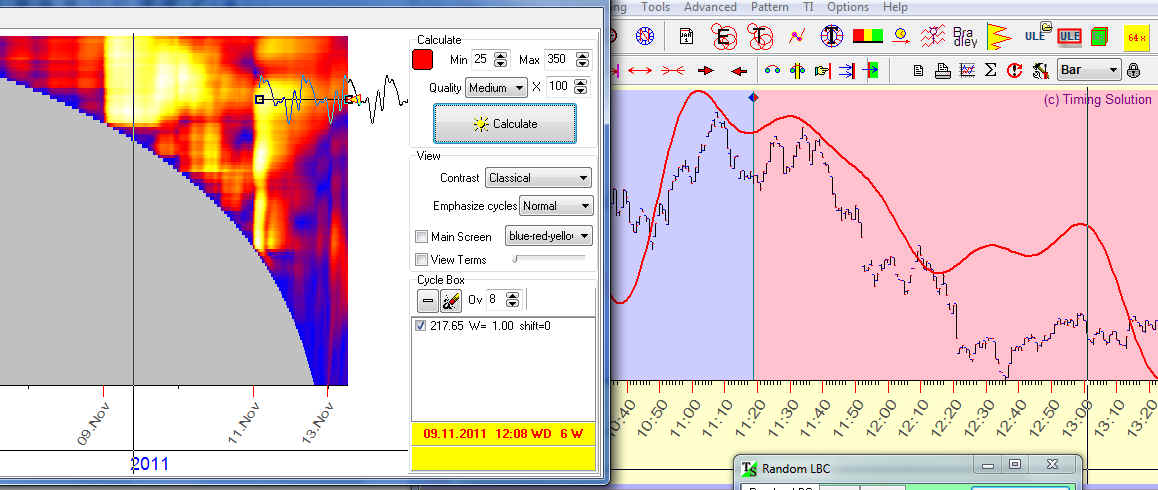
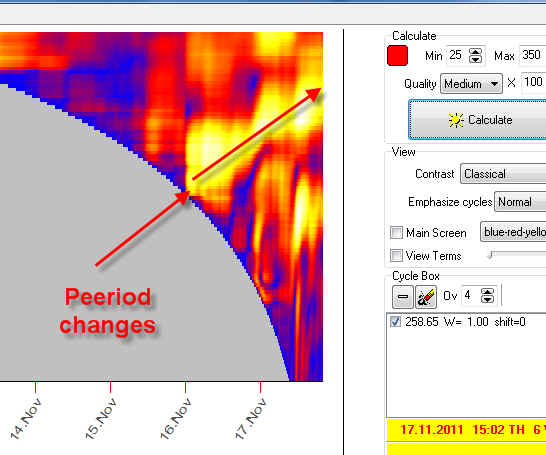
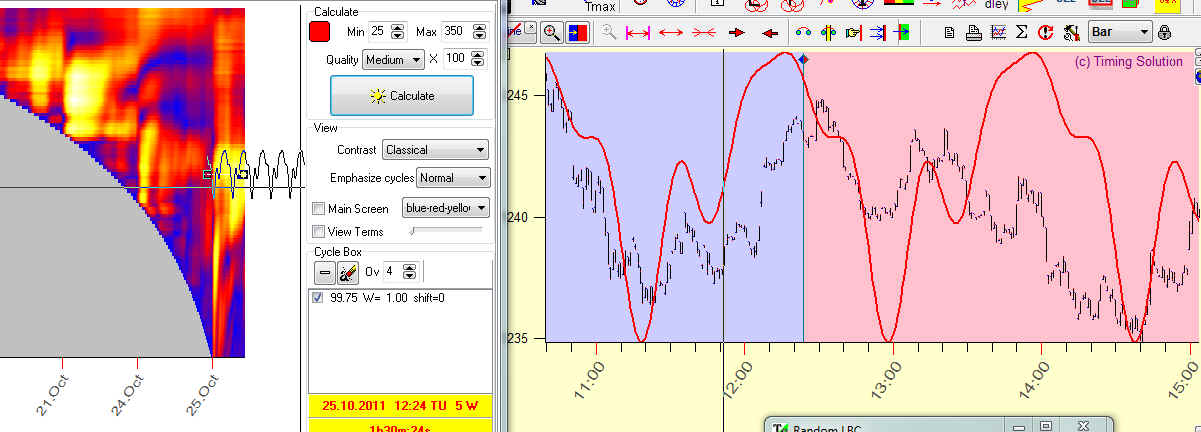
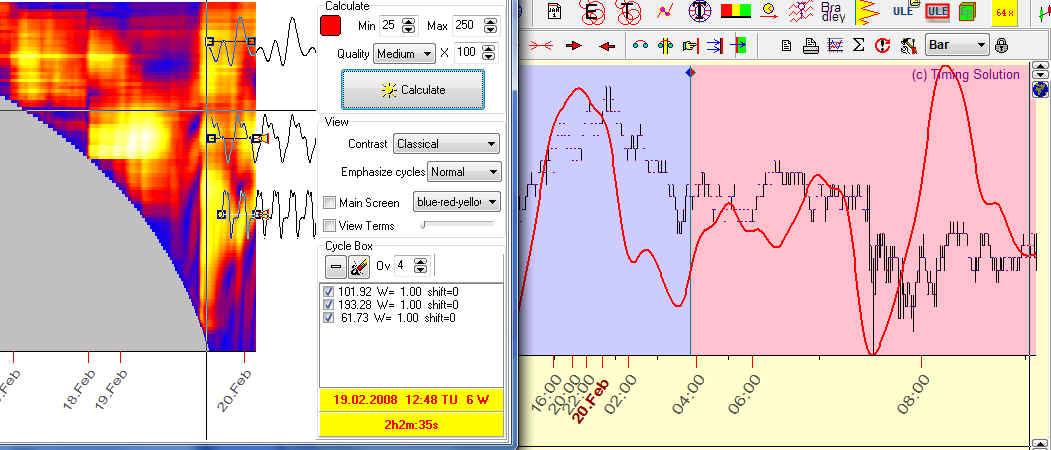
Examples of wavelet diagram application
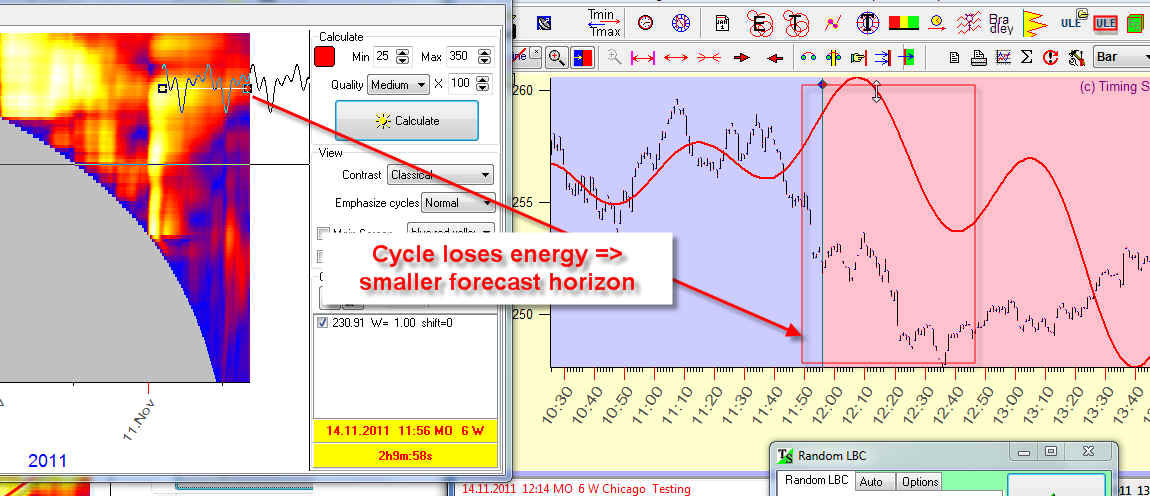
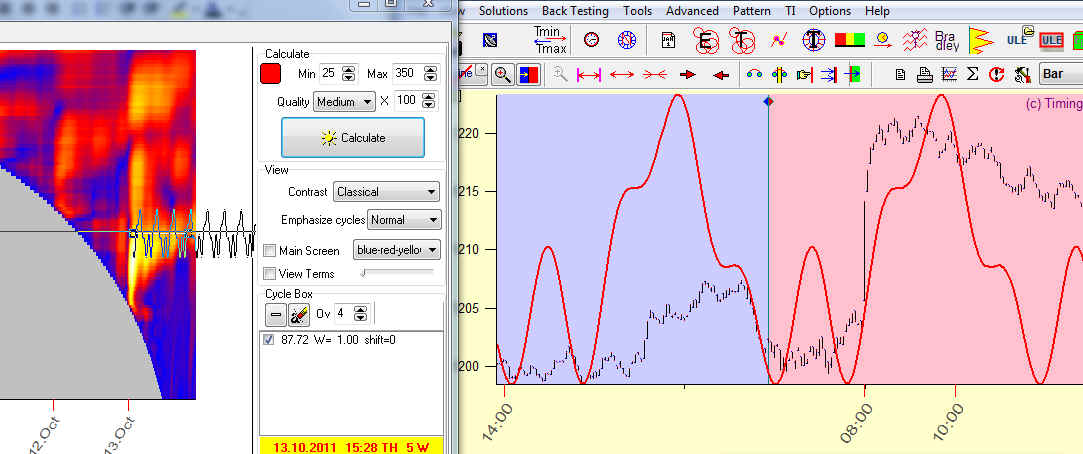
Here you can see samples of wavelet diagrams where we have selected some working cycles (horizontal oriented bright zones). On the right side of the diagram, you can see the projection line based on the selected cycle (a red curve), together with the price data.
S&P 500 1 min chart
The cycle below is too "young" 1.5 full periods, you may try it though it is risky:
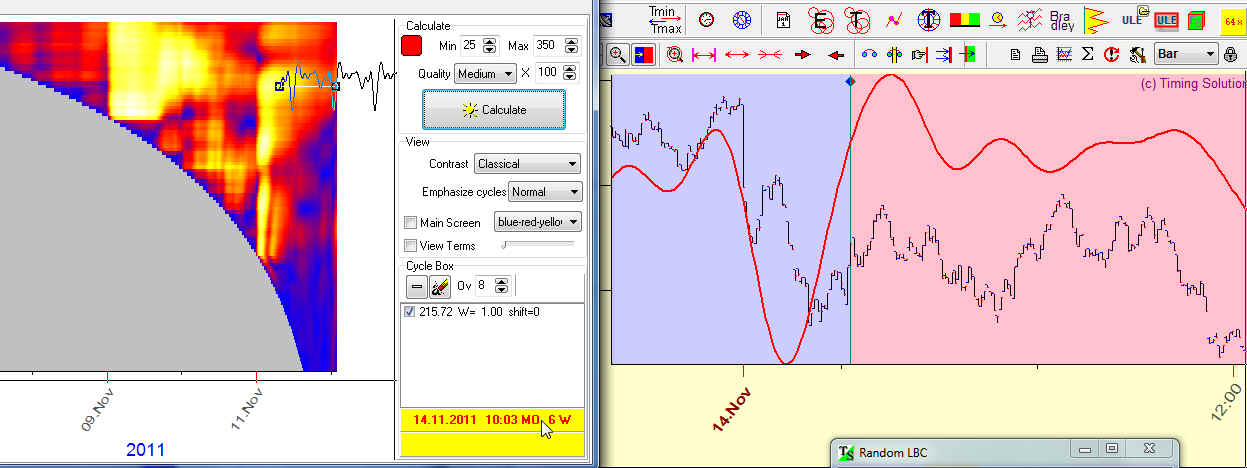
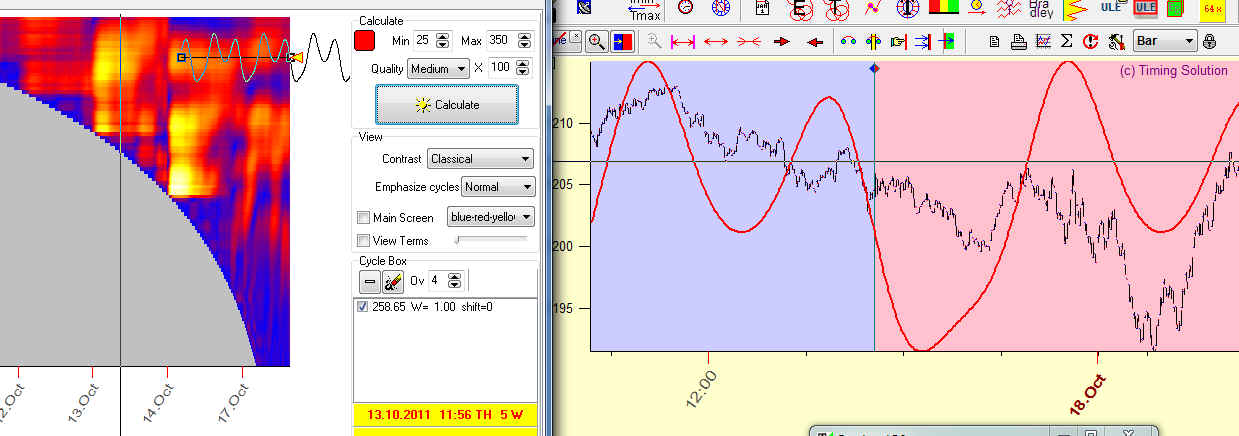
These cycles are very strong, however the life time of these cycles is too short:
The cycle below loses its energy, so the forecast horizon of this cycle is short - only half of the cycle:
EURO/USD 1 min chart

This is a very random case - three cycles work simultaneously:
This cycle is not working: