Waxing/Waning - Optimistic/Pessimistic indicator
written by Sergey Tarassov
In this article I will demonstrate how to work with models based on waxing/waning phases of the aspects between the planets. The research shows that this model is one of the most reliable though to obtain this model we need to use a very advance Neural Network technology. This model is a very good combination of the old and the newest knowledge.
The old knowledge regards to the usage of the Moon phases. The fact that different Lunar phases affect human nature differently is well-known for centuries and usually does not need any proof. Together with the tides, it is the most popular argument of the astrologers. The waxing Lunar phase (increasing light; it takes place between the New and the Full Moon) usually is considered as a good time for new deals and the beginnings. It looks like this is more optimistic period than the waning period between the Full and the New Moon, especially the last day before the New Moon.
We can apply this idea to any planetary pair, not only the Moon - the Sun. As an example, we can say that the Sun and Jupiter form the waxing angle between their conjunction and opposition while the waning angle between the Sun and Jupiter goes from their opposition to the next conjunction. I know two indicators based on the balance of waxing/waning planetary angles. First of them is Guneau Index; it is calculated by adding the angle of separation between the planets for waxing pairs and extracting for waning pairs. Another index is Index of Cyclical Variations; it is calculates as a difference between the amount of waxing and waning planetary pairs. The higher this indicator the more waxing planetary pairs we have. Even a general glance at these indicators proves that they are pretty useful to reveal the stock market behavior.
This is Index of Cyclical Variations calculated for planetary pairs that involve the Sun, Mars, Jupiter and other planets up to Pluto. It is shown together with Dow Jones Industrial index for the last 5 years:
To be sure that this fact is not occasional, I have conducted the statistical analysis. It shows that the probability that this indicator correlates to the oscillation of Dow index is 98%:
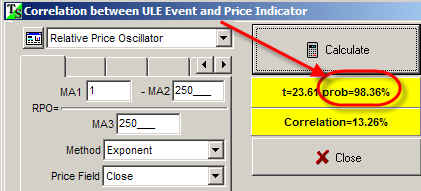
The analysis is performed for Dow data from 1885 till the year 2007 years.
Leave 2% to skeptics while we continue our research and try to improve our model.
I personally think that waxing/waning between planetary pairs somehow gives to the humankind the optimistic/pessimistic feelings, and this mass factor is affecting the stock market. Of course this is just some phenomenological theory.
The newest technology allows to go further. Above we have assumed that the weights are the same for all planets, though it looks like the optimistic/pessimistic effect should be different in respect to different planetary pairs. Now we can think about this difference, and our Neural Network technology allows to figure out how actually these planetary pairs work.
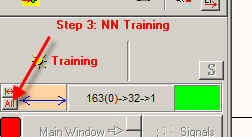
In order to do that with Timing Solution software, run the Neural Network (NN) module and train this NN using waxing/waning events as inputs for the neural net (inputs are things the forecast is based on). As output (what to forecast), I use the relative price oscillator with period 100 bars. After training I have got this projection line (the red line):
for last 5 years:
.
for last 15 years:
For the next two years this index looks:
The interesting fact is that we can extract knowledge from Neural Net. Look at this table:
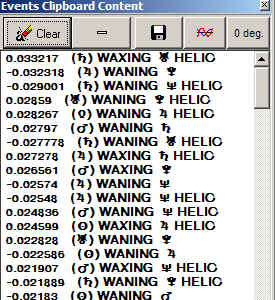
It shows the most influential planetary pairs. Some planetary pairs provide upward effect while others have downward effect.
How to read this table? Look at the first line ![]() .
It means: Dow tends to go
above the average when the waxing angle between
Saturn and Uranus in Helio i.e. this is an optimistic factor. The second line
.
It means: Dow tends to go
above the average when the waxing angle between
Saturn and Uranus in Helio i.e. this is an optimistic factor. The second line ![]() means: the Dow tends
to go below average (a negative digit) when Jupiter and Pluto forms a waning angle -
a pessimistic factor.
means: the Dow tends
to go below average (a negative digit) when Jupiter and Pluto forms a waning angle -
a pessimistic factor.
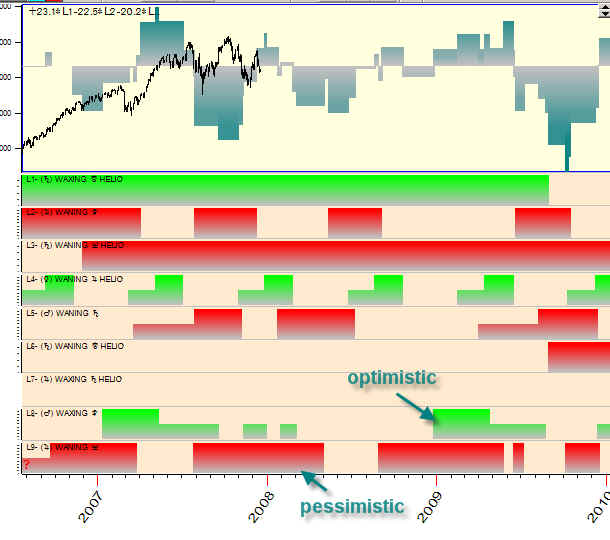
On the diagram below you can see the most active pairs. I have marked by green color the optimistic pairs and by red the pessimistic ones:
Some recommendations to Timing Solution users:
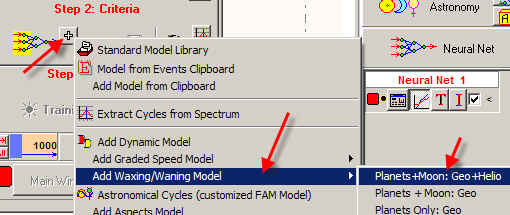
1) I have found that it works in Geo and Helio Zodiacs. Also it is necessary to use the transiting Moon. In Neural Network you can set this model this way:
2) Use all available price bars to train the NN:
It means that this model has "infinite stock market memory", i.e. this model would work the same way for now and 100 years ago (as an example). In other words we assume that the human reaction on waxing/waning phenomena has not change in time.