e-Mail: Test
.
Date 26th 2009f July 2009
Test
e-Mail: Test
.
Date 26th 2009f July 2009
Test
e-Mail: Sergey
.
Date 26th 2009f July 2009
DB test, July 26
e-Mail: Sergey
.
Date 26th 2009f July 2009
New Test
e-Mail: Ross Town
.
Date 29th 2009f July 2009
Hi Sergey, please kindly add an inversion checkbox button for the Natural Cycles. If possible, please make the inversion cycles to be shown with the regular cycles. Thank you very much !!!!!! Ross
e-Mail: Pier
.
Date 11th 2009f August 2009
In Planetary Price Slice isn\'t possible to check Node movements... could you add in next future?
e-Mail: Peter
.
Date 11th 2009f August 2009
Some \"bug\" I ran recently.
I press the excel button in the ephemeris generator and dont get anything.
Thanks
e-Mail: Peter Tryde
.
Date 20th 2009f August 2009
Would it be possible to include the STC indicator in TS? It is very effective. The code is available in a 20-page report I can send you by email. Best regards. Peter
Schaff Trend Cycle (STC) is a popular indicator commonly used to identify or confirm price
direction and market turning points. It was created by Doug Schaff and is based on the
assumption that currency trends accelerate and decelerate in a cyclical pattern that can
reflect the dominant price cycle of any currency in any timeframe.
.
Schaff created the STC after trying to resolve the discrepancies that he observed between
two widely used methods of determining trend:
Moving Average Convergence and Divergence (MACD), the movement of two moving
averages away from and towards each other.
Price Cycles, the direction of the dominant price cycle as shown by various Smoothed
Stochastics.
The STC is created by running a MACD Line (the difference between two exponential moving
averages) through a Double Smoothed Stochastic algorithm. The resulting oscillator
combines the benefits of trend and momentum indicators. In trending markets it moves
between 0 and 100, rising when an uptrend is accelerating and falling when a downtrend is
accelerating.
In sideways markets the STC is used as a range-trading indicator and can be interpreted
similarly to standard oscillators. That is, the STC can signal oversold conditions when it
turns up from below the 25-Line, and overbought conditions when it turns down from above
the 75-Line.
Why is the STC important?
The STC has several benefits compared to its component indicators. It produces less
whipsaw and fewer false signals than the MACD or Price Cycle oscillators. By combining the
two, Schaff created an indicator that is more accurate and more adaptive than either
original indicator is by itself.
The STC usually turns up or down earlier than the MACD crossover, highlighting prospective
trend changes sooner. In sideways markets, the STC generally travels in a clear path from
under 25 to over 75, making it easier to interpret than the MACD which has no maximum or
minimum values.
The STC is an improvement compared to Cycle Oscillators which can give out wrong signals
when the dominant cycle changes in length. In a strongly uptrending market, for instance,
a 20-bar Cycle can be absorbed and practically disappear into the longer rise to the top of a
e-Mail: Benedict
.
Date 25th 2009f August 2009
Is it possible to export the Values of the displayed curve e.g. a �simple ULE model� into an ASCII file ?
Thanks, Ben
e-Mail: Jim
.
Date 25th 2009f August 2009
Hi Sergey,
Why there is no indication of Chi Squ on the page below? When you press Best Strategy button on previous page, it seems to always give you a long strategy. Is that true? If it can find a short strategy within the Interval that has higher probability, will it display that instead of a Long Strategy?
When you select Optimize Profit or Optimize Risk on this page, it would be nice to see the Chi Sqr to know if the result has some validity.
Thanks Sergey.
JimR
e-Mail: Peter
.
Date 26th 2009f August 2009
2) if you could make an extra button for that new module so that we can directly press on bottoms and tops.I had to take off the values in % (harmonics) .
Not that it took me time but you know what I mean .
3) from (2) .Maybe a selection too for % in zig-zag.That would calculate say from a major bottom up to a the highest point-value(high).That is instead of connecting manually ,the programme could do it based on % zig-zag.
In my opinion that module is one to stay .Pleeeeeeease dont take it off even if it doesnt work.
e-Mail: John
.
Date 27th 2009f August 2009
Sergey, have you had time to look at the documents on this website? http://kerrytheory.info/en/index.html Can anything there be used as predictive forecasting? If so how do I do this with TS? Thanks John.
e-Mail: John
.
Date 27th 2009f August 2009
Sergey, have you had time to look at the documents on this website? http://kerrytheory.info/en/index.html Can anything there be used as predictive forecasting? If so how do I do this with TS? Thanks John.
e-Mail: Bill
.
Date 02nd 2009f September 2009
3. Problem #1, the number of cases up versus down on the \"Events Information\" screen don\'t agree with the \"Efficiency Test For Astrological Event\" screen (push the \"price\" button to get their).
e-Mail: Abhay
.
Date 04th 2009f September 2009
But in Neural Net it does not have any effect of changing Bar/Time, so it still is calculating for those no trading hours.
e-Mail: Peter
.
Date 16th 2009f September 2009
Hi Sergey
This I wanted to ask a long time ago.
How can I get to see values below 0 in the chart(prices that is)?
I want to draw Gann zero angles .
I use the precise(target window) to make the angles go down but dont know at what price they are.Its an approximate.
Thanks
e-Mail: juan cruz
.
Date 17th 2009f September 2009
Could we have an invert button on the Composite module similar to the invert on the Spectrum and NN.
Thanks
Juan
e-Mail: Jim
.
Date 22nd 2009f September 2009
Secondly, when I try to adjust the thickness of the line on the main screen panel, it does not adjust on the main screen.
e-Mail:
.
Date 23rd 2009f September 2009
e-Mail: lesovikov##yahoo.com
.
Date 30th 2009f September 2009
Приветсвую , Сереж. Вопрос касается блока Revealing Astro Cycles. Из параметров , которые приходится подбирать , чтобы получить максимальное количество действующих астроциклов, имхо, найболее чувствителен To Verfy Use ... cycles. Возможно имело бы смысл автоматизировать перебор вариантов скажем от 1,2 до 5 с заданным шагом , к примеру 0,1(и т.д) для выбора оптимального по максимуму рабочих циклов. Всех благ, спасибо. Сергей
e-Mail: ANKIT
.
Date 03rd 2009f October 2009
e-Mail: Peter
.
Date 06th 2009f October 2009
Sergey
Is there a way I can save natals (in TS) as I did with swings ?
(So that I can manipulate them later )
e-Mail: JimR
.
Date 11th 2009f October 2009
Hi Sergey,
Could you please add the Galactic Center to the list of planets you can choose without having to go to the Extended version? I realize it doesn\'t move much, but if you are looking 100+ years of data, it moves a little.
Also, the Magi Financial Astrology folks are pushing Sedna as an important point now. I\'d like to have easy access to that also.
Thanks!!
e-Mail: lesovikov##yahoo.com
.
Date 27th 2009f October 2009
Сереж, Pattern Recognition, Self Similarity. Back testing - скорость такая , что невозможно остановить промежуточно . Всех благ
e-Mail: JimR
.
Date 29th 2009f October 2009
Hi Sergey,
Can you please add the transneptunians to the Planetary Lines module(new)? Also, I would like to see Chiron in there.
Thanks Sergey!
e-Mail: Admin
.
Date 12th 2009f November 2009
Resultant Direction
e-Mail: Admin
.
Date 12th 2009f November 2009
Resultant Direction
e-Mail: CaptainGabby2@gmail.com
.
Date 12th 2009f November 2009
Working with Spectrum and Composite. Onec after you fine the Cycles in Spectrum, could you build a way to send these cycles to Composite Box, and then let TS fine the best Geo Helio and Phase with the highest correlation criteria and then able to save it in a file and also be able to send it to NN ? Be able to build a projection line?
I think you spoke about this in Lesson 6 or 7. After you fine the best cycle inSpectrum and fine the best Harmionces in Composite.
This would save a lot of time searching for the correct Harmionces.
Thank You,
Capt Randy
e-Mail: Peter
.
Date 14th 2009f November 2009
Sergey
At some point could you add in TS ,the ability to convert daily prices in weekly and monthly automatically ?
Maybe custom also feature of 3 days chart or 15 days chart ?
It is very time consuming when I have to do it through other software and keep on updating .
Thanks
Peter
e-Mail: John
.
Date 18th 2009f November 2009
Pattern Recognition,is it possible to have a average line implemented into the intermarket analysis module? Exactly as is in the Similar Periods Finder Module? Of course you will have to limit the number of entries before the average line becomes available, something like maybe when 5 or less instruments are ticked then the average line is shown, anything above that the average line is not visible?
e-Mail: John
.
Date 18th 2009f November 2009
PR software, is there a way to speed up deleting instruments in Intermarket Analysis Module? I download 60 different instruments at one time, it is very time consuming deleting them one at a time, either need a way to delete everything at once that does not have a tick next to it or a way to speed up single deletion by at least 75-80% faster then it takes at the moment, thanks.
e-Mail: Pier
.
Date 18th 2009f November 2009
if I save a NN ( or a worksheet) where I used planets in Aberration (or Parallax) and I close and re-open TS with normal settings (no Ab no Px) the NN calculations are always made with Ab/Px on, or I must always have in TS these options active?
Thx,
Pier
e-Mail: John
.
Date 19th 2009f November 2009
TS,market profile,when saving as default TS does not save the colour of the background or the colour of the stripes,also TS does not bring market profile back when saved with other work in a TS worksheet, can this be rectified?
e-Mail: Benedict
.
Date 24th 2009f November 2009
but how can one put the statistically relevant events from turning points astro module into a �simple ULE model� ?
e-Mail: CaptainGabby2@gmail.com
.
Date 27th 2009f November 2009
When working with Neural Net. After awhile you can click on \"Signals\".
Comes up
\"Timing Solution Strategy Report\"
On the first line it reads,
\" Profit Profile (initial $100.00)
Could you add a Line under that, that would say, what you based this projection line on?
Like; PRO(1,50,50) or Rel Osc(1,100,100 close)
Thank You
Randy
e-Mail: Peter Tryde
.
Date 01st 2009f December 2009
Under Save Task - Update automatically - Data Feeding
In addition to: \"from file\" and \"esignal\" is it possible to
include \"from Clipboard\" and \"Yahoo\"? Thanks. Peter
e-Mail: Lamonte
.
Date 02nd 2009f December 2009
Hi Sergey,
When I save Astronomy with a \"target for composite\" as Zigzag, than open the worksheet again the \"target for composite\" now appears as Close. If I have several astronomy projections in the worksheet I am unable to tell which astronomy had which target function. I hope this makes sense.
Thanks
Lamonte
e-Mail: John
.
Date 07th 2009f December 2009
Sergey, I am currently trying out forex robots for trading, my problem is that there are 28 currency pairs that I am going to trade, I do not think I would like to get into a situation were the robot places open trades on currency pairs that have very close correlation, due to the fact of heavy drawn down and not to mention if the robot gets the trades wrong then big losses also, so my question is can TS or TR perform some kind of analysis so I am able to test all 28 currencies and come up with the best set portfolio so I am left with a non correlated set of currency to trade? Please explain step by step how this analysis may be performed to achieve the desired result. Or do you think trading 28 pairs is diverse enough and the robot if it is any good will perform anyway? Regards John.
__._,_.___
e-Mail: Pier
.
Date 11th 2009f December 2009
Thx Sergey,
sorry if I return in this argument...
is there a way to see where midpoints are?
Should be difficult in future have in a sine wave a dot (or a little line) where happen 1/3, 1/4, 1/8 divisions of curve... I ask you this because I always seen that when you plot i.e. a Moon declination cycle in intraday chart the 3rds, 4ths, 8ths are good point of reversal/acceleration...
Pier
e-Mail: Robert R
.
Date 14th 2009f December 2009
Tab to save to text or to Excel �Equidistant Planetary Lines Values�?
I.E. yyyymmdd hh:mm Planet Position
e-Mail: Rob R
.
Date 15th 2009f December 2009
Sergey,
One idea that may prove handy is the ability to LOCK chart to either TIME or BAR
(or disable this to the mouse wheel operating this function).
When you scroll the mouse wheel it changes between TIME or BAR.
When using multiple screens/programs you can often lose your intended setting.
Regards Robert
e-Mail:
.
Date 23rd 2009f December 2009
e-Mail: Stephen
.
Date 29th 2009f December 2009
Sergey
Playing with Multi-Search I see I need to use progressed conv to get
what I\'m looking for but the problem is I need applying or separating
under \"Astro techniques\" because 100% of the aspects I tried out on the
Dow all happened to be a separating which I had to find out through
looking up each one.
Can you add an applying/separating drop down to astro techniques please.
Thanks
e-Mail: Sergey Lesovkov
.
Date 29th 2009f December 2009
Приветсвую , Сереж
Пожелание (прям как Деду Морозу ):
нельзя ли как то решить вопрос с регулировкой цветовой гаммы ? на сером фоне не видны цвета блоков (см скрепку)
С наступающим Новым Годом- всех благ тебе и родным :)
И - большое спасибо за картины - в семье очень понравились
Best regards
e-Mail: Peter
.
Date 29th 2009f December 2009
Hello Sergey
The new upgrade is fantastic
I believe though that to take full advantage of it ,the phenomena module should be restructured in a way so that we can have a prebuilt ephemeris in order to avoid crashes and waiting.
I wanted to check helio mercury degrees on an hourly 2 year chart and got a crash .
I am talking about a fast ephemeris for at least the planetary degrees, wich is the most vital in this case ,in order to confirm most of the planetary bars from the new module.
Do you think that it can be done ?
Peter
e-Mail: Peter
.
Date 30th 2009f December 2009
By the way I wantd to ask also:
When I use from Ule for example sum of absolute separation helio 0-180 and then transfer to Srategy so that I can save in .txt the values are different .From 0 to 1 mostly .
Is there a way to convert them back to actual values(from ULE) ?
I know that I can save the actual from document designer ,but when I want to calculate sums in stragy ,the 0-1 numbers are they reliable ??
Suppose I have 1,2,3 harmonic of absolute separation 0-180 in strategy and I sum them but with different weights example .1 for 1h , .25 for 2h , 5. 3h is it reliable ?
Thanks Sergey
e-Mail: Stephen
.
Date 30th 2009f December 2009
Firstly how much memory do you need to load the Natal list you sent me.
I have allocated 2Gb and it still runs out of memory. It loads some of
them but doesn\'t show them and after I calculate it is only showing up
to the B\'s, but some of loaded companies might not fit the criteria.
Secondly I found one company to meet the criteria and showed Geo while
the actual progression was in Helio. Why would this be?
e-Mail: Christian
.
Date 30th 2009f December 2009
hello Sergey
is it possible to have aspects between asteroides also in sideral
e-Mail: Peter
.
Date 30th 2009f December 2009
Hi Sergey
As I have told you I work on sunpots and told of friend of mine ,wich sent me this software for timeseries
http://rapidshare.com/files/328094621/GeneXproTools_4.0.954_Enterprise_Edition.rar
I took a look .Seems interesting as it has capability once found a correlation to export in various language formats c+ vba etc etc
Take a look ,I think it may be useful for you in future upgrades of NN
Have a nice 4 day away ;-)
e-Mail: Stephen
.
Date 31st 2009f December 2009
When you check out the Multi-search can you also check the accuracy of the aspects. I have an aspect 32 Minutes in Zet, 28 Minutes in Solar Fire and its showing up in multi search with criteria of less than 2 Minutes.
Is there anyway I can check this out myself to help you track down any problems?
Also looking forward to the way of getting csv\'s into millenium. Found conversion on Multi-Search to and from SF, Zet but haven\'t figured out CSV. Is the update with the Declin etc out already?
Thanks again for everything
e-Mail: Stephen
.
Date 05th 2010f January 2010
Sergey
To say Multi-Search uses less memory is an understatement. I couldn\'t load past the B\'s before and now it loads within 1 second and calculates the entire list in under 2 minutes.
The details of the aspects for some reason don\'t show anymore however. Is there any chance of the applying separating soon as that is more important that the Para/Contra otherwise I have to look up over 200 Companies in an astrology program to check if its going to happen or already over.
Thanks again for everything and I hope the break, although short, was re-energizing.
Stephen
PS: I\'m looking forward to finding out how to bring my csv list of companies and dates into a .mil file. Actually I should have sent you my dates since you were nice enough to send me yours. I\'ve attached the file which is every listed company in Australia totaling almost 2000 companies.
e-Mail: W Chang
.
Date 08th 2010f January 2010
Now I am trying to upgrade my Timing Solution and have a question and suggestion regarding the pattern recognition module.
The reason you mentioned about intermarket data is that the same price pattern is hard to come by and you need many other market data to find the pattern.
How about giving an option of substituting price with INDICATOR like smooth momentum?
Using detrend and smooth indicators means that you will find a lot more samples with emphasis on timing.
Here is some specific thought.
The user specify the following;
1) the start and end point of sample indicator, not price.
2) correlation levels (low level will find more patterns)
3) include inversion (yes or no)
e-Mail: Pier
.
Date 09th 2010f January 2010
Planetary Lines:
1) isn\'t vertical shift for time? you wrote shift days in horizontal... probably a typo... but I wanna ask is possible to modify the shift in bars, useful in intraday too?
e-Mail: Paul
.
Date 12th 2010f January 2010
Sergey
Is there a way to change to default of the chart layout or customize it. For example so that the houses are equal making it easier to see trines, squares etc.
Thanks
e-Mail: Stephen
.
Date 17th 2010f January 2010
PS: I presume you would still have to write the Dec/Helio Lat for Progression in Advance as well?
e-Mail: Ross Town
.
Date 19th 2010f January 2010
Pls kindly add planetary bars for other planets (other than Moon/Sun) and also add Moon\'s Apogee, Perigee and Equator (Moon at equator) planetary bars. (If possible, pls add other planet\'s Apogee, Perigee and Equator - but I have not used other planets for my trade setup though) I\'ve been using planetary bars for trading in the last 2+ yrs and they are very useful. Thank you very much for adding this feature.
e-Mail: Robert
.
Date 27th 2010f January 2010
Here�s a simple one for the wish list. (I don�t know how to put pictures in the wish list page, so I�ll send it to you).
It would be a good feature if the Horizontal Ephemeris (and Vertical) showed what Zodiac input you created on the Table page.
How does the ticked Point Rx work? I cannot see it anywhere?
Is there a way of saving this picture in higher quality than its current setting?
Can I change the colour of the North Node to something different from Mercury?
I�m still working on �Who Rises First� Sun Moon Mercury Venus?
So here on Ephemeris planet below sun line rises first?
e-Mail: Benedict
.
Date 27th 2010f January 2010
Dear Sergey,
would it be possible to get the \"Strategy\" export date format also as follows:
YYYYMMDD (for CSV), as Wealth-Lab works well with this format, thanks a lot!
Kind regards,
Ben
e-Mail: Benedikt Goette
.
Date 27th 2010f January 2010
Dear Sergey,
would it be possible to get the \"Strategy\" export date format also as follows:
YYYYMMDD (for CSV), as Wealth-Lab works well with this format, thanks a lot!
Kind regards,
Ben
e-Mail: Stephen
.
Date 27th 2010f January 2010
>
> Sergey
>
> Is there a way to move the aspect lines for a LMD file (possibly in
> HYPED) up and down so you can group the +\'s and -\'s together?
>
>
> Thanks
>
> Stephen
e-Mail:
.
Date 10th 2010f February 2010
e-Mail: Stephen
.
Date 18th 2010f February 2010
I was just trying to get the green line on the chart to disappear is there another way to do this?
Also when I add new aspects in an LMD file is there a way to stop the colors from changing on all other lines as it takes a lot of time to redo them into Blue and Red.
e-Mail: Stephen
.
Date 18th 2010f February 2010
Is there a way to take Venus, Jupiter, Neptune and Pluto Natally and the
same again as a Transit and not have the Venus/Venus, Jupiter/Jupiter
aspects appear? This would cut down so many Aspect lines and make it
easier to read a chart diagram page.
e-Mail: Pier
.
Date 19th 2010f February 2010
just a note: when an ULE event is open and is showed apart (below) and not in main chart, price countdown is hidden... maybe is better if you put it in top right of screen!
cheers
e-Mail: Admin
.
Date 19th 2010f February 2010
Inversions
e-Mail: Juan Cruz
.
Date 28th 2010f February 2010
Please put way to invert wavelet waveform after it is calculated.
Also ability to select and deselect results after it is visible on main screen.
e-Mail: John Eleuteri
.
Date 05th 2010f March 2010
Request a auto refresh box for the Turbo Cycles module for intraday trading, so basicaly at the close of the current bar and the start of a new bar it auto refreshes the optimize model on the very bottom on the right hand side, thanks.
e-Mail: Christian
.
Date 09th 2010f March 2010
is it possible in eclipse finder as you have in the left corner the charts button, have the natal astrology eclipse chart , i try to put it on the wish list
e-Mail: Peter
.
Date 09th 2010f March 2010
Can i ask for this:
When we type in towns ,can we get at some point in wich country this town is
example
e-Mail: Ross
.
Date 10th 2010f March 2010
Zigzag dates -> Main Screen
e-Mail: Stephen
.
Date 11th 2010f March 2010
Sergey
Are we any closer to including Chiron in the Midpoints?
Thanks
Stephen
e-Mail: Brent
.
Date 16th 2010f March 2010
A small request about the copy of a trendline or other charting tool... when the copy is made it places the copy right on top of the other one so in order to use it you have to lock one or the other. If when the copy was to came out slightly offset from the original it would be easier to see and utilize ... also I dont know if it is possibe but if there was a feature to right click on the trendline or other tool and a pull-up menu was there to copy the trend line or other tool it would also be more convenient.... Thanks you are the best Brent
e-Mail: drdabbasi@yahoo.com
.
Date 22nd 2010f March 2010
e-Mail: robert rundle
.
Date 24th 2010f March 2010
the ability to send all or multiple selected \'eclipse points \' to chart
e-Mail: lesovikov##yahoo.com
.
Date 06th 2010f April 2010
Сереж, пересчет в TurboCycles очень частый , если ставить галочку RT. Вероятно , лучше иметь возможность вручную задавать интервал времени пересчета. Всех благ . Сергей
e-Mail: Stephen
.
Date 06th 2010f April 2010
Sergey
Why does \"NOT THE SAME PLANET\" not work in Choices of Criteria when it works in \"Events Model Editor\"?
Stephen
e-Mail: Rahul
.
Date 06th 2010f April 2010
Hi Sergey,
Is it possible to plot the vertical Planetary steps lines going backwards - with negative values in the parameters window.
Thanks
Rahul.
e-Mail:
.
Date 25th 2010f April 2010
e-Mail: ayman_sha@yahoo.com
.
Date 25th 2010f April 2010
e-Mail:
.
Date 25th 2010f April 2010
e-Mail: lesovikov##yahoo.com
.
Date 22nd 2010f May 2010
Приветсвую , Сереж. 1. Не знаю в чем причина , но программа в real-time по прежнему часто останавливается при работе с МТ4. Не знаю - может Currency Loader не подает вовремя , может программа не вытягивает . Данные 15 мин длинной 200 000 строк. По несколько раз в день приходится перегружать программу. Останавливается даже при условии , что включены только МТ4 и ТС (не считая антивируса). 2. Очень нужен , имхо, Lauoyt, в котором можно было бы запомнить набор индикаторов , в первую очередь группу турбо , астротурбо со всеми персональными настройками. Возможно - еще Astrocomposite. 3. При сохранении параметров Turbo Cycles иметь возможность сохранять и персональные настройки раздела Optimization. Все это экономит время, которое при частых перезагрузках программы очень существенно. Вообще то конечно - программа лишена оперативности с точки зрения перебора активов во внутридневной работе. Хотя эффект очень сильный. Огромное поле возможностей на глобальных рынках при наличии достаточных данных. Всех благ. Сергей
e-Mail: lesovikov##yahoo.com
.
Date 26th 2010f May 2010
Приветсвую , Сереж.Одна ошибка исправлена , но появилась другая . Блок Astronomy Composite, Kind - Turning Points. В данном случае при in Mundo (EUR 15min) отмечены совершенно не читаемые области. http://s55.radikal.ru/i148/1005/f2/430138d8e4a6.jpg Всех благ. Сергей
e-Mail: lesovikov##yahoo.com
.
Date 29th 2010f May 2010
Приветсвую , Сереж. При включенном real time в Data Feeding, если не ставить галочку Set LBC on last bar, но поставить галочку в Turbo Cycle - RT , то идет пересчет через заданный интервал времени . В этом нет необходимости , ведь LBC не передвигается . То есть желательно оптимизацию при включенной кнопке RT делать только при передвижении LBC . Всех благ. Сергей
e-Mail: John Eleuteri
.
Date 04th 2010f June 2010
Would it be possible to make a extra box in charting tools and call it luner cycles, this is based upon the delta phenomen, it will save from spending $500 just to draw different coloured lines on the chart at specific fixed dates, example there are 4 delta cycles,19 years, 4 years,four lunar months quarter,and every full moon, all that is needed is to have four vertical with dates attached in the order of colour, red,blue,orange,green at the specified intervals, there will need to be four seperate files for the 4 separate timeframes, does not matter at what date you start as long as the colours are in the same order for all timeframes, sort of a eqidestrant lines but with selective color arragment and following the moon\' cycles, thanks.
e-Mail:
.
Date 09th 2010f June 2010
Hi Sergey,
Here is a small request for Planetary Picture Time.
In Fixed Step, in the library (folder icon), can you let user define a set of fixed numbers? For example, 13.2025, 36.3625, 82.2155, etc (in TS format of X deg Y min Z sec) all starting from a one-click start position? This would be more flexible than the current options of monotone ingress.
Also the same applies to simple counters: Calendar day counter, Hours counter, Earth deg counter, planetary angle separation.
Thanks.
e-Mail: Nick
.
Date 09th 2010f June 2010
There are two tools to draw ellipses in TS, one is free ellipse and one is xy ellipse. Would it be possible to please add Harmonics to the xy ellipse? The xy ellipse is the one that you simply click to get the center and then move out
e-Mail: Nick
.
Date 12th 2010f June 2010
Sergey,
In reference to Terra Project, is there any way that when a buy/sell signal is triggered, it could be .txt\'d to my cell phone?
Thanks,
Nick
e-Mail: Peter Palskas
.
Date 14th 2010f June 2010
Sergey Hello
I didnt know whether I should put this in the wish list or not
In the weekly chart,I noticed that it begings from Monday and ends to Monday again
Shouldnt we be looking from the first,second ,thirds ,max forth Bar after Sunday till - 1 ,-2 ,3 max -4 days before the coming Saturday ?
In other words weekdays
Could be a Tuesday starting and ending at Thursday if a holiday is present then .
Would you consider adding that ?
Thanks
Peter
e-Mail:
.
Date 19th 2010f June 2010
Please add to the Wish List option to change color the �Sell Short� and �Cover Short� arrows to aid visual backtesting in TI
e-Mail: Abhay
.
Date 28th 2010f June 2010
Can you plot Turning Point dates or High movement days on graphical ephemeris?
Turning Point dates will be what I generate from Turning Points Analyzer function
e-Mail: kda.toh3@gmail.com
.
Date 13th 2010f July 2010
Hi,
I am not so sure if it is a wish list, but, I was wondering is there a way to know the remaining time of the training. For example, in the training regime it says 47 minutes training. However, after 30 minutes have passed, it still says 47 minutes. Can you have the remaining time as count down time instead of letting sit there as fixed minutes or days etc...?
THanks
e-Mail: Stephen
.
Date 14th 2010f July 2010
TS Calendar:
Firstly is there a way to show where certain aspects occur on the chart like you have done with moon phases or planets in signs?
e-Mail: Stephen
.
Date 14th 2010f July 2010
2) Secondly how can I do midpoints with added objects like Sedna etc?
e-Mail: lesovikov@yahoo.com
.
Date 25th 2010f July 2010
После расчета в нейросети линии проектирования , если я сохраняю Reconstruction close и хочу открыть его в программе в Chart (intraday) - программа не читает файл (csv), видимо не может прочитать формат даты. Хотелось бы иметь такую возможность - наложить реконструируемую цену на текущий график. Всех благ. Сергей
e-Mail: Stephen
.
Date 21st 2010f August 2010
The biggest help at the moment however would be the colors for the ULE components not to change every time I make a change such as delete or add as it\'s costing me hours of time.
e-Mail: Christoph
.
Date 23rd 2010f August 2010
Hello Sergey,
please could you give me a link where you explained how to build a Quantum custom trigger like this:
(TA_SMA(20) > TA_SMA(4)) and (close < close[4]) and (close > close[24])
This condition should trigger a long trade as soon as it changes to true (and quantum applies)
Thanks in advance
Christoph
e-Mail: Stephen
.
Date 24th 2010f August 2010
I have a ULE with 62 lines in it and some have many planets (so I couldn\'t put each one on a separate line). I have Venus, Jupiter, Neptune and Pluto all on one side of an aspect with a 3 degree orb for Venus this is about 3 days but for Pluto it can be weeks. I want to only display the last 3 days of an aspect before it is exact. Is this at all possible as to date I haven\'t been able to think how.
e-Mail: Peter Tryde
.
Date 25th 2010f August 2010
Sergey, In Free Ellipse it is possible to plot upto 20 lines at present. Would it be possible to expand it to, say, 50 lines? Thanks. Peter
e-Mail:
.
Date 30th 2010f August 2010
e-Mail: JimR
.
Date 01st 2010f September 2010
Hi Sergey,
On the Planetary Bar module, the \"bars\" stop at the last price. It would be supremely useful to have a couple Planetary Bars beyond the last price bar to compare with trendlines, Fib\'s, etc. to see when Price and Time might line up in the future.
Love this module! Thanks!
e-Mail: JOHN ELEUTERI
.
Date 03rd 2010f September 2010
Please add SQN feature to NN modules.
e-Mail: Pier
.
Date 04th 2010f September 2010
Sergey,
as you know, when you create a simple model you can choose:
a) don\'t show
b) show apart in subchart
c) show in main chart
Is there a (quick) way to show two simple models (or event) in same subchart ?
If is an option already in, pls let me know, otherwise I\'ll put in WL.
TIA
Pier
e-Mail: Thijs Linssen
.
Date 05th 2010f September 2010
May be you could make some changes to the Planetary Lines Box
I use the Planetary Lines very often and most of the time I have a lot of planetary lines on my chart. The following problem arise then:
-I can\'t see in the planetary lines box which line represents which planet(s) for example: in the planetary lines box I can see only the following information
H6 360-->60x1$. Would it be possible to include the planet(s) that are involved? In this case it would be Ju-Sa H6 Geo.
Kindest regards,
Thijs Linssen
e-Mail: Thijs Linssen
.
Date 06th 2010f September 2010
Planetary Lines Box (follow up)
Is it possible to use the same notation as you use in the Planetary Lines optimizer? That would be great!
Kindest regards,
Thijs Linssen
e-Mail: Thijs Linssen
.
Date 09th 2010f September 2010
Would it be possible to integrate the options of the Planetary Lines analyzer,==> siderial, declination etc. into the module Planetary lines?
Kindest regards,
Thijs Linssen
e-Mail: Al
.
Date 15th 2010f October 2010
Sergey,
Bear and Bull phases are not a bad idea to include with the efficiency test. However, You would probably have to add a third concept such as range bound- where price stays within a band of price. As I remember Supercharts for TradeStation once used ADX, momentum, moving averages and oscillators to determine trend direction.
e-Mail:
.
Date 17th 2010f October 2010
e-Mail: pier
.
Date 27th 2010f October 2010
possibility to allow the last two options in Natural cycles (shift one year...shift n.bars) to put into strategy
I was thinking to create a composite of many natural cycles
Is there a different way to do so? ....natural as it is, without adjustations.
e-Mail: lesovikov@yahoo.com
.
Date 30th 2010f October 2010
Сереж - было бы хорошо , если бы пр установке двух параболиков можно было бы увидеть данные http://s010.radikal.ru/i314/1010/be/43146fe2fb78.gif Всех благ. Сергей
e-Mail: lesovikov@yahoo.com
.
Date 30th 2010f October 2010
В Gann Fans хорошо было бы иметь фиксированные 45 градусов http://s014.radikal.ru/i326/1010/bc/cefe9fdc4816.gif
e-Mail: Eleuteri
.
Date 01st 2010f November 2010
Pattern Recognition module, need the ability for self similarity to scan multiple .wts files at one time rather than just one at a time using different extension of file, also would be good to have a box to enter a minamun return of percentage rate of search so it only finds higher percentage than what the user specifies.
e-Mail: JimR
.
Date 01st 2010f November 2010
Hi Sergey,
I�m putting this in wish list, but wanted to post it here for possible other input. I�m hoping this is a pretty easy addition to the TPA module. I would like to see another button like you have for showing Fib lines, maybe called Gartley? Or 222? It�s a small thing, but would save a lot of time when looking at multiple stocks, etc. I�m finding this technique is really quite good. (as I�m guessing many people do)
As you can see here, I think it�s going to call the top in this latest bull run within a few points. (the 1.27 extension)
When selecting the button, you would see 2 lines on the TPA window, similar to the Fib lines, maybe a different color, a little thicker, that shows the Gartley 222 price target(s). (100% and 127.2%) Like this:
Thanks so much Sergey.
Jim
e-Mail:
.
Date 03rd 2010f November 2010
e-Mail: Peter Tryde
.
Date 04th 2010f November 2010
e-Mail: Peter Tryde
.
Date 04th 2010f November 2010
Sergey, In MultiSearch could you please make a print function for the scan results, many thanks. Peter
e-Mail: Eleuteri
.
Date 07th 2010f November 2010
Update worksheets automatically by using control or shift keys to select.
e-Mail: kda.toh3@gmail.com
.
Date 09th 2010f November 2010
Since the section says \"wish list,\" I am going to wish for a couple of thing. First, I\'ve been trading using MurreyMath as an additional indicator with my eSignal platform and have found out that it is quite useful when use it in conjunction with others, I was wondering will TS consider this indcator in the future since this indicator is not really part of the conventional indicator.
Addtionally, I am an intraday trader, will TS consider rangebars, and also tick bars as addition to regular time interval.
Best regards,
Happy TS Customer
e-Mail: Nicholas D. Savino
.
Date 10th 2010f November 2010
Sergey,
Would it be possible to please make available in Turbo Cycles the ability to see all the peak and valley cycle point times? Because currently there is a only the top 5 or so that are listed.
Thanks,
Nick
e-Mail:
.
Date 12th 2010f November 2010
e-Mail: Abhay Agarwal
.
Date 12th 2010f November 2010
Sergey,
I would request if you can include an option in ULE/Simple ULE to mark the events if there are clusters of events very close in time. So like you can add parameter Number of minimum events: and Max Bars between the events:
So like if I want to say, mark the ULE only if there are atleast 2 or 3 events within 5 or 6 hrs of each other.
I can show an example of how effective it can be in indentifying most of the turning points.
Abhay
e-Mail: JimR
.
Date 13th 2010f November 2010
Hi Sergey,
Can you please add the ability to draw completely straight horizontal and vertical trendlines? Something quick for when you\'re drawing a lot of lines, such as holding the \"shift\" key or the \"CTRL\" key while you drag.
Thank you!
e-Mail: Peter
.
Date 15th 2010f November 2010
3-4 waves primitive in Easy Cycle module
e-Mail: Peter Tryde
.
Date 16th 2010f November 2010
In Phenomena under Planetary Phases could you please differentiate lines to show Moon quarters and New Moon. Would like to show examples in upcoming book. Thanks Peter
e-Mail: lesovikov@yahoo.com
.
Date 04th 2010f December 2010
Сереж , хотелось попросить в Turbocycle в положении Both сделать разный цвет прямой и инверсионной моделей. Всех благ, Сергей
e-Mail: JimR
.
Date 07th 2010f December 2010
Hi Sergey,
Thanks so much for the quick drawing tools button. That is working great. I\'m sorry to seem greedy, but there are 2 more items that I use very often that I think would be very good additions to that list: Calendar days counter and Bars counter.
When you are doing that kind of research, you usually need to do a bunch of them in a row to check different sections of price.
Thanks!
JimR
e-Mail: Steven Zimmerman
.
Date 10th 2010f December 2010
Here is a link to Marcus Rose latest free newsletter.
http://www.rosecast.com/secretofcrash.htm
In it he shows some TNO�s he reports to have significance to the financial market.
I looked to see if they were available to add as extra objects and didn�t find them available.
Would it be straightforward to add them to become available for study?
Shall I add this to the wish list?
Thanks,
e-Mail: Captain Randy
.
Date 16th 2010f December 2010
In HYPED when you build a file, \" Iwish you would add in Save AS
\"Text Common or space Delimited\".
This way we could pull it open it in Excel.
Thank You
Randy
e-Mail: tennismaniaque@gmail.com
.
Date 22nd 2010f December 2010
Please put \"Date Mark\" as frequently use charting tool, i.e. lock this function for repeating usage. Thank you very much!
e-Mail: CaptainGabyy2@gmail.com
.
Date 29th 2010f December 2010
Add Size of Line
At the top, along the Icon list bar, you will see a \"Printer Icon\", to the right of this Icon is a Icon that the user can \"add a chart\" as a overlay.
This is a great to be able to have this over lay.
A big help would be able to have a drop down list box or user input to
make this line \"THICKER (larger) in size\".
e-Mail: JimR
.
Date 08th 2011f January 2011
Hi Sergey,
In the TPA, I would like to be able to see all the retracement level, even smaller than the present limit of about 36%. I would like to see the retracements of 12.5%, 23.6%, 25%, etc. I\'m checking the validity of different theories and need to see any price reactions at the lower levels.
As always, thanks very much!
Jim
e-Mail: Benedikt Goette
.
Date 15th 2011f January 2011
ASTRO COMPOSITE REPORT - TABULAR OUTPOUT INTO FIELDS for easy filtering!
Dear Sergey,
for analyzing and evaluating Astro Composite report results manually, it would be great to get the output into a tabular or csv-delimited format that would split up all the statistical output into the following FIELDS so it could be filtered and easily processed in Excel:
- Category: (Geo Longitude, Helio Longitude, Declination, etc.)
- Research Info: Symbol processed
- Research Info: Time Period analyzed from... to...
- Planet
- Harmonics
- No. of Cycles
- Cycle Period
- Statistical Relevance (Correlation or whatever you can print out)
- Top Predictable Zone Top 1
- Top Predictable Zone Top 2
- Top Predictable Zone Top 3
Maybe this text/numerical output could just be written into a table at the very bottom of each Astro Composite report that one creates?
Thank you for considering!
e-Mail: Benedikt Goette
.
Date 15th 2011f January 2011
ASTRO COMPOSITE REPORT - TABULAR OUTPOUT INTO FIELDS for easy filtering!
sorry, I forgot to mention, the fields mentioned for such a tabular output would need to be grouped into the COLUMNS, not the rows, because otherwise, an efficient processing would be pretty difficult as well.
e-Mail: shane.mcdermott@ntlworld.com
.
Date 21st 2011f January 2011
Allow alphabetical sorting of database of first trade data.
e-Mail: Ulrich
.
Date 02nd 2011f February 2011
e-Mail: lesovikov@yahoo.com
.
Date 11th 2011f February 2011
Приветсвую , Сереж. Мой комп не очень тянет , открываю два приложения программы (графики валют 15 мин). Суть в том , что линии Turbo и Turbo astro не перестраиваю 4-5 часов , корреляция с движением цены если нет нестандартной ситуации достаточная . Поэтому было бы очень хорошо , если линии прогнозирования из Turbo можно было бы прорисовать в блок Strategy с сохранением толщины линии ( в том числе и Deriv из Turbo). Тогда можно было бы выгрузить турбоиндикаторы на этот период . Что позволило бы открыть еще одно приложение за счет высвободившейся памяти . Вопрос второй. Вероятно , есть какие то доработки для Turbo astro, так как линии изменились . Я использую commitee SM1 SM7. SM7 обычно хорошо работает в понедельник , т к SM1 вообще сглаженная за счет выходных. SM 7 , часто более чувствительна и учтывает ньюансы колебаний. Но что то после последних обновлений она уж сильно сглажена и теряет свой визуальный смысл. Хотелось бы иметь возможность возврата к старому варианту. Всех благ . Сергей .
e-Mail: lesovikov@yahoo.com
.
Date 11th 2011f February 2011
Прошу извинить - уже увидел кнопку прорисовки в стратегии :( . Лучше стереть предыдущий пост . Сергей
e-Mail:
.
Date 11th 2011f February 2011
Hello Sergey
Could you at some point add Helio in the between planets in ULE ?
Many thanks
Peter
e-Mail: Peter
.
Date 12th 2011f February 2011
Hello Sergey
Will you activate at some point the asteroids in the multi planetary fan ?
That would be really cool
Peter
e-Mail: JimR
.
Date 13th 2011f February 2011
Hi Sergey,
Can you please make an adjustment on the Turning Point Analyzer Active Zones window so that it doesn\'t stretch out so far into the future and all the useful time periods are \"scrunched up\" into the first inch or 2 on the left side of the graph?
I\'ll send you a screen shot.
I\'m using an 11% zigzag and going 2 swings back, (on the sp500) which looks at the big move from 3/6/09 to 4/23/10. On the Active Zones graph, 2011 through 2013 are all squished to the left. I run into this whenever there is a large swing. We really don\'t need 2020 out to 2030, know what I mean?
Thanks,
Jim
e-Mail: Ulrich
.
Date 14th 2011f February 2011
An automatic update would be nice. Also for the utilities.
e-Mail: Stephen
.
Date 20th 2011f February 2011
Sergey
Is there a way to change the price axis to increments of the users choosing?
Thanks
e-Mail: JimR
.
Date 22nd 2011f February 2011
Hi Sergey,
I would like to look at the results of Spectrum Analyzer for specific time periods out of price history, i.e. Bull vs. Bear periods and/or Sun in certain signs, etc.
Perhaps if we could take the results from a ULE and have Spectrum Analyzer just look at those periods? That seems the easiest. Then how about when an indicator like ADX is greater than a certain amount, take those periods and run them through Spec Anlzr. Essentially, be able to get creative with the input data for Spectrum Analyzer is what I think we�re talking about here.
(This is TTTA stuff - \"seasons\")
Thanks Sergey!
e-Mail: JimR
.
Date 04th 2011f March 2011
Hi Sergey,
It used to be that when you clicked on an object (in this case a Gann square, could be anything) and the handle of the object coincides with the handle of another object, a window would pop up and ask which object you wanted to move. That window doesn�t seem to pop up anymore. So you can�t move one object without the other one getting moved also.
That was a necessary feature I think.
I would like to add another variation to this for your consideration and this has always been an issue when creating objects, sometimes you want to make an exact copy and move the copy into position adjacent or wherever. I know you can do that on the Charting Panel. But when you make the copy, it is exactly on top of and coincident with the first object and it is impossible to move it without moving the original object.
I think it would be most logical if when you deselect an object for viewing with the check in the box, that it is also deselected from moving the object. That way, you can make a copy, deselect one of them and move the copy where you want. Then reselect and you have both objects in view.
Does that make sense?
Thanks!
JimR
e-Mail: pier
.
Date 14th 2011f March 2011
Add in Rare Format program, the possibility to compress dataseries also in quarterly and yearly. Thx Pier
e-Mail: Benedict
.
Date 17th 2011f March 2011
Supermoon
e-Mail: Sanjay
.
Date 18th 2011f March 2011
Hello Sergey:
Hope all is well with you and your family.
I have a strange request that I thought I would send you a separate email about rather than putting it in the wish list.
Is there a way to obfuscate and encrypt the .cmss file used in loading a composite?
Currently when I load a .cmss file from the Composite Box dialog box and \"Open File\" icon, it loads the file, but shows Composite Terms in that Composite Box. I was wondering if I could request you to perhaps approach it as follows:
1. If the .cmss file is \"Not Encrypted\", then display the composite terms. This could be used for \"development\" phase.
2. If it is indeed encrypted, then just load the composite curve, display it on the main screen but DO NOT display the composite terms that are embedded in that file.
The step 2 is almost required if I want to share my .cmss file with someone but do not want them to know my logic.
There are numerous encryption algorithms out there with properly documented APIs that should help you incorporate this sort of security.
It is an unusual request, thus I wanted to approach you with this in a separate email.
I really would appreciate your help here.
Thank You and Best Regards
Sanjay
e-Mail: JimR
.
Date 01st 2011f May 2011
Hello Sergey,
I was wondering if you could let me know if you received my earlier request about the TPA module, I sent almost 2 months ago. If so and it is low on the priority list, that is fine, I just want to make sure it wasn�t missed.
I use the TPA almost every time I look at a stock. I find it to be a fantastic tool for doing Fibonacci work and I show my friends (who I talked into buying TS) tricks with it frequently.
The only difficulty I have with it is the scaling of the active zones window. It is not reasonable. Here is an example of the SPY:
(graphic was emailed)
The SPY is never going to go to 500, let alone 1000+ (anytime soon). Looking at various stocks/indexes, this issue comes up constantly. This particular screenshot, the Fib levels at the left have a little space to work with, but many, many times, the area to the left is scrunched up into a tiny space you can�t differentiate the lines and then the right side is completely worthless.
If this window could just be scaled to be more balanced vs. the actual stock price, this module would be so much more user-friendly.
The histogram scaling goes crazy between these 2 settings: Maybe you could adjust this to settle down a little? One swing leg it�s all jammed over to the left and next swing leg it�s fine.
(graphic was emailed)
The histogram takes analyzing Fib levels to a whole new level of usefulness!
That is my biggest need on this. If you wanted to make this module absolutely perfect, there is one other addition I recommend.
In the ZigZag Statistic window, which is great, there is no documentation that is thorough. There is a lot of good info here.
On the first window, it would be really nice if it was like the other windows when you move the mouse over the histogram, you see a digital display of the value at the bottom. Not a huge thing, but much easier to figure out. Lastly, some values on the Y-axis of this histogram, would be very helpful also.
(graphic was emailed)
This module blows every Fib software away and hardly anyone talks about it except me. I just don�t think they realize. I think it�s because this active zones window is erratic.
Thank you,
JimR
e-Mail: lesovikov@yahoo.com
.
Date 04th 2011f May 2011
Приветсвую , Сереж. В более ранних версиях в блоке Турбо цикла была кнопка - ``сохранить``, которая была удалена в последующих обновлениях. Хотелось бы ее увидеть снова. Чтобы создавать подбор параметров для тестирования по своему усмотрению . В частности , у меня хорошо работает заготовка , в которой параметры индикаторов выставляются по результатам торговой системы на этом индикаторе в Омеге. е сначала тест интрадей в Омеге , и затем полученный параметр вносится в TS. Всех благ , Сергей
e-Mail:
.
Date 09th 2011f May 2011
e-Mail:
.
Date 28th 2011f June 2011
Sergey, I was experimenting with the composite box. I brought 3 items from the Astronomy box to the composite box - one with harmonics of !H, another of 2H and 1/2H. I found that if click the Events to Clipboard button and try to bring all of this into the neural net, that only the item with 1H is copied. Is this right? Does it not make sense to try to bring the others to NN? Or would I need to bring a 1/2H or 2H item in some other way?
Brian Jones
e-Mail: lesovikov@yahoo.com
.
Date 29th 2011f June 2011
Приветсвую, Сереж. Блок бектестиг в Astro Composite. Вероятно интересно было бы включить в набор вариант свободных циклов (блок Astro ->Cycles-> Other...) . PS: статья пишется , еще пару дней , надо один момент осмыслить . Всех благ . Сергей
e-Mail: Ross
.
Date 02nd 2011f July 2011
Hi Sergey,
Please create an option to preset the color of each planet on your Planetary Lines Model.
Thank you very much for your help.
Have a relax and wonderful Canada day!
Ross (I\'m a Canadian too)
e-Mail: Lamonte
.
Date 05th 2011f July 2011
In the Self Similarity program are you planning at some future date, that the model automatically compare all �Compare last (order) bars� to select the one with the highest rating that would then be displayed?
I\'ve recently read an article (2008) �reported the application of genetic programming to financial
forecasting was by Neely et al [16]. They showed that technical rules can be generated by
genetic algorithms to beat the foreign exchange market. Their rules gained excess returns
on major currency exchanges without incurring extra risk. This is significant because the
results suggested that patterns can be found in historical prices and those patterns
appeared to repeat themselves. Moreover, this work gave evidence that genetic
programming can be used to find such patterns.� Page 7
http://www.essex.ac.uk/ccfea/research/workingpapers/2008/tsang-forecasting-ccfea_wp026-08.pdf
e-Mail: Ken
.
Date 06th 2011f July 2011
Hi Sergey,
This is a feature request for the wavelet diagram within the spectrum analyzer:
Can you please add the ability to calculate the wavelet diagram (not activity diagram) using data only up to the LBC? Currently, if our loaded data set is from, say, 1/1/2000 - 1/1/2011, the wavelet diagram will be based on that full data window, regardless of where the LBC is located. E.g., if LBC is located at 1/1/2005, the wavelet diagram currently ignores this fact and calculates based on the entire 2000 - 2011 data set. Can you add the option of only using the data before the LBC to calculate the wavelet diagram -- just like you do for calculating cycles in the spectrum analyzer?
This is really needed for certain types of analysis in order to to avoid future leaks when using the wavelet diagram.
Thanks!!
e-Mail: Jim
.
Date 07th 2011f July 2011
Upcoming events module
One other request I have as long as you will be working on this module. (close-to-close) When you create a report, I think most people will be looking to see the results in a distilled format. Presently, the report has an incredible amount of duplication and makes it very hard to see the distilled results. I don�t need to see all the different dates for the same result.
For example, the report tells me that that JU at 0* Tau gives an 80% UP. I don�t need to see that 13 times. That just makes the report incredibly long. And there is no way to distill it down without an hour of going through it manually in Excel and deleting the redundant lines.
The report would be so much more concise if it was possible to click a setting to consolidate the dates to one line per result, i.e. JU�0*Tau, 80% UP (4 UP/ 1 DN).
e-Mail: Jim Ranum
.
Date 08th 2011f July 2011
Hi Sergey,
Just to explain with some perspective on this. I just went through a report on this for silver, 1967-2011, the report had 5397 lines and it reduced down to just 129 lines without the duplication. And it took me about 40 minutes to do that manually.
When you think about it, we don�t really need the date of these events at all, just the position of planet and the statistic.
Thank you,
e-Mail: lesovikov@yahoo.com
.
Date 09th 2011f July 2011
Приветсвую , Сереж. Пожелание: в Wavelet Diagram было бы неплохо иметь функцию Maxima Skeleton only. Всех благ , Сергей
e-Mail: Al
.
Date 09th 2011f July 2011
Hi Sergey,
My apologies if this is already incorporated into TS, but if not hopefully you will consider it as I usually don\'t ask for items to be included :-)
Is there a way to take the quadrants of the SQ9: upper left, upper right, bottom left, bottom right and see the effect on prices when a planet is travelling in those quadrants?
(See attachment)
ie: Mars is currently 71-72 deg Geo, which would put it in quadrant 3. I want to test when this, or any other planet, is in this quadrant and its effect on price.
Possible?
I would appreciate your input, Sergey.
Regards
Al
e-Mail: Dmitry_summer and winter time for Russia
.
Date 05th 2011f August 2011
Hello, Sergey!
As far as you know any changes from summer time to winter time and from winter time to summer no more exist for Russia since spring 2011. Can you please learn TS to take it into account automatically for all forecasts since October 2011? Thank you.
e-Mail: Bill Meridian
.
Date 06th 2011f August 2011
Can you make the Upcoming Events to work more like the E. Expert? It would be more helpful to superimpose the arrows or a histogram over the prices so that one can see the \'fit.\' Better, it would be useful to be able to run some test to see how well the signals have worked.
Regards
e-Mail: John, Perth.
.
Date 10th 2011f August 2011
Sergey, with the new module (updates) is there the ability to send to nueral net ? If so can nueral net only give the buy and sell signals on the predictable zones, this possible? Regards John, Perth.
e-Mail:
.
Date 10th 2011f August 2011
e-Mail: Ross
.
Date 11th 2011f August 2011
hi Sergey,
In an Astronomy\'s Composite Box with multiple astro cycles, if I select a single astro-cycle, the predictive zone (& non-predictive zone - grey colored line) is not showing on main window. Would you please make the predictive zone be displayed in composite box?
Is the predictive zone only shows on \"Current composite\"? If I\'m wrong, please correct me.
Thank you very much for your help.
Best regards,
Ross
e-Mail: alistair black
.
Date 11th 2011f August 2011
it would be also helpful if you could open each of the current composites with the highlighted areas in separate panels. You can then use the vertical line to make your own judgements on likely tops and bottoms.
Also the ability to highlight using shift key all or selected walk forward cycles to put in the composite box.
A final thought is an UNDO button when you accidentally delete some work or checks.
e-Mail: Ross
.
Date 30th 2011f August 2011
hi Sergey, Please kindly create an \"I\" Inversion button on the main window\'s right panel for the Astronomy Composite (where all the solution results are located). With this button, one can put (test) the Inversion without opening the Astronomy Composite window.
Thank you very much for your help.
Ross
e-Mail:
.
Date 31st 2011f August 2011
e-Mail: Stephan
.
Date 06th 2011f September 2011
There appears to be a 254 character limit on ULE formula\'s when used with Multi-search. Can this be lifted as I need 600 -700 characters minimum?
Thanks again for all of you effort.
e-Mail: tw9gg5rs@shaw.ca
.
Date 09th 2011f September 2011
In a spectrum analyzer would it be possible to also include a wavelet button that only calculates the last 1000 bars (~two days of one minute data) rather than the complete time period of the worksheet that I am using. In this way I can more quickly find the current wavelet pattern while also using other programs that need the full worksheet time range to find their optimal cycles
e-Mail: JimR
.
Date 10th 2011f September 2011
Is there a setting in the ULE that will show �total� or absolute movement of a planet over a period of time? I know you can put �ABS� in the equation in ULE to get the absolute value, but I�m looking to see total movement in degrees, adding the Rx periods as positive degrees traveled. �Total degrees traveled.� (obviously this is GEO)
Couple ideas, adding a toggle button to ULE Step function, although this tool is limited to 360 steps and the technique for this needs to go much larger, many times 360 deg�s. Or add a toggle to Planetary Steps tool for Total movement.
Thank you,
Jim
e-Mail: mailbox618@yahoo.com
.
Date 12th 2011f October 2011
Hi Sergey,
Would you please add the planets Ceres, Chiron, North Node and South Node into the planetary lines calculation?
Thanks,
Edmund
e-Mail: Alistair Black
.
Date 22nd 2011f October 2011
I use Yahoo at present for data. It would save me/others time if one could download multiple stocks, securities data on a daily basis rather than one at a time. Unless this is possible and I have not found it.
Best Wishes,
Alistair
e-Mail: Alistair Black
.
Date 23rd 2011f October 2011
Sergey,
I use Yahoo at present for data. It would save me/others time if one could download multiple stocks, securities data on a daily basis rather than one at a time. Unless this is possible and I have not found it. This may of course be a failing of Yahoo offering free data.
I think it would also help many of us if the number of clicks necessary to load new data could be reduced in some way. I calculate I need to make 18 mouse clicks to update a single chart. I copy pasted these but cannot paste into this internet explorer window. Would it also be helpful to add a facility to add atachments to the wish list box?
Thank you when you have time.
Best Wishes,
Alistair
e-Mail: nepon
.
Date 26th 2011f October 2011
e-Mail: Tay
.
Date 03rd 2011f November 2011
am wondering is there a way to use the saved template and change the
underlying price instrument without having to recreate another one using
the ULEs again. i.e can we aggregate all the ULEs and create a master
wts template ?
I have a template saved for SP500. I will like to use the same template
for DOW and NASDAQ.
Also under the aspect ULE. Can we modify the planet and aspect
relationship after we created the ULE for the template. How about the
ordering of their placement (up and down placing?) can it be easily
modified just using drag and drop ?
When saving the template, sometime when it is out of memory, I will lose
the template and unable to open it again, except to recreate it all over
again. Can create the ability to autosave a backup copy while we work ?
Maybe this sounds like a wish list, if there is no ready answer, just
incorporate them later. Thanks.
e-Mail: Uransi (Fazzy bar simalarity)
.
Date 04th 2011f November 2011
1) Возможность обновлять автоматически по ЛБС
2) Бест лайн + возможность задовать , какую бест лайн аффишировать первую , вторую , третью..... (и задовать ей определ�нный цвет)
2) Возможность проэктировать несколько моделей , комунити \"Средний бар\" ===> (как в симиларити модуле)
3) Алгоритм распознания (ФУЗЗИ)
4) Бактестинг
5) Филтры (как в симиларити модуле)
e-Mail: amt2100@gmail.com
.
Date 18th 2011f November 2011
Hi Sergey,
Please add/allow to change Decanates rulership to the Traditional (Chaldean) rulerships.
If you don\'t have that list, I can send it. It is called the Traditional rulerships in Solar Fire. (I\'m sure you have)
The Modern Rulerships don\'t work.
Thank you,
Jim
e-Mail:
.
Date 20th 2011f November 2011
e-Mail:
.
Date 22nd 2011f November 2011
e-Mail:
.
Date 22nd 2011f November 2011
e-Mail: Alistair
.
Date 30th 2011f November 2011
,
Thank you for your excellent presentation on WCH. I have a few questions. I am sorry if some are obvious or you feel you have covered them sufficiently but it is just to be sure.
Could you please explain what exactly is the difference between the various alternatives short++, long etc etc. If a possible wave (narrow range) shows up in long+ and nothing else but a short wave in short++ shows up but not the long wave does it make sense still to combine them? Should I simply play around until I get the best fit for the previous cycle using all alternatives or is this in some way causing a distortion because I am combining two different time horizons of the analysis?
If no yellow has yet emerged say on a narrow long cycle is it correct still to use it from the start of the red?
When I use the higher levels, medium, highest etc what is this doing and what should I look out for? I see little change.
What is the significance of the grid?
You show an example of a cycle that has died, it droops down covering increasing periods breaking the channel. Presumably when blue starts to show the cycle should be ignored. However if it has simply narrowed it should still be considered if still some red?
I often find that in short++ the tall yellows suggests chaos but they repeat frequently. Nevertheless the cycles if you draw through the yellow or the intense white you get what look like very good short cycles with good fits. Am I being deluded? Should I risk using them?
When fiddling around to get best fit should I aim for the previous cycle low as exactly as possible or the last main cycle high ignoring the previous low even if it fits badly?
Should we still worry about inversions in these models or are they less likely?
Hope these are all useful questions for the group.
Best wishes,
Alistair
__._,_.___
e-Mail: JimR
.
Date 30th 2011f November 2011
Hi Sergey,
Request a small change in the way dates are output from lists, like ULE, to go into Excel. The dates always come out as xx.xx.xxxx and Excel does not recognize them as a date. Can you please make it available to output dates in the xx/xx/xxxx format that Excel recognizes?
Thank you,
Jim
e-Mail:
.
Date 04th 2011f December 2011
e-Mail: lesovikov@yahoo.com
.
Date 16th 2011f December 2011
Приветсвую , Сереж.О блоке Revealing Astronomical Cycles. Все блоки прошли в некотором смысле эволюцию по ускорению работы . Может есть возможность и этот блок ускорить ? И былобы желательно иметь в нем кнопку Default. Спасибо
e-Mail: gabymitt@zahav.net.il
.
Date 04th 2012f January 2012
Hello,
Searching the Atlas, there is no Tel Aviv in Israel.
Thanks
G
e-Mail: Jim
.
Date 04th 2012f January 2012
Hi Sergey,
On the Astrological Techniques module (Astro chart), you can click on a date in the price chart and it jumps to that date. Love that.
You can also select the Dignity tab and see the classical data. How can I change the rulerships on the Decanates to �Lilly�? (Like you did in the Phenomena module)
Thank you,
Jim
e-Mail: Ross
.
Date 06th 2012f January 2012
Hi Sergey,
In Astronomy Composite window, when pressing Strategy --> Current Composite, this interface has Lag Days and \"Backward/Forward\" drop-down list. But pressing Strategy --> Composite Box, this interface does not have \"Lag\" Days and \"Backward/Forward\" drop-down list. Please kindly add the \"Lag\" Days and \"Backward/Forward\" drop-down list option.
Thank you very much !
Ross
e-Mail: Benedikt
.
Date 17th 2012f January 2012
Please kindly add the following date format to the export possibilities from \"Strategies\"
(Save as.... Export to ASCII):
YYYYMMDD
e.g.:
20120117
Thank you in advance,
Best, Ben
e-Mail:
.
Date 22nd 2012f January 2012
Hello Sergey
Is there a way when I have multiple .fnd files with signle events ,to show the \"label\"=\"title\" of all of them when I choose the MArk Events ?
I can see only the events of one L(1,2,...n)
When I apply L1+L2+L3 etc I cant see the ;labels=title
Thank you
Peter
e-Mail: StockTrader
.
Date 24th 2012f January 2012
Would be nice if we could save the results of Multi-Search as a .mil and/or .txt!
e-Mail: Peter Peter Palaskas
Date 24th 2012f January 2012
Hi Serge
Here is one that came to mind
This is an example (havent figured any cycle so..)
BAsically Its the combination of existing modules
Namely :
Planetary equdistant lines
Easy cycle
and Wave (harmonic ,saw ,sines )
So basically be able to start in the main screen a
saw or sine wich is planetary based and then combine the cycles to get the
composite .
The key here is to be able to :
A) Start from where ever one wants (could be date
A for cycles one date b for starting cycle 2 etc)
B) Be able to adjust amplitudes or phase manually
in the main screen
and last but not least
As the easy cycle has a TREND line ,that too so
that one can be more free from adjusting amplitudes
And of course a corelation with cycles composite
and price behavior (close I believe is only needed here.Not indicators)
So the example below :
has one cycle with 60 degrees (blue)
and the red is 12 degrees(saturn helio )
So add the two together
You may say that that already exist in NN ,or easy
cycle etc but having it in front of you I believe makes the difference
Plus I believe this is the dream of very cycle
hunter wich spends countless of hours with excel or with paper-pencil
Peter
e-Mail: Bill
.
Date 30th 2012f January 2012
Sergey,
Can ULE module calculate the \"straight line distance\" between planets?
I see in the ULE module under: Angle Diff/Orbit : \"Distance Between Planets\"....
I use this option & the box below it labels it as \"Angle between Merc & Ven
trans GEO\".
Probably on a relative basis the longitudinal angle difference & straight-line
distance are qualitatively similar....But on a hunch, I wanted to test the
straight-line distance idea.
Thanks
Bill
e-Mail: JohnNY
.
Date 31st 2012f January 2012
Having Multi Black Box module for stocks rating would be of great benefit.
e-Mail:
.
Date 08th 2012f February 2012
e-Mail:
.
Date 06th 2012f March 2012
e-Mail:
.
Date 17th 2012f March 2012
e-Mail: Ulrich Weber
.
Date 21st 2012f March 2012
T17 module: I suggest an option to restrict the variation of values to a certain range. The randomize button creates completely new values but for a defined script sometimes the chosen values should not vary to much. For one or all lines. It would allow to use the Composite module for defining scripts.
For example: I define a range of +-5 degress to that for \'Mercury Sell\' the new value should ly within 21.0Vir to 1.0Lib.
Sell when Mercury Helio passes 26.0Vir
Close when Mercury Helio passes 22.0Sco
e-Mail: Chris B.
.
Date 09th 2012f April 2012
We would like to have natal planets precision to be in seconds (currently is in minutes), First Trade Date - Natal Wheel toolbar icons.
e-Mail: Stephen Rayn.
.
Date 10th 2012f April 2012
Option for ordering results-astro events in aggregated TS Calendar\'s cells (days) by time would be most useful.
e-Mail: JimR
.
Date 10th 2012f April 2012
Hi Sergey,
On the Simple ULE, there is a button for Excel, to take the data points to Excel, but it does not work. I then have to create a calendar file, open calendar, create a txt file, open Excel and convert the data from a text file to Excel and end up with a text file I have to go back and delete.
It would be so much easier to just click the Excel button and have it go straight to Excel. I use this regularly to sort data points and do research. It adds a lot of wasted time.
Thank you for all your help,
Jim
e-Mail: 4dmitry
.
Date 13th 2012f April 2012
Sergey,
It would be nice if you add Chiron and Ceres for 64-bit version of Terra Incognita...
Thank you.
Dmitry
e-Mail: Stephen R.
.
Date 21st 2012f April 2012
Is it possible to get start/end time of Moon VOC in ULE and/or Phenomena, seeing them as an events in TS Calendar?
e-Mail: Stephen R.
.
Date 21st 2012f April 2012
Is it possible to get start/end time of Moon VOC in ULE and/or Phenomena, seeing them as an events in TS Calendar?
e-Mail: Stephen R.
.
Date 21st 2012f April 2012
We would like to have an option for changing colours of transit/natal events respectively in TS Calendar.
e-Mail: JimRanum
.
Date 26th 2012f April 2012
Hi Sergey,
I would like a modification to the Price Chart Slice module, that would allow you drag not only the price, but markings made to the price from that prior time. For example the ULE lines or simply drawn lines.
This way, in addition to the price from a prior time, you can line up events from that prior time and price. Example: Full moons, etc.
Also, maybe think of a way to make it a little easier to grab price from many years ago and move it forward, but still have the precision to place it on a specific day, maybe a window for the date you want to place it. This would make it much quicker and more accurate.
Thank you!
Jim
e-Mail: Gabriella Mittelman
.
Date 13th 2012f May 2012
Hello Sergey
Can u pls. add names to Planetary lines? It is possible to use icons too,
since so many lines are drawn, it is difficult to remember which colour is which.
If we had the M-Nep- for inst. on th eline it would make it easier.
Thanks
Have a good day.
13 May 2012
e-Mail: Ross
.
Date 17th 2012f May 2012
Hi Sergey,
Sorry to bother you but if you are fixing bugs in the Planetary Line module, would you pleaes add a feature that user can pre-set the color of each planet. Hence, it would not need to select a color each time for each planet line.
Thank you very much for your help!!!
Ross
e-Mail: Ross
.
Date 20th 2012f May 2012
Hi Sergey,
Regarding Semenko Diagram Module, please add Save & Open buttons to save/open previous planetary setups.
Thank you very much !
Ross
e-Mail: lesovikov@yahoo.com
.
Date 29th 2012f May 2012
Блок Astro Expert System . Расчет идет долго - очень удобна была бы кнопка Паузы . Спасибо
e-Mail: Abramson
.
Date 27th 2012f June 2012
there is no /Europe/Serbia (Yug) in Atlas database files
e-Mail: Tay Boon Chong
.
Date 01st 2012f July 2012
Hi Sergey,
The ULE window, can it be left at separate instead of formula. Every time, after saving as a wts when reopening, it reverts back to formula and I have to one by one change them all back to separate. Suggestion to leave it as last saved selection.
e-Mail: Peter Tryde
.
Date 10th 2012f July 2012
Sergey, am still trying to improve performance of T17. Will it be possible to add Ceres, Pallas, Juno, Vesta, Eclipse, Prs Fortune, EP and Vx? Many thanks. Peter
e-Mail: Peter S.
.
Date 16th 2012f July 2012
Might be a great advantage to have Cycloscop (outer planets Transit, inner planets Secondary progression) in Astrological Prediction Techniques. Thanks!
e-Mail: Zoltan
.
Date 17th 2012f July 2012
Dear Sergey,
I was playing around with the tool called Astrological Prediction Technics.
1)As I was clicking on the \"One tick ahead\" button I got this error message. It happens regardless what time frame I use or how many bars are loaded.(here I got 10k bars of 5Min EURUSD).
2) Using the Natal version , the blue lines of Mc and As do not have a \"marker like\" the planets (yellow bullet and blue or red line). As a result is difficult to match their position can add please?
3) I would find very useful if one could custom set up the \"tick size\" I would add this to my wish list
4)Finally: Using the normal (not natal) wheel the \"markers\" of transiting planets has got red color (the lines trough the yellow bullets), but when natal wheel is on, the red coloured lines are used for natal position and blue ones for transiting plantes. Would be more consequent to use same colour let\'s say blue for transiting planets regardless if natal is on or not and red for natal-
Thnx.
Regards,
Zoltan
e-Mail: Peter Tryde
.
Date 30th 2012f July 2012
In Easy Cycle can there be a function to invert the projection line? Not urgent, but it would be nice to have. Many thanks, Peter
e-Mail: Jim Ranum
.
Date 11th 2012f August 2012
Hi Sergey,
In the Easy Cycle module, I\'d like to be able to type in specific length cycles and start point/date.
This way we can see Hurst style cycles and the composite cycle.
Thanks!
e-Mail:
.
Date 26th 2012f August 2012
e-Mail:
.
Date 29th 2012f August 2012
e-Mail:
.
Date 20th 2012f September 2012
e-Mail: amt2100@gmail.com
.
Date 18th 2012f October 2012
Hi Sergey, Can you please add the nodes (NN and SN) to the ULE tab for Terms/Decanates/Faces? You have them in the Phenomena module, but not the planets available in the ULE module for Decanates.
Thank you!
Jim
e-Mail:
.
Date 09th 2012f December 2012
e-Mail:
.
Date 09th 2012f December 2012
e-Mail: Sopheareak In
.
Date 14th 2012f December 2012
Hi,
Can you please add Fibonacci Grid, Fibonacci Spiral, Star of David, Gann with Arcs, Gann Square 9 with selection of Pivot Price and/or Time, Square of 9 price and time, Gann Beck\'s emblem, Gann Grid and Flower of Life.
Thanks,
Sopheareak
e-Mail: Jim Ranum
.
Date 20th 2012f December 2012
Hi Sergey,
Sorry to bring up a sore subject, getting data into Excel. The button on the Simple ULE for Excel now goes to the Calendar and then the Calendar can go to Excel. Can\'t we skip that step please?
Here is my major request: Many, many times when doing research, I create a list of events/dates and then want to put them into Excel, but then I have to struggle to get the positions of the planets on those dates into Excel along side the dates.
Example: I create a list of dates for Sun/Venus Inferior conjunctions with ULE aspects. Then I have to go through multiple steps to get the dates into Excel (mentioned above). Then, because I need to see the positions in the zodiac of where those conjunctions occurred, I have to create an ephemeris, get that into Excel, then do a VLOOKUP from the one Excel file to the other, just to get the positions.
This is a huge time consuming process that I have to repeat over and over and it comes up almost any time it is necessary to investigate a phenomenon.
Any help you can provide will be extremely helpful and greatly appreciated.
Best,
Jim
e-Mail: Jim Ranum
.
Date 22nd 2012f December 2012
On the old Efficiency Test module, before the upgrade a few months ago, you could see the highest probability trade (days before/after) and then you could see the highest %gain trades (days before/after).
I can see on the upgraded module the highest probability trades, but I don�t see the highest gain trades. Is that info on there somewhere?
Also, the old module used to remember your last settings for days before and after, Window Tick. Is there a way to change your default screen on this?
Thank you Sergey.
e-Mail: Jim Ranum
.
Date 22nd 2012f December 2012
I am updating the Easy Cycle class that I did with the new Precise cycle button you added. But it is giving unexpected results. For example, in the class I had an 18 year cycle to start, so when I entered an 18 year cycle with the Precise button, it came out with a much higher frequency sine wave. I had to use 216 years for the period in order to get an 18 year cycle period. So I think it needs an adjustment.
It appears the �years� dropdown is calibrated in months. Which I think a �months� option would be nice, but we need years too.
e-Mail: Alon Avramson
.
Date 31st 2013f December 2012
Concerning the Astrological Technic Module:
1. The price range showed in the module should be in the range of the price on the screen plus %10-%30. x360 range is too high.
2. The lines are colored and this is great. It would be even easier to see what planet created the line if the glyph will be attached to the line.
3. The resistance lines are more interesting when the aspect appears (active).
It will be great if it will be possible to show on the screen all the aspected lines in the whole visibile period but only to the lenght they are active in the ORB.
4. There should be an option to mark several interesting points to stay on the screen. For example if I want to use more than one technic, there should be a way to mark several points in one technice and then switch to another technical and compare.
e-Mail: William Johnson
.
Date 13th 2013f January 2013
In the \"AstrologicalPrediction Techniques\" module(the astro wheel),
I\'d like the ability to open two astro wheels and put different dates in each.
Now I can open a second wheel, by clicking again on the icon, but the dates are sycronized (the same) between the two windows.
Thanks,
Bill
e-Mail: Robert Rundle
.
Date 01st 2013f March 2013
Sergey, could you please consider incorporating *.Harmonics files into
1) Planetary Equidistant Lines
2) Advanced Support & Resistance Lines
3) Planetary Lines {experimental theory only, but may finally resolve this this phenomena to something usable/valid}
at some time in the future? If so, I�d be happy to write up any supporting documentation/instructions/examples.
e-Mail: Robert Rundle
.
Date 01st 2013f March 2013
would it make sense to be able to
�Save or/ BackUp {and Restore from saved file} personal TS files to a separate drive/source�?
IE File/Backup User Settings or Restore User Settings and Files. Good for the occasional PC meltdowns.
Include user files in Directories C:/Timing Solutions and �Work�, �Dyn�, �Templates� and �Fundamentals� folders
e-Mail: Brad Davis
.
Date 06th 2013f March 2013
Hello Sergey �
I wonder if you might be able to add a small feature similar to the candlestick bars you show to plot price values.
There is a candlestick method, called Heiken-Ashi, that looks rather interesting. This method averages out the regular candlestick bars and can help visualize the trend. The math behind these types of candlesticks is very simple and I believe this would be a wonderful addition to your program.
Click here for link to article about Heiken-Ashi Indicators.
Thank you for considering this option. Your work is amazing.
As you may realize, I�m rather reluctant to use the forum. Many wonderful comments are given there. I would rather keep my little questions from public view.
--- thank you for all of your time and hard work,
--- Brad
e-Mail: lesovikov@yahoo.com
.
Date 08th 2013f March 2013
Wavelet Cycle Hunter. Было бы правильней иметь возможность дифференцированно настраивать гармоники . Вот пример (ES_Globex 1min): http://ic.pics.livejournal.com/lesovikov/10134098/21301/21301_original.jpg Относительно низкочастотные циклы имеют гармонику 2 , а вот высокочастотные циклы - 1ю гармонику. Спасибо
e-Mail:
.
Date 18th 2013f March 2013
e-Mail: soficoo@yahoo.com
.
Date 27th 2013f March 2013
e-Mail: lesovikov@yahoo.com
.
Date 29th 2013f March 2013
Кнопка Data: лчень удобно было бы иметь возможность кроме даты/времени вдоль линии вводить текст . Так как природа даты может быть различной
Спасибо
e-Mail: Zoltan Gal
.
Date 13th 2013f April 2013
Hi Sergey,
Just a small request:
1)Can you add a feature to let the users to select several items by a window (Right mouse click) or by Shift+mouse click or Ctrl+mouse click.
2)If you could make to work \"Delete\" button from the keyboard with same effect as the \"-\" button..
Both feature would be useful in : Composit Box, Harmonic Box, Easy Cycle, where list may appear.
Thnx.
Regards,
Zoltan
e-Mail: Bill Johnson
.
Date 15th 2013f April 2013
In COMPOSITE Box optimization...I used to use a feature : \"Delete unchecked items\".
I wish it were put back.
Thanks
Bill
e-Mail: Stefano
.
Date 15th 2013f April 2013
Dial chart with 0-900 scale
e-Mail: Al Bidinger
.
Date 15th 2013f April 2013
Sergey,
The late David Elliott used a very narrow Bollinger Band to determine market breakouts (and continued trends). He called it Mobo breakouts (breakdowns). I highly recommend you have a look at his material as it provides a good basis for algorithm development.
Best,
Al
Sent from my iPad
e-Mail: Charles
.
Date 15th 2013f April 2013
Sergey
Another possibility for a breakout system using Bollinger bands is to use an alternative to the normal SMA or EMA as the centre line.
Here is a version I use based on Bollinger bands centred on Ehlers Instant Trend indicator. The BBs are much smoother than ordinary BBs and price breakouts above or below 2 SD of Instant Trend are quite clear. (Colouring on bars is based on Linda Rashke�s Volatility and trend indicator so I am monitoring two volatility and trend indicators).
Regards
Charles
cid:image001.png@01CE3A8E.F3A95150
e-Mail: lesovikov@yahoo.com
.
Date 18th 2013f April 2013
Было бы хорошо иметь возможность закреплять надписи относительно положения на экране .
А то со временем строчки принимают неприглядный вид : http://ic.pics.livejournal.com/lesovikov/10134098/46047/46047_original.jpg Спасибо
e-Mail: Dheeraj Kumbhat
.
Date 22nd 2013f April 2013
Hi Sergery Sir, Pranaam
In composite Cycle Module,
in AutoSelection feature, in report and selction window -
1. there may be placed the Helio Lat, Siderial and Right Asc Zodiac,
2. In Composite Sum Window, in right side where the selected composite list appears, there should be a command for removing the unchecked composites in single click, like it was in previous versions..del unchecked..
the above two requests are very easy for you to resolve, So pls help whenever you have time for it and review the composite module..
Regards
Dheeraj
e-Mail: Ross
.
Date 02nd 2013f May 2013
Hi Sergey,
Re: Astrological Prediction Technique module
(1) Astrological Prediction Technique module settings does not get saved on worksheet. If not possible, is it possible to have an option to save the settings so that users can recall the settings?
(2) Price Projection module within the Astrological Prediction Technique module is not running in real-time automatically. Please kindly add an option to run it in real-time.
(3) Please add an option to show mirror price, just like your planetary module.
(4) Please add an option to select color for each planet in this module(or globally in Timing Solution) so that user can quickly recognize a planetary line or object anywhere in Timing Solution or you set a standard for each planet so that user follow your setting to recognize any planetary line or object in Timing Solution
Other Minor issues:
(1)On Main Window, the \"Mark Event\" and \"Font\" size checkboxes does not get saved in worksheet.
(2)Please provide instruction on changing the ULE window to black background. Sorry to bother you but I\'m getting old and the white and bright background is hurting my eyes. I can change the Solution window background but I cannot find the option for ULE page.
Thank you very much for your help and teachings !!!!!!!
Best regards,
Ross
e-Mail: s_stefanoni@libero.it
.
Date 14th 2013f May 2013
Hi Sergey,
is it possible to add the information value also on equidistant lines like planetary equidistant line?
is it possible to add a combo or other switch on equidistant lines option to select a \"time\" or \"bar\" and therefore use on the same chart both together without switch from time to bar chart type or viceversa?
thank you for your work.
Regards
e-Mail: Ulrich Weber (uaweber@yahoo.de)
.
Date 20th 2013f May 2013
Easy Expert Modul of TI
It should be possible to modify the listed events using the results of the effiency test.
It means after finding the best dates for entry and exit like (buy -3 and sell +4) it should be possible to use them. The parameters are called LAG and duration in the calendar.
These 2 parameters should also be shown togehter in corresponding windows of the Easy Expert and the calendar.
e-Mail: John Perth
.
Date 29th 2013f May 2013
Have a idea for wish list people, I have entered it but would like to know what people think of the idea who are using this module?
My own personal experience has been it needed something extra, back testing for me never came up with any definite or really
confident figures to trade real time, so I have been thinking about what can be added to maybe improve it, then I thought many times
people say history repeats itself but not exactly, I believe this is what the module is for so below is my idea,
Self Similarity Module
To Input a extra box to tick or un tick (choice), to a enter a amount in percentage terms that the similarity is allowed to search for similar patterns by a certain variance amount,
Example if I enter 10 into the percentage box it will search for all historical patterns that fit the selected criteria but will allow a 10% expanded movement or be flexible by 10% of the chosen price movement, this feature would make the back testing part of the module more accurate to find best fitting criteria as well as real time I think.
Regards John Perth.
e-Mail: Gerald
.
Date 29th 2013f May 2013
Hi Jim and Sergey
Maybe its not the tools but the background that can be looked at?
For example, if we had the ability to manually set the price and time scale, then you wouldn\'t have the problem with any of the shapes being distorted every time you scroll the screen.
At the moment, when you use the charting panel and set scale to manually defined, the scale you see on the screen varies every time you scroll. So it may solve Jim\'s problem if we had another option \"Manually Defined Fixed\" so that the user then always sees the same fixed scale when they scroll the main screen.
If this is an easy thing to include, then I also would like to see it included since it would save me having to use another program to explore all the sacred geometries ;-)
Best wishes
Gerald
e-Mail: Zoltan Gal
.
Date 31st 2013f May 2013
Hi Sergey,
Just to make more productive TS, I recommend the following feature in Key Chart Similarities:
1) have the possibility to enter the chart dates by mouse click from the chart.
2) possibility to save the list of chart dates added by the user
Thnx.
e-Mail: Jim Ranum
.
Date 15th 2013f June 2013
Hi Sergey,
On the Easy Expert, when you export to clipboard and paste into Excel, it does not include the \"effect\", percentage and number Up/Down, that you see on the results tab.
The clipboard button on the results tab does not work to copy into Excel. I would like to see the same results from the Results tab, copy into Excel, like the Model tab does.
Thank you!
e-Mail: Erhan EKER
.
Date 22nd 2013f June 2013
Astronomy Module removed from TI. So no chance for us to use \"variable filter\" on Astronomy Modules>>Active Zones.. It would be great if variable filter can be added on Astronomy module on right panel of the TS
e-Mail: Peter Tryde
.
Date 24th 2013f June 2013
Hi Sergey Re T17 present range under Astro Script is from Sun to Asc/MC. Would you kindly expand the range to include all the dwarf planets and other objects upto VX as in \"Angle between\" in Composite Expert in MarketTrader. It might help improve the performance of T17, thanks. Peter
e-Mail: lesovikov@yahoo.com
.
Date 04th 2013f July 2013
Просьба . Вынести кнопку Bars Counter на правую кнопку мышки . Спасибо
e-Mail: Edmund Tsang
.
Date 08th 2013f July 2013
Hi Sergey,
Since I download intraday data from my futures trading account, can you consider to add one more intraday data format as per attachment?
Year, Month,Day,Hour,Minute,Open,High,Low,Close,Volume (in csv data format)
Thank you very much,
Edmund Tsang
e-Mail: Ross
.
Date 09th 2013f July 2013
Hi Sergey,
Please add a \"Into Strategy\" button on the Natural Cycle Module.
Thank you very much for your teachings.
Best regards,
Ross
e-Mail: jaworski@tpg.com.au
.
Date 16th 2013f August 2013
Hi Sergey
DECIMAL POINTS FOR MANUAL SCALE LIMITED TO 2 POINTS - PLEASE INCREASE
Could you please increase the number of decimal points that a user may enter when setting the scale manually. At present, the user can only enter up tp 2 decimal points and yet when the angle is displayed (in the precision box) we see 14 decimal places. So could you please increase it to whatever is convenient to you eg 4, 6, 8 whatever. The reason is that I\'m trying to get precision on lines going for extended periods but the decimal limitation does not allow this.
Many thanks
Gerald
e-Mail: Gabriella Mittelman
.
Date 19th 2013f August 2013
HI
PLs. rebuild the Fibo ellips
Pls. add astro glimpses to the Planetary lines
Pls. improve the good/bad aspects forecast
e-Mail: Оксана
.
Date 01st 2013f September 2013
Здравствуйте! Огромное спасибо за программу. Только, нельзя ли сделать русскоязычную версию? Это так неудобно , т.к. английский знают далеко не все.
e-Mail: Gabriella
.
Date 10th 2013f September 2013
Fibonacci arc
e-Mail: Next Day Indicator (Chaos Theory)
.
Date 11th 2013f September 2013
Hi Sergey,
We were introduced with an another useful tool by you on September 10. Thank you that you let us to share your vision with such tools. As a lazy amateur trader when I first saw that tool I just dreamed a reporting button on that module. Imagine instead of manually check every indicator statistics a trader pushes a button and a report created with given parameters. I dream at weekends scan weekly charts by this way to determine upcoming week trading ideas.
May be more luxury but beyond this TS can help traders to scan markets for possible trade setups if TS scan several saved market studies in different files and create next day forecasts for every indicator in the list.
Best regards
Erhan EKER
e-Mail: Yuri Shramenko
.
Date 20th 2013f September 2013
Add Momentum Divergence arrows to MACD Histogram. As shown in my YouTube video \"The Best Technical Indicator\". The idea is to place arrows on the price chart when the indicator is plotted - this can be an Advanced Tool selection, its that powerful.
The basic formula is when price makes a new high, starts to turn - and the MACD Histogram has not made a new high. The opposite for when prices are going down.
yurips@verizon.net
e-Mail: Erhan EKER
.
Date 20th 2013f September 2013
I saw in a forum that somebody is using 2pips 1 degree conversion rate to convert planetary longitude to price in EUR/USD Market.. In TS i think a small change in Planetary Lines enable us to do this...
What we need is; Under Planetary Lines -> Lines -> \"H\" Harmonic option near \"Scale\" Combo Box should have decimal values like 1/2 or 1/3 harmonics...
e-Mail: Ronald Stewart
.
Date 04th 2013f October 2013
I would like to see and export to excel the arabic parts by house, sign, and nakshatra. for example given a date and time cast a chart, then see where the parts are. example
part 1,6,8 in house 3, 49,61 nakshaktrahouse 10 or nakshatra 20. be able to see the parts on the natal wheel but also output to a file that can be input into excel for multiple days for reseach to see if a astro event favors a particular part.
e-Mail: Bill Johnson
.
Date 24th 2013f October 2013
In Planetary Lines, I would like automatic labels added, similar to how it is in the Horizontal Ephemeris.
e-Mail: Bill Johnson
.
Date 04th 2013f November 2013
In the SIMILARITY Module, it would be useful to be able to send to \"strategy\" either a single line or the averaged committee line.
It\'s use would be to:
1)Assemble many SIMILARITY predictions onto one graph
2) Save older predictions to see how they turned out.
Bill Johnson
e-Mail: Sanjay Sardana
.
Date 06th 2013f November 2013
2. Also, I would like your suggestion - Is there a way to \"Scale\" the composite to the same price level as the close. The close on my pic is in Green. I think the composite effect would be more pronounced if it can be caliberated to match the price level... For example, if at the start of the day, the composite level is 1.76556, and the S&P Level displayed on the chart is 1734.25, then the composite should be attached to that scale and displayed...
e-Mail:
.
Date 10th 2013f November 2013
e-Mail: William Johnson
.
Date 08th 2013f December 2013
About the PARALLEL LINES charting tool...
I\'m trying to create vertical timing or cycle lines, that extend forward & backward in time, from some base-time distance of two pivots.
For the 1st point, I click on one pivot, then I extent the line vertical for the 2nd click, then for the 3rd click, I move horizontally to the other pivot.
For some reason, creating a vertical line with the first 2 clicks will not create the desired timing lines, forward/backward in time.
If I create the vertical line on a slight angle off vertical, it does work. But, then the timing lines are slanted....not what I want.
Can you do anything about this....or is there an alternate way to create \"timing lines\".
Bill
e-Mail: Dheeraj R Kumbhat
.
Date 11th 2013f December 2013
Hello Sir, Pranaam, I am facing a small problem again with the model maker for Astrology experiments.. We know that Declination, Geo Latitude and Helio Lat are in very limited angular distance normally, So in FAM section, pls make the Button for them as there are for Geo, Helio, Phase Longitude with Apply-Separate. Also there should be a tab for range of angles...As in the Aspects Tab, I hope, you got my point..
Suppose, I want to make a table for Declination of Uranus-Saturn Angle, and it is going to be 18 degree from 6 degree in next 3 years or so...these motions are slow so I am using the 15 Minute steps...Now this single combination will make more than 1200 lines.. while only 60 lines are useful there....I suppose, it will not be problematic for you.
Regards
Dheeraj
e-Mail: Jim Ranum
.
Date 04th 2014f January 2014
Hi Sergey,
Can you please add a decennial (10 yr) filter to the Self-Similarity module?
The decennial pattern comes up again and again in Gann material and is supposedly the basis of Gann\'s Mass Pressure Chart technique.
Thank you.
e-Mail: Jim Ranum
.
Date 04th 2014f January 2014
Sorry, after doing more research on the Decennial pattern, I think it would be good to also add the 4 year Presidential cycle also, to the Self-Similarity module.
Please add the 4 year and 10 year filters to the Self-Similarity module.
Thank you again for all you do for us Sergey.
Jim
e-Mail:
.
Date 07th 2014f January 2014
e-Mail:
.
Date 13th 2014f January 2014
e-Mail: Kirtan Raut, kbr9121965@yahoo.com
.
Date 25th 2014f January 2014
Hi Sergey.
For the Trend Line option in the left vertical panel...
I need to define Trend Line as
parameters(Start Date; Time and Price)
e.g. 24/06/2012 9:15 4665.00
and
parameters (End date Time and Price)
e.g. 24/01/2013 9:15 5000.00
This will be helpful to draw Gann Angles
eg( points/day ; points/any timeframe under consideration.)
Thanks ...
Kind Regards
Kirtan
e-Mail: Gabriella Mittelman
.
Date 05th 2014f February 2014
Hello Sergey,
I have been doing some work on declinations. I cannot find Helio declinations.
Is it possible to include it in the Ephemeris? or in Semenco ?
I wish to see how indices behaved under different Helio declinations-one by one- and not as a composit picture.
Thanks
Gabriella
e-Mail: Gabriella Mittelman
.
Date 05th 2014f February 2014
Sergey,
I have found the helio declination in Ephemeris...
how can I make an efficiency test in the ULE for that?
thanks
G
e-Mail: 70626@qq.com
.
Date 12th 2014f February 2014
Support eSignal version 11.
e-Mail: Jim Ranum
.
Date 12th 2014f February 2014
Hi Sergey,
I\'d like to request a new feature be added to the similarity module that shows similar price movement by direction and scaled to the similar percentage moves.
Here is an article to what I\'m referring to:
http://seekingalpha.com/article/2013041-about-that-scary-1929-graph?source=email_macro_view_mar_out_4_6&ifp=0
It illustrates the large difference that scaling the chart to same percentage changes shows, vs. same scale.
Very interesting.
Thank you!
e-Mail:
.
Date 13th 2014f February 2014
e-Mail: JOHN PERTH
.
Date 20th 2014f February 2014
To be able to save the Zig Zag Similarity module as a worksheet so it returns as the same as it was saved, also ability to change the thickness of all the colour lines under the View header, at the moment can only change the thickness of the View Similarity ZigZag Line.
e-Mail: John Perth
.
Date 02nd 2014f April 2014
Request to have Perth Western Australia as a option exchange for time zones when clicking on the globe icon.
e-Mail: Gabriella Mittelman
.
Date 09th 2014f April 2014
Hello Sergey,
I wish there was a possibility to see the calendar days in the same square as the price.
I shall send you an example.
Thank you
G
e-Mail:
.
Date 19th 2014f April 2014
e-Mail: Jim Ranum
.
Date 04th 2014f May 2014
In the Turning Point Analyzer, could you include an analysis of the different size turns (that require you to manually move the slider button) and an output of the statistics of the ratios shown in the histogram, with the actual numbers that can be output to Excel?
You can see that adjusting the size of zigzag percentage makes huge changes in the histogram output, giving big differences in the most common size turns. 5% turns favor specific ratios, while 9% turns favor other ratios, etc.
It would be supremely useful and save dozens of man-hours of work to have the program run through say 20 to 25 different percentage points and give an output of the most common ratios of turns. The program already does this, there\'s just no output of it all at once.
I think this would be a fantastic selling feature to non-Astro customers.
You can see what the most expected ratios would be immediately for the different size turns for any index or stock.
Thanks Sergey.
e-Mail: Jim Ranum
.
Date 05th 2014f May 2014
Hi Sergey,
In Turning Point Analyzer, can you please increase the size of the analyzed zigzags to 50%?
This is the accepted Gann pullback number and would expand the usability of this module to Intraday.
e-Mail: Jim
.
Date 06th 2014f May 2014
Hi Sergey,
One more request on the Turning Point Analyzer.
Can you please include in the Statistics the percentage of the moves?
So for example on the Dates/Statistic Table that has Date, points of the move and Top or Bottom, if you could include the percent change also. It would need to be correctly anchored to the price at the bottom for a Top and vice versa.
These percentages are useful.
e-Mail: Sergey
.
Date 08th 2014f May 2014
Asc,MC in RA
e-Mail:
.
Date 21st 2014f July 2014
e-Mail: emad eng.emad82@gmail.com
.
Date 08th 2014f August 2014
i hope to put the name of each planet beside palentay lines
thanks
e-Mail:
.
Date 10th 2014f August 2014
e-Mail: emad
.
Date 17th 2014f August 2014
hi sergey
can u add swing chart to timing solution
e-Mail: eng.emad82@gmail.com
.
Date 27th 2014f September 2014
hi
plz for palentary fan for forex pair
how can i set the fan to 5 point per degree it is not available in the version
thanks
e-Mail: Dheeraj
.
Date 01st 2014f October 2014
Excel button in strategy
e-Mail:
.
Date 02nd 2014f October 2014
e-Mail: Dheeraj
.
Date 05th 2014f October 2014
Is there possible to send the output of Simple Model to Strategy?
e-Mail: Dheeraj R Kumbhat
.
Date 06th 2014f October 2014
Pls add the HCL/3 in fields of price oscillator Indicator.
e-Mail: Jim Ranum
.
Date 12th 2014f October 2014
I request a drawing tool be added to the precise charting tool to draw perfect circles.
Here is a video link to Michael Jenkins talking about it. He selects 3 points, in this case, 3 \"lows\" that define the circle.
He has written a couple books (as you know) and this particular technique has been one of his most prominent and successful.
https://www.youtube.com/watch?v=a6eoz7teIVs#t=881
It may be that this doesn\'t have to be in the Precise Charting tool, but since you have been working on that, maybe it would be easier or make more sense there?
Thank you Sergey!
e-Mail: Jim Ranum
.
Date 18th 2014f October 2014
Hi Sergey,
Sorry to ask another Wish. I fully appreciate your workload. I hope this is an easy one.
On the Turning Point Analyzer, when you move the cursor on the histogram it displays the price and the ratio. Could you please add the percentage move that position would be from the top or bottom being analyzed?
This info is very useful when deciding which ratio looks most probable. The combination of the ratio and the full percentage move that would be recognized when the next turn comes should have some harmony. (not the percentage between the current turn, but the overall price move)
Thank you,
Jim
e-Mail: emad eng.emad82@gmail.com
.
Date 25th 2014f October 2014
hi friend
plz i already bought rimig solution primo vesrion
but i need this plug in to my version without standrd version how much the price for this plug in
thanks
e-Mail: emad eng.emad82@gmail.com
.
Date 30th 2014f October 2014
hi surgey
what is the meaning of (-) and (/) in palentary lines in the software
thanks
e-Mail: Jim Ranum
.
Date 15th 2014f November 2014
Hi Sergey,
I think the Horizontal Ephemeris is one of the most visually powerful modules in the program. And I am just now after all these years discovering it. I saw it before, but did not recognize how amazing it is.
I have just one (hopefully) small request: Please add Lunar Eclipses to the Edit Model list. Only Solar Eclipses are in there presently. My research suggests that Lunar Eclipses are just as important as the Solar Eclipse.
Thank you very much!
Jim
e-Mail: Abhay
.
Date 19th 2014f November 2014
Hi Sergey,
In Composite module optimization, when I choose optimize on Profit then why does it also do genetic selection of events. It should be optimizing for profit only the events I have selected in my composite box, this is how it used to behave in older versions. If I want Genetic + Profit then I will choose other option.
Abhay
e-Mail: Ramil
.
Date 28th 2014f November 2014
Мы тут с Максиковым переписываемся, он увлекся модулем т17. Возникли мысли кое-какие. Ты не планируешь случайно к т17 подключить язык ULE, чтобы задавать более сложные случаи на сигналы покупки и продажи?
И еще один момент - когда я читаю на форумах описание различных стратегий, то часто встречаются стратегии, где ждешь не одного сигнала на покупку, а пучок сигналов - три-четыре, и только тогда нужно покупать. Нельзя ли в Т17 реализовать то же самое? Например, есть обычный сигнал на покупку, а есть большой сигнал на покупку. Что такое большой сигнал? Это когда некоторое количество обычных сигналов на покупку (указываешь их количество) случается в течение некоторого количества дней (указываешь количество дней). Например, когда есть четыре обычных сигнала на покупку в течение 5 дней - то это большой сигнал на покупку.
Ну в общем, как-то так )) Если удастся реализовать это в т17 - было бы здорово.
e-Mail: Hashim Aih
.
Date 05th 2014f December 2014
Greetings,,
Would this work with markets which data isn\'t available through yahoo?
I\'m trading the Saudi Stock exchange and can only import. Metastock type of data...
Also, sectors aren\'t readily categorized in the metastock file so some sorting / grouping are required on my end... would it be possible to have this in feature updates?
e-Mail: Jim Ranum
.
Date 06th 2015f March 2015
Hi Sergey,
Can you please adjust the output of Easy Expert into Tab delimited file?
When you select Calendar and it creates the simple ULE, it shows the statistic: percentage and number up/down, but in the Tab delimited file, it just shows \"Lag\".
So using the file in Excel doesn\'t give you any info on if price goes up or down, when it starts and ends, etc. Can\'t really use the output in a spreadsheet at all.
Thank you.
Jim
e-Mail:
.
Date 21st 2015f March 2015
e-Mail: Jim Ranum
.
Date 21st 2015f March 2015
Hi Sergey,
Can you please add Declin.Long. to the drop down list in ULE? I would like to analyze formulas between Long. and Declin. Long. and there is no way to do it.
Thank you.
Jim
e-Mail:
.
Date 22nd 2015f March 2015
e-Mail: Test1
.
Date 15th 2015f June 2015
e-Mail: Test1
.
Date 15th 2015f June 2015
Test17
e-Mail: Martin Biber
.
Date 15th 2015f June 2015
Hi Sergey,
As the wishlist did not work I'd like to give feedback this way.
After your explanations to my questions almost everything is clear!
These are some question or probably more kind of request.
1. During this test today I had the impression that as "X Mb used"
got to over 1200 MB the download process got some problems. (I'm working
with 64bit)
it freezes. While downloading it suddenly stops and nothing happens
anymore.
2 Default butten would be nice that I could exclude lunar cycles (I
know I set it to no draw, but it probably is still calculated)
3. An automatic change of the minimum sample size and chi would be
nice. It would be ok for me if we were just informed that this measures
had to be adjusted after the program calculated everything.
4. As I always calculate "Find the best strategies" it would be nice
if we could have a setting were we define if it is immediately processed
after the download or If we want to choose later.
5. Would a library make sense for all the results? What I mean is I
ran all industries today. Why not saving just the information I have on
the main screen (so not saving the whole tool). We could the open a
chart and plot this result below it.
6. Let's take Biotechnology:
First question: Did you test what
the minimum percentage is that we need for good trades?
Second question: As the next interesting time frame is coming (25.6.
to 1.7.) I'd like to see the best stocks. What we see right now is the
result of the stock for each calendar year. I would be interested in a
view which shows (ups/down years, so for example 7 up/ 3 down)
(average/min/max profit in % ) and that we could sort this list. For
example I'd like to see which of those 50 stocks have 10 ups. (I know
that you wrote an article how to pick stocks but I think we can go a
step further and make it easier). If there is a ratio which says how
high the correlation between the first four natural cycles are that
would be interesting too.
Third question: would it be possible to choose the 10 best stocks
(manually or with an algorithm) and then calculate the same as we did
for the whole index but the 10 results would be plottet below each other
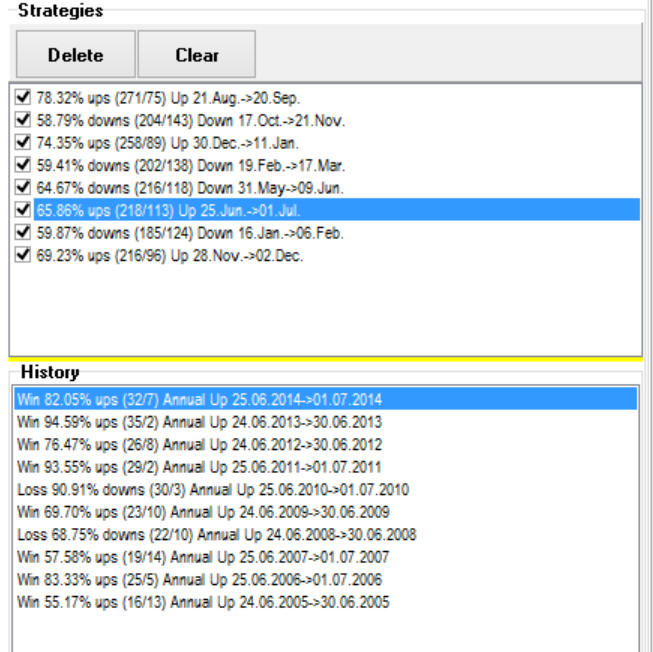
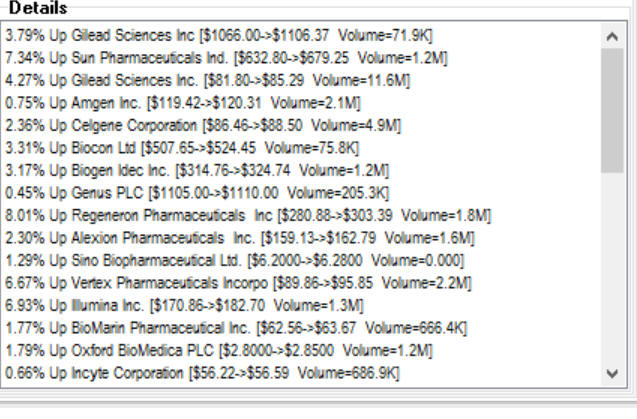
7. I would love to see that we had a first window where we could
choose which industries we want to analyse. If we could choose Drug
Delivery, Auto Part, Asset manager and then hit a button run, we could
run an analysis over lunch or night. Right now we need a lot of clicks.
I hope my feedback helps.
Kind regards,
Martin
e-Mail: Brian Jones
.
Date 19th 2015f June 2015
In the Astronomy module > Miscellaneous > in the Zodiacs box, would it be possible to add all the zodiacs in the module here such as Right Ascension and Helio Latitude ?
e-Mail: macapolo
.
Date 28th 2015f June 2015
It would be great to have "in mundo" zodiac in ULE again!
e-Mail: Zoltan Gal
.
Date 18th 2015f August 2015
Hello Sergey,
A small request regarding the "Rare Format Convertor" utility: Would be nice if you could add a "Batch" feature. Would be useful, if one would like to covert all the files contained in a folder into a specific timeframe (all Daily or Weekly etc). The name of the new files could the same as the source file , extended with a tag, let's say a _1H _4H _D or _W or _MN etc. depending on the timeframe to which was converted.
Thnx in advance.
Regards,
Zoltan
e-Mail: Jim Ranum
.
Date 27th 2015f August 2015
Hi Sergey,
Would very much appreciate expanding the Similarity Module to include additional Filter options: be able to specify in the days, weeks, months, years options a specific number. Also add the individual planets, as well as synodic cycles.
Very important in business is the JU/SA synodic.
Thank you for the awesome tool!
e-Mail: AApers
.
Date 23rd 2015f September 2015
Indicator as histogram
e-Mail: Paul Harrington
.
Date 24th 2015f September 2015
Hi Sergey, in the Multi-search module, is it possible to just export the results window to excel? I would be interested in just exporting the company name and score. For example, American Express-AXP 10, etc, for the entire results list. I see there is an option for Millennium charts, not sure how to use that, just wondering if a simple export to excel is possible.
As far as Millennium Star Trax software, is that just a precursor to Timing Solution? Does it offer additional capabilities that TS does not?
Thanks Sergey,
Paul Harrington
e-Mail: Peter Tryde
.
Date 29th 2015f September 2015
The 'save into text file' in Multi-search module is very useful. Would be nice if the same function could be available in MT StarTrax, BlackBox Natal Charts Rating, thanks.
e-Mail: Iulian Marian Boca
.
Date 01st 2015f October 2015
Hi Sergey,
Exist a possibility to have a logaritmic scale for price? If not, please take this in consideration for future.
Thank you
I
e-Mail: Jim Ranum
.
Date 01st 2015f October 2015
Hi Sergey,
This request is a modification of a prior request to add the location of the planet when you export to Excel from ULE. Currently, you only get the dates of the events, but most frequently, you need the value also. While performing another ULE for planet speed, I have the same difficulty. I need the value at the date, i.e. Max, Min, etc.
This has been a difficulty for many years, that I have had to create an ephemeris and do a reverse lookup to get the value at the dates. I am seeing this should probably be a standard output from the ULE to have the dates and the values.
Thank you.
Jim
e-Mail:
.
Date 09th 2015f October 2015
e-Mail: macapolo@live.com
.
Date 12th 2015f October 2015
Please Sergey, could you consider option for adding harmonics choice in ULE/Edit/Planetary Patterns "H=", as it is available in Aspect and Midpoints?
e-Mail:
.
Date 12th 2015f October 2015
e-Mail: natal
.
Date 26th 2015f October 2015
e-Mail:
.
Date 28th 2015f October 2015
e-Mail: yanyun
.
Date 01st 2015f November 2015
e-Mail: Bill
.
Date 02nd 2015f November 2015
Could it be possible to include azimuth and altitude values of planets/stars for searching in ULE?
Thanks!
e-Mail: Jim Ranum
.
Date 04th 2015f November 2015
Hi Sergey,
A request for the Scanner:
Selecting the days of the month you want to place trades is very tedious when you are a Swing Trader. I am looking for trades for the next month and having to go through and double click every day of the month is a pain. Can you put a Select All button on there please? (Monday-Friday of course)
Thank you,
Jim
e-Mail: raya_perintis@yahoo.com
.
Date 08th 2015f November 2015
may i get the demo TS sofware?
e-Mail: Jim Ranum
.
Date 23rd 2015f November 2015
Hi Sergey,
On the Similarity module, can you please add a button to sort the results by date? Currently, it only comes up in order of the R value.
When there is a long list, it would be very helpful to be able to look at them in chronological order, as an option, also.
Ultimately, if you ever have time to work on this module to fine tune it, it would be most helpful to have a filter on top of the the filter. For example, if I filter by Sun conjunct JU, be able to further refine it as only the conjunctions in Earth signs, or when JU is retrograde, etc. Even just overlaying the existing Custom Filter could be helpful.
The Sort ability is probably the easiest to do for now? That would be great.
Thank you very much.
e-Mail: Jim Ranum
.
Date 25th 2015f November 2015
Followup on my prior request on Similarity Module.
It would be extremely helpful if the ULE in the Similarity module could do the L1*L2 function. You can set it to find specific points in time, like the Efficiency Test module. The difference is the similarity module is finding the periods where price acted the same, and you can visually verify the validity of the your L1*L2 theory.
It would also be extremely helpful to have a button to flip the similar price history inverted. By flipping the similar price history, you can see if an inversion occurred going past LBC. The module only sees price prior to LBC, which of course what we want, but I need to see if price continued to follow after LBC. I know you have the Inverted similarity lines, and that is good, but that is finding similarity in the prior period of x bars. I am finding some good results, but it looks like price inverted. If the button was there to flip it, I could verify it visually.
The last item would be the chronological sort.
Thank you!
e-Mail: Roger Wolf
.
Date 28th 2015f November 2015
Make the settings for the indicator lines sticky. For instance, I like most of my lines "3" in width and have certain colors for each. Similar for the date line, I like it black, with a font of 20. But once I close TS (or that particular study) those settings are lost and I have to make multiple clicks every time. Having a user defined default setting would be nice.
e-Mail:
.
Date 30th 2015f November 2015
e-Mail: William Johnson
.
Date 06th 2015f December 2015
Sergey,
In the "Natural cycles", I like the convenience of the shifted chart option.
I use it for 2 main purposes....
1) Looking at analog years.
2) A fast way to see "Calendar Day Counts". For example, I want to see 118 CD counts off all CITs. It's easier to just look at a chart shifted 118 CDs.
Presently, "Natural Cycles", can do one single shifted chart.
My request....is to have a "shifted chart" module, where I can do many shifted charts simultaneously.
Thanks.
Best Regards,
Bill Johnson
mycousinvinny38@hotmail.com
e-Mail: Jim Ranum
.
Date 15th 2015f December 2015
Hi Sergey,
Thank you for your help in making additions per our requests here. It is amazing and I understand that. I am sorry to ask again for something, but it keeps coming up in my research over and over and it is not only very time consuming, it takes the computer so much resources that it bogs down, even though I have 32 GB ram.
And when this is implemented into the ULE output, it will take very little resources on the computer.
When you output the results from ULE to a file or Excel (what I use), in addition to the dates of the events, I really need the zodiacal degree of the event. (culminations)
Ex. Merc. conjunct Mars, we get the dates. I also need the degree of the zodiac that the conjunction happened. I look at large time periods for patterns and without the degree, I have to construct very large ephemeris files every time, setup differently for the research and vlookup function. It takes a very long time and the files are huge.
I'm sorry to ask again.
e-Mail: Jim Ranum
.
Date 15th 2015f December 2015
Quick feedback on Degree of event with ULE added to Calendar. Of course it�s way better than not having it! But if/when you make adjustments to this, the export to Excel always has some problems.
Since it goes in as a csv/text file, you have to import with the text to columns function. The columns get screwed up because you have to use a �space� delimiter and that separates the zodiac sign from the degrees. I can fix it with less work than what I had to do before, but the more elegant fix would be if the ephemeris output could be switched to an integer number, i.e. 136.25 vs. 16*15� Leo.
This also makes the sorting, matching and cycle calculations much easier in Excel. Very hard to find matching dates from deg/min/sec and sign vs. a number. Excel doesn�t play very well with that kind of data.
This is a great tool.
Thanks!
e-Mail:
.
Date 03rd 2015f January 2016
Здравтсвуйте , Сергей .
В первых вариантах программы у вас был модуль построения абстрактной планеты . Можно ли вернуть этот модуль ?
e-Mail: Thierry
.
Date 05th 2016f January 2016
Hello Sergey,
I like using the Fibonacci drawing tool.
If I am not mistaken, you can define with it only one default configuration. I think that it could be useful to have at least 2 standard configurations. Why ? Because, when I am using this tool, I like to draw octaves as well as standard Fibonacci levels and having both of them as a standard would be very nice.
In addition, I think that having the length of the considered period would also be great: this way your starting point could be the length and not the remarquable points ( peaks/troughs). As an example, I like to look for standard periods of 168, 192 days/units and of course for their subdivisions. It is possible today combining 2 tools. It would be better using one integrated tool.
So, please consider this as a wish list idea.
Thanks and regards
Thierry
e-Mail: Lorrie
.
Date 08th 2016f January 2016
I have found the percentage charting tool but is it possible to get a "counter" of price just as you have pixels? I do alot of quick measures of the chart and being able to do price that way would be good. Or am I missing the price measure tool?
Thank you,
Lorrie
e-Mail: Ahmed Farghaly
.
Date 12th 2016f January 2016
Kindly incorporate LBC into the wavelet algorithm.
Thanks
e-Mail: afarghaly9@gmail.com
.
Date 15th 2016f January 2016
I think it will be a good idea to incorperate a "cycle alert" in the program to detect the presence of cycles that are currently in their third period. My research led me to conclude that the highest correlations obtained on dominant cycles are the third, fourth, fifth and sometimes sixth period. After that the cycle loses strength and correlation is reduced. I was able to find a method to obtain 0.30 correlation on average for 500 days. This is not enough for me, I have to determine probabilistically the likelihood of survival of a cycle to make use of the best of it (3rd, 4th and 5th periods). The cycle alert will be of good use to alert us of the potential arrival of a new dominant cycle.
Regards,
Ahmed
e-Mail: lesovikov@yahoo.com
.
Date 19th 2016f January 2016
Приветсвую , Сереж .
Хотелось бы иметь возможность при сохранении модели Turbo Cycles сохранять и параметры Optimization . В частности : First cycles , Overtones
Либо кнопкой Default
Спасибо
e-Mail: Ahmed Farghaly
.
Date 22nd 2016f January 2016
Elliott wave tools: Can be added very simply (The numbers and letters with the snap feature, along with TP ratios)
FLD based on dominant cycles close to the nominal model of Hurst: This can aid the analyst and trader to when and where prices will reverse. With the option of being constructed based on the average length of the cycle chosen over a given number of cycles.
Regards,
Ahmed
e-Mail: Lorrie Bennett
.
Date 23rd 2016f January 2016
Morning Sergey,
I would like to be able to download the Values which are used to draw the Aries to Pisces line in the Astronomy Composite window. Not those for each date (which I can already get) but those which correlate to the degrees of the zodiac for the composite. I know that I can get the values for each individual day for the cycle lines but those values are inclusive of rx motions which after removing them results in a line that is too smooth.
Is this already possible and I am not finding the button or is it possible to do?
Lorrie
e-Mail: Jim Ranum
.
Date 24th 2016f January 2016
Not sure where the best place to add this feature, but per my emails describing this, perhaps associated with the Spectrum Analyzer would be best, but the calculations are part of the Astronomy Composite module.
Would like the program to run through all the cycle lengths, similar to the Spectrum Analyzer and highlight the cycle lengths (like a histogram or a list) that produce the best/highest Equity curve or return on $100, etc.
It would be optimum to be able to adjust the x% cycles used or All Bars, like the Astro Composite or in the Spectrum.
Thank you Sergey!
e-Mail: Ahmed Farghaly
.
Date 25th 2016f January 2016
I figured out a way of taking individual cycles and creating a composite via strategy module. Can you please add a correlation coeficient of the strategy line after LBC?
Regards,
Ahmed
e-Mail: Joel Kreger
.
Date 07th 2016f February 2016
e-Mail: Joel Kreger
.
Date 07th 2016f February 2016
Here are some interface improvement I would like to see.
In Easy Cycles I would like it to work with intraday data. Currently nothing is plotted in the main window on my system. It could be a problem on just my system.
In Easy Cycles I would like that inverting one cycle does not put check check marks in the unchecked boxes. I would prefer that the program let me decide when I want a cycle activated.
In Easy Cycles I would like a derivative curve.
I would like a second derivative curve to see if it has predictive value in some circumstances. I think it might when a market is moving very fast.
In Turbo Cycles I would like the ability to shift individual cycles left and right.
In Turbo Cycles I would like the ability to be able to invert individual cycles which can be done with the change above but a flip would be faster.
In Wavelet Cycle Hunter I would like a derivative curve. This could be my top wish.
I would like the derivative curve to be independently invert-able.
In the main screen view window the one that allows turning indicators on and off I would like the ability to edit the indicator values rather than having to delete and re-add the indicator.
In the same window I would like the ability to change indicator positions on the screen.
e-Mail: Joel Kreger
.
Date 07th 2016f February 2016
My mention that the Easy Cycle does not work for intraday is not true.
On the other hand here is a little interface problem with Easy Cycles:
When displayed in the main window the price curve is squashed but when the
"Separate Panel" button is pressed on the side and the Easy Cycles curve is moved to its own window, the price curve remains squashed and therefore harder to read. It should return to normal vertical height.
e-Mail: Peter Tryde
.
Date 12th 2016f February 2016
Hello Sergey, Thank you for all your work with the latest upgrade to Quantum Figures, think it can become a great additional tool to help trade the markets. In order to utilize the win/loss result will it be possible to export it to Composite buy/sell module for instance, then we can use that module to project the future buy/sell signals? Also, there are 2 settings now: All history and Last bars. Could you kindly add one more: Last 300 price bars. Thanks. Peter
e-Mail: Thierry
.
Date 13th 2016f February 2016
Dear Sergey,
You have added an efficiency test to the Planetary equidistant Lines, which is simply wonderful.
If possible, please change the name of the resulting graphic and include the name of the planet(s) plus the angle.
Thanks in advance
Thierry
e-Mail: Ahmed Farghaly
.
Date 18th 2016f February 2016
Hello Sergey, I hope this message finds you well! First I would like to report a bug. The harmonic division in easy cycle only works on a daily chart, it does not work on a weekly or monthly. Can you please make possible in easy cycles to take into account the principle of variation of a cycle. When conducting hurst analysis not every 9 year cycle low is exactly 9 years. If you can make us set the cycle length and select the lows then compute the average length a hurst analyst really can't ask for anything more than that. Perhaps maybe FLDS in easy cycles will help as well. An FLD is an acronym for Future Line of Demarcation. It is basically a 1 period SMA based on the midpoint shifted forward in time by the FLD number (FLD number = cycle period/2 + 1). If you are able to incorperate theses into the program I would be extremely grateful.
Regards,
Ahmed
e-Mail: Grant Carroll
.
Date 20th 2016f February 2016
In the main window view I would like to see an option to increase/decrease the wicks or shadows of candlesticks.
Thank You for the consideration.
Grant Carroll
e-Mail:
.
Date 27th 2016f February 2016
e-Mail: Jim Ranum
.
Date 28th 2016f February 2016
Hi Sergey,
Could you please consider making the Fibonacci drawing tool have 2 default settings?
The reason is it's very cumbersome and time consuming to keep going back and forth between standard Fib ratios and many times needing to look at Murray Math setups or ratios that are specifically different from one index/market to another.
2 different defaults would be a wonderful time saver.
Thank you.
e-Mail: Jim Ranum
.
Date 28th 2016f February 2016
Hi Sergey,
In light of the recent interest in the Similarity module, which I use every day, perhaps you would consider showing a correlation number for the Similar line to price, after LBC, like you have for the ULE.
When doing backtesting and researching, setting the LBC at various points and being able to see the forward looking correlation would be very helpful, especially for sorting.
Thank you again.
e-Mail: afarghaly9@gmail.com
.
Date 10th 2016f March 2016
Just reminding you of the easy cycles request.
Regards,
Ahmed Farghaly
e-Mail: afarghaly9@gmail.com
.
Date 10th 2016f March 2016
Just reminding you of the easy cycles request.
Regards,
Ahmed Farghaly
e-Mail: John Perth
.
Date 14th 2016f March 2016
Need the ability if possible to save the Best Planetary Picture Module as a worksheet, as it works now it can be saved in seperate file but not as total worksheet to be recovered, I have to redo all the calculations over again for nearly 15 charts everyday.
e-Mail: Ahmed Farghaly
.
Date 21st 2016f March 2016
Kindly add the feature in easy cycles of multiple lows of a particular cycle and have the program compute the average cycle length and draw the cycle on the chart. This is the proper way to do hurst phasing analysis. The harmonically related cycles can be calculated based on the first selection and the projection line drawn. Look how accurate the projection line on the AUDUSD is based on hurst cycles in the following picture.
http://postimg.org/image/fk3adrx1t/
Also if you can add the option of manually selecting the last low of each of the selected cycles to project the average length into the future to know when to expect the next nest of lows of the harmonically related cycles. Also if you can add and subtract the difference from the average of the longest cycle and shortest cycle in the sample of lows selected to give us a time range of when to expect the low. This can be done via text and does not have to alter the perfect sinus waves that are present in the module.
Also kindly incorperate FLDs, which I have explained in a previous request, in the module and the ability to draw trendlines on the chart.
Regards,
Ahmed Farghaly
e-Mail: Ahmed Farghaly
.
Date 21st 2016f March 2016
Ability to extract only one cycle from the composite module into fundamentals. The reason why I want to do this is because I use cycles of slightly different lengths to form a superposition in ULE. I want the cycle that is over not to influence the superposition any more.
Regards,
Ahmed Farghaly
e-Mail: aaapers@verizon.net
.
Date 23rd 2016f March 2016
The ability to remove items from the wish list that I have previously posted.
e-Mail: john_krall@yahoo.com
.
Date 28th 2016f March 2016
I would like to test and process some of your TS solution outputs with other quant tools that we are using.
Would it be possible to create a button that would save ALL the data series that are displayed in a chart (also the forward-looking projection lines, etc.) into an Excel or CSV file with the following data columns:
Date � Time �O�H�L�C�V� Indicator 1� Ind 2� etc. etc. �Indicator n�
It would be great to have the names of the indicators chosen in the chart (in the name / color boxes for each model loaded, for example) as column names for such an export.
Also, it would be great to be able to define the export directory and the filename for the export.
Date export format should be compatible with excel processing, e.g. YYYYMMDD, and time should be a separate column in any case.
Thank you for considering.
e-Mail: Ahmed Farghaly
.
Date 29th 2016f March 2016
I requested that the custom astronomy composites saved into fundamentals to saved only one cycle. I create superpositions based on cycles of similar length but not identical. I do not want the superposition to be influenced by the cycles that finish. This is the last and final thing I need to provide my service. I am thankful to all your efforts.
Regards,
Ahmed
e-Mail: Thierry
.
Date 29th 2016f March 2016
Dear Sergey,
I have 2 wishes:
- Planetary equidistant lines: today we can put the planet names and the angles. I think that it would be quite useful to have at the other end of the line the date and time,
- Fibonacci: I would like the possibility to store several patterns on the different tabs (for instance 1 classic Fibonacci pattern and one octave pattern)
Thank you in advance
Thierry
e-Mail: Joel Kreger
.
Date 11th 2016f April 2016
In the new Q-Spectrum module:
1. I would like an inversion option because often the projections are accurate but inverted just like in other cycle projection modules.
2. When using the optimization feature I sometimes feel that the original projection is preferable. However, there is no way to restore the original projection. The only way to get it back is to run the program again which takes a non-trivial amount of time.
In the Price Data Information box:
1. cntrl-W shortcut does not work.
2. None of the Digit Signal Processing lines show up in the Price Data Information box so if looking for crossovers, the numerical comparison is not available.
In Digit Signal Processing:
1.The lines on the screen don't end in a last value number as do the normal indicators.
2. When using the "Invisible After LBC" button, the Digit Signal Processing lines are not blanked so the future is not hidden. This interferes with the attempt to practice trading using these indicators.
3. None of the Digit Signal Processing lines show up in the Price Data Information box so if looking for crossovers, the numerical comparison is not available.
e-Mail: Ahmed Farghaly
.
Date 15th 2016f April 2016
Easy cycles? Have you been working on it? Please do if not already
Thanks
Ahmed
e-Mail: Sergey
.
Date 15th 2016f April 2016
IP 99.229.137.119
Testing website
e-Mail: Roger Wolf
.
Date 16th 2016f April 2016
IP 132.147.73.82
When saving chart, the default is the char name. i.e. IBM
e-Mail: Thierry Sompairac
.
Date 23rd 2016f April 2016
IP 86.247.74.86
A very simple change would be welcome: to put the date of the latest TS update on the internet installation page.
Best regards
Thierry
e-Mail:
.
Date 25th 2016f April 2016
IP 41.47.93.81
Sergey, you still haven't updated easy cycles module. I am patiently waiting for it. I would also like the ability to evenly lenghten or shorten a a cycle projection line. For example if I make a composite of a 17 month astronony composite of a cycle. I want the ability to make it 20 months, I.E. expand it evenly or do the same to shorten it. I would also appreciate if one can obtain a numerical value for amplitude in order to form projections of prices. Please view the topic 'I question' on the group.
Re
e-Mail:
.
Date 26th 2016f April 2016
IP 41.47.93.81
Sergey, you still haven't updated easy cycles module. I am patiently waiting for it. I would also like the ability to evenly lenghten or shorten a a cycle projection line. For example if I make a composite of a 17 month astronony composite of a cycle. I want the ability to make it 20 months, I.E. expand it evenly or do the same to shorten it. I would also appreciate if one can obtain a numerical value for amplitude in order to form projections of prices. Please view the topic 'I question' on the group.
Re
e-Mail:
.
Date 27th 2016f April 2016
IP 41.47.93.81
Sergey, you still haven't updated easy cycles module. I am patiently waiting for it. I would also like the ability to evenly lenghten or shorten a a cycle projection line. For example if I make a composite of a 17 month astronony composite of a cycle. I want the ability to make it 20 months, I.E. expand it evenly or do the same to shorten it. I would also appreciate if one can obtain a numerical value for amplitude in order to form projections of prices. Please view the topic 'I question' on the group.
Re
e-Mail: Abhay
.
Date 09th 2016f May 2016
IP 71.163.32.156
I am attaching some features that would help in find trading situatioms using Precise Charting Tools.
1) Marking of vertical lines at intersection of Gann Fan lines drawn from multiple anchor point
2) Automatic plot of intermediate Top & Bottoms horizontal lines and vertical lines at intersection points with Gann Fan lines
3) Checkbox to not show the selected vertical lines so we can filter undesired points
4) Different color selection for different Gann Fan's
e-Mail:
.
Date 19th 2016f May 2016
IP 112.215.63.11
e-Mail: bibsexsekutor@yahoo.co.id
.
Date 21st 2016f May 2016
IP 112.215.63.11
e-Mail: Ken DB
.
Date 25th 2016f May 2016
IP 99.229.137.119
Is there any way you could add a �Save as Default� function to the Q-Spectrum tool � that would allow us to save our own chosen settings? I find myself using the same set up over and over, which is quite different from the current default settings. If I could save my own settings, this would save a lot of time.
Thanks!
Ken
e-Mail: Jim Ranum
.
Date 29th 2016f May 2016
IP 97.104.178.231
Hi Sergey,
I have a couple requests on the Precise Charting module:
On the Gann Square drawing tool, can you please add the circle just inside the square? You have the circle outside the square and 3 inner circles, but not the inner circle that touches the square.
Second request is making a copy of an item and then moving it. You have the button to copy something, but when you try to move it, it moves both the copy and the original, as they are on top of each other.
We had this problem in the main screen before.
Thank you! Love this module.
Jim Ranum
e-Mail: Ahmed Farghaly
.
Date 30th 2016f May 2016
IP 41.47.68.5
In the similarity module, I would like if we can manually select the time period to display as the projection line. For example, I want my projection line to start 09/09/2003 forward.
Best regards,
Ahmed
e-Mail: Peter
.
Date 03rd 2016f June 2016
IP 14.0.168.215
Hi Sergey, In Astronomy - Composite module - Options under Accuracy would you kindly add a setting of 2degree 30 minutes, thanks.
e-Mail: Peter
.
Date 03rd 2016f June 2016
IP 14.0.168.215
In Star Trax Millennium program under Customize objects is it possible to include a function for User-defined objects? It would be a great addition when running the schemes under Dynamic Astrology, many thanks.
e-Mail: Jim Ranum
.
Date 05th 2016f June 2016
IP 97.104.178.231
One more request on Precise Charting.
All circles on the Main Panel and in Precise Charting are created from center of circle to a radius point. But in creating circles for price charts, very frequently what you really want to draw is a circle from a high to low or low to high where the 2 points are the full diameter of the circle.
There is no easy way to draw a circle in Timingsolution where the 2 points are the diameter instead of the radius.
Possibly a button you select?
Thanks Sergey.
Jim
e-Mail:
.
Date 18th 2016f June 2016
IP 109.252.59.139
e-Mail: alistermackinnon@gmail.com
.
Date 13th 2016f July 2016
IP 178.130.40.123
e-Mail: john_krall@yahoo.com
.
Date 18th 2016f July 2016
IP 85.195.246.250
Write all "active" series in Price Pane into Multi-Column CSV
As I would like to test some TS models with other, fundamental and macro-driven indicators of ours in a different software, an easy way to save all the model time series that are displayed into a .csv file would be very much appreciated.
=> Would it be possible to create a function that would write all the data series that are "currently visible / active on the main price pane" into a multi-column .csv / Tab-Delimited sheet ?
Date format should be choosable: YYYYMMDD MM/DD/YYYY DD.MM.YYYY
e-Mail: john_krall@yahoo.com
.
Date 18th 2016f July 2016
IP 85.195.246.250
Astro Quant Predictable Zones - Writing Arrow Values (with different weighting methods out into time series):
You had implemented once a function that would enable us to save the AQPZ models into a hyp file, but I am not sure it works as it should? Also, saving it as a hyp file and then re-opening is a quite complicated process.
a) Would it be possible instead to generate a time series that calculates the positive / negative influences that result from the "weighted" arrows (using the different options of weightings that you currently offer) directly into the screen?
b)and save it as .csv from the screen (this step would be obsolote if there was a general times series writing function)
e-Mail: hassan
.
Date 11th 2016f September 2016
IP 41.234.170.29
e-Mail:
.
Date 22nd 2016f September 2016
IP 112.5.236.214
e-Mail: Jim Ranum
.
Date 01st 2016f October 2016
IP 97.104.178.231
Hi Sergey,
I'd like to request an additional tweak on the new Q-box module. With this type of tool, the user needs to already know what particular planet or combination of planets to examine and I for one don't know which ones would be "best".
I would have to go through dozens of combinations testing each one and comparing manually. Perhaps I am missing something that the module can do?
The permutations of planetary combinations would be in the thousands, especially considering declinations and helio.
Is there any way to set it up to go through a list of planets/combinations the way you have it set up in Turning Points Astro Indicator, or similar, to go through and tell us what the best planets and/or combinations are?
To me, this would be the ultimate use. IMHO, of course.
Thank you,
Jim
e-Mail: Thierry
.
Date 07th 2016f November 2016
IP 83.197.120.133
Hello Sergey,
I would really like to have a simple drawing tool in the main chart:
- you open a pop up menu and it stays open, because when you start drawing, you have in general several tools to use,
- on this menu, you have all your drawing tools
- you may draw a simple segment without any unnecessary window opening
- you may duplicate forms and draw them easily without deformations
Thank you
Thierry
e-Mail:
.
Date 13th 2016f November 2016
IP 121.7.236.49
pattern similarity model to include several instruments at one time. intermarket doesn't have the capability to capture as far back as pattern similarity
e-Mail: veejay29singh@yahoo.com
.
Date 10th 2016f December 2016
IP 122.162.188.85
My Request is that you incorporate Hurst Cycle and Delta Phenomenon in your software .
This will help Traders . I understand the sucess Rate is good in Forecasting the Trend in the Market .
e-Mail: Олег
.
Date 15th 2016f December 2016
IP 46.219.209.173
Здравствуйте.
Приобрел timing solutions со скидкой, узнав о программе из блога
taxfree12.livejournal.com
Вчера обсуждали на блоге разные наблюдения.
В основном все начали пользоваться Q-Spectrum как самой понятной частью программы.
И пообщавшись решили, что было б очень удобно имеь возможность сохранять композитку рассчитанного инструмента, и потом ее куда-то копировать. Что б можно было соединить несколько композиток на одном инструменте из разных таймфреймов.
Например берем евро 5 минут, 15, 30 60 и день
Считаем каждую, в q-spectrum, выделяем на периодограмме пики, получаем композитную линию всех циклов, сохраняем ее, а потом накладываем все композитки на какой-то график, например 5 минут.
Сейчас некоторые это делают руками и вроде наблюдается тенденция к тому, что анализирую сразу 3-5 таймфреймов можно с большей вероятностью предугадать движение цены.
Но это все разовые тесты. А что б полноценно можно было сравнить на истории у нас предполагаемый вариант лишь собрать все композитки на 1 график и просмотреть на них.
Надеюсь понятно объяснил.
В группе яхо - не писал, т.к. мой английский не позволяет это объяснить, мне кажется, что и на русском объяснение получилось не рпостое, но привел пример, надеюсь будет понятно.
e-Mail: David Hall
.
Date 05th 2017f January 2017
IP 47.187.7.129
planetary lines!
they take up alot of processing power, maybe if we had them only display within a certain range?
these harmonics we need to have
108, 135, 150
pretty please!
David
e-Mail: Dheeraj R Kumbhat
.
Date 11th 2017f January 2017
IP 47.9.210.145
With Helio Lat Section, With Selection from Mercury to Vesta, 91 Cycles are presents...Mannually selection is very hard and time consuming task. Please Put the HelioLat Selection Option in Miscellaneous-Old AutoSelection.
In Astronomy Module->Option TAB, there is a button for specific Orb Setting for individual Planetary Pairs.Every Time When we open the Module, If I am using some specific set of ORBs or Some Specific orbs for all pairs, I have to fill it out manually every time..May we get SAVE AS SETTING and LOAD SETTING in that Panel? So that we can use Very Long Term Historical data with Different Setting and Long term INTRA DAY data with different Parameters, If that might be useful or necessary..
e-Mail: David Hall
.
Date 12th 2017f January 2017
IP 71.15.109.201
Sergey!
I've been utilizing aspects with planetary lines with some success but am unable to calculate the following.
150, 108, 135
how can I do this?
Thank you!
David
e-Mail: Ross
.
Date 14th 2017f January 2017
IP 162.157.4.84
Hi Sergey,
Re: Chiron is missing in the dropdown list of the planetary line module
I just found out that Chiron is no longer listed on the drop down list of the Planetary line module.
Today I wanted to re-create a template due to my mistake of saving a planetary template into a wrong template file (my fat fingers).
I am using my templates that was created 4 years ago so I did not know when Chiron has been removed from the list.
Please kindly put Chiron on the list again.
Best regards,
Ross
e-Mail: Tatiana Minina
.
Date 09th 2017f February 2017
IP 24.141.199.59
TimingSolution
Recommendations
New design
The design of the website is outdated.
Solution: http://maryannblagdon.com/ is my former colleague, she can provide with layout images for the pages.
Menu for User area
The menu in User area is not exists, so, there are no ways to go to any other pages of top level.
Solution: add top menu, using bootstrap JS library. I will be working with this library in February 11-26, can prepare the code along to my own project.
Gramma
BD spells as database � in one word.
Solution: https://www.linkedin.com/in/claire-stemp is an editor, and she will be happy to help with the content.
Favicon
It�s not exists.
Solution: http://www.favicon-generator.org/ will generate it for free. The file should be uploaded to the root of the portal
e-Mail: Jim Ranum
.
Date 11th 2017f February 2017
IP 71.47.240.54
As I stated in my post on the forum, I don't know if this is worthwhile or possible.
Also, how can there be any worthwhile discussion among other members about a concept if we can't mention it on the forum?
A question is only a question, not a request.
Especially if it's not even possible to do, or logical to do.
Other people may have ideas about it, but they can't comment on something that simply goes into the Wish List.
I think people are afraid to even discuss things or bring up a topic for fear of being accused of not putting it in the Wish List and being suspended.
My question: if we want to research the periods of high correlation that lead to discovering the cause of the beginning and ending of those cycles, we need to see when those periods are.
The one issue with the WFA is the history is always divided into equal periods, which may obscure the real periods of highest correlation. (overlapping)
Now I know we have the Wavelet module that in a way gives some visual representation, so I�m guessing you may already know how to do this. But maybe I�m wrong about that.
In this case of WFA we are talking about Astro cycles vs. specific number cycles in the Wavelet.
e-Mail: Thierry
.
Date 12th 2017f February 2017
IP 86.205.74.72
Hello Sergey,
Many searchers working in our area of non conventional market approaches try to find resonances : we expect a CIT at a particular date because it has a distance of 168 (144, 192�) days from a top, plus this assumption is reinforced because it also has a particular distance in months from a major top.
There are excellent tools in TS enabling to work on equidistant lines and I use them quite often.
Now, I wonder if this could be improved in a slightly different way.
Instead of working on one parameter and on many repetitions, suppose that you put a library of significant distances (same figures as above plus a couple other ones, with the possibility of including your own figures) and clicking on any top or bottom you will have lines connecting it in the future and in the past for one cycle only and showing if any resonance works within a predefined orb (adjusting this orb might be intereting).
Suppose also that we have identified an astro significant event, with a date coming soon. Such a tool would enable to doublecheck if there are also significant resonances with existing tops or bottoms.
Thank you
Thierry
e-Mail: Dmitry Rynza
.
Date 13th 2017f February 2017
IP 37.112.53.209
Максимальная автоматизация работы в Q Spectrum.
Cейчас много времени уходит на:
1. выделение руками нужных циклов после нажатия кнопки автовыделения. Нужных - то есть убирать циклы с WFE ниже 65%. На это уходят до 10-15 секунд каждый раз. А расчетов приходится делать очень много, каждый час порядка 10-15 расчетов.
Как решить это? Ввести автопараметр, чтобы автоматически выделялись уже только необходимые циклы с нужным параметров WFE (cкажем, на выбор - только выше 65%). И автоматизировать так, чтобы после нажатия кнопки CALCULATE в итоге мы получили уже готовую прогнозную линию на графике с учетом параметра WFE и необходимого кол-ва выделенных циклов. То есть здесь важно добиться того, чтобы достаточно было нажать ОДНУ кнопку CALCULATE и больше ничего, чтобы получить прогнозную линию уже на графике.
2. После отображения прогнозной на графике время уходит на размещение вертикальных линий времени разворотов различных поворотов прогнозной линии (кнопка date слева в меню). На это уходит по 10-20 секунд каждый раз.
Как решить? Может набрасывать сетку времени на сам график, как это сделано во всех других торговых терминалах. Какие еще есть варианты?
Спасибо
Дмитрий Рынза
e-Mail: Ulrich Weber
.
Date 13th 2017f March 2017
IP 77.23.212.92
In the T17 module a script can be edited.W hen closing the T17 window a warning message and a dialog box should ensure that last changes in the editor are not lost.
e-Mail: David
.
Date 16th 2017f March 2017
IP 47.187.7.129
Hello Sergey!
I'd like to draw trendlines on RSI withing Timing Solutions, can we do that please?
Cheers!
David
e-Mail: Martin Biber
.
Date 20th 2017f March 2017
IP 84.72.6.235
Hello Sergey,
This is an idea or wish:
In the pop-up window "Trader's Strategy" I have often several Composite. Would it make sense to add the module name behind composite to make it more clear where it was created?
Kind regards,
Martin
e-Mail: David Hall
.
Date 21st 2017f March 2017
IP 47.187.7.129
Recently I've been studying charts with yearly candles, when I want to look at planetary positions it takes SO long to generate.
Semenko diagram is ok
but planetary positions is slow, anything to speed it up?
Cheers
David
e-Mail: Jim Ranum
.
Date 01st 2017f April 2017
IP 50.89.145.140
Hi Sergey,
Please Add the node to the drop down list of planets in the ULE, Angle Difference/Orbit module.
Need to see the graph of the speed of the node and that is the only place to see it.
Thanks very much,
JimR
e-Mail: Jim Ranum
.
Date 04th 2017f April 2017
IP 50.89.145.140
Hi Sergey,
On Astro Composite, when you select the show Buy/Sell button, sometimes the Equity Curve line shows a decline and it appears that reversing the order of the Buys and Sells would produce an upward Equity Curve.
I will email a picture.
I would like to have more control over the Buy and Sell positions to show closer to real life. At least be able to swap or flip the order. A button to select?
Also, it would be good to have an output of the dates of the Buys and Sells.
Thank you.
Jim
e-Mail: Jim Ranum
.
Date 15th 2017f April 2017
IP 50.89.145.140
Hi Sergey,
Could you please make a small adjustment to the Intermarket Analysis module, under Pattern tab?
When you first load the data, it would be very helpful to be able to see the two different data plots simply overlaid, non-adjusted.
I would like to be able to see relationships between Fundamental data, like Interest Rates, etc. and the market. This module seems perfect to do that kind of analysis, but in order to see the plot, you have to use the Calculate and then there is no way to just see the data overlaid.
This would be an excellent feature to compare 2 different types of data, in normal time frames, and look for correlations.
Thank you. Hopefully this would be a very easy addition to this module.
Jim
e-Mail: Jim Ranum
.
Date 21st 2017f April 2017
IP 50.89.145.140
Hi Sergey,
On the Fan drawings, can you please adjust the location of the Point Angle information so you can read it?
It is very frustrating after you've drawn a fan and later look at it and can't read what the angle or $/day information is on that fan.
Maybe place it below the lines?
At least then, even if you are using the Price Mirror setting, you can switch it off to read the info.
Thanks,
Jim
e-Mail: Jim Ranum
.
Date 26th 2017f April 2017
IP 50.89.145.140
Hi Sergey,
On the T17 module, can you please add the ability to use non-Astro dates also?
This module is incredible from the perspective of testing an overall success in profits and an equity curve!
I think to get the full benefit from it, we should have a full range of ULE, including the Fundamentals component, i.e. Presidential years, etc.
You did this for the Similarity module a couple years ago. Maybe that code can be put into the T17?
Maybe just the list of Fundamental dates. Things like the Fed Reserve calendar, optimize for days before/after, etc.
I believe this equity curve optimization has the most merit.
Thank you,
Jim
e-Mail: Thierry Sompairac
.
Date 29th 2017f April 2017
IP 83.201.77.147
Hello Sergey,
1) When you try many different indicators or tools for a specific market, you end up with a big mess of good and not so good results and it's not easy to remember what is what especially if you do not work continusly on the same market.
It would be good to have a way to classify the tools.
2) a few month ago I suggested the possibility of a tool identifying harmonics by counting days numbers. I know that you do not give any commitment for an answer, but I was just curious why you considered this idea as not relevant.
Thank you again for your continuous efforts
Best Thierry
e-Mail: Jim Ranum
.
Date 01st 2017f May 2017
IP 50.89.145.140
Hi Sergey,
Sorry for another request. In the Precise Charting module, could you please add the ability to have harmonics of the Perfect circle?
You have the 2-D Price-Time function, but the lines are all very wavey. The perfect circle function works very well and you can see great hits. But it also appears that the hits continue off of a well-drawn circle to harmonics outside of it.
Thank you very much for another great tool.
Jim
e-Mail: Jim Ranum
.
Date 03rd 2017f May 2017
IP 50.89.145.140
Hi Sergey,
On the Equidistant Lines function, can you please add the ability to set a specific number? Right now, you can only drag on the screen and it is not accurate enough.
Many Gann related cycles are large number of DAYS, and the Equidistant Lines switches to years at 5 years and no way to set a specific number of days.
Very hard to track the cycles.
It would be best to be able to set the specific time period in days/weeks/months, like in other places in the program.
This is a very important tool.
Thank you very much!
Jim
e-Mail: Gabriella Mittelman
.
Date 24th 2017f May 2017
IP 77.127.157.180
Dear Sergey,
Pls. consider adding in ULE, a possibility to add future charts' aspects, ingresses, MP, etc, and not only transits. I mean Secondary progressed, Directed ( 1 deg./year ); Solar arc, Solar return, and other future chart aspects, to the natal charts.
I think this is very very important for a long term analysis.
Thanks
Gabriella
e-Mail: Martin Biber
.
Date 08th 2017f June 2017
IP 77.56.244.115
Hello Sergey,
I just switch in q-box to "Summary Chart only". It would help me if there is either a scale on the left or a zero line. It helps me a lot to see where 0 is to analyze the summary chart.
Thank you.
Kind regards,
Martin
e-Mail: Martin Biber
.
Date 08th 2017f June 2017
IP 77.56.244.115
Hello Sergey,
I just switch in q-box to "Summary Chart only". It would help me if there is either a scale on the left or a zero line. It helps me a lot to see where 0 is to analyze the summary chart.
Thank you.
Kind regards,
Martin
e-Mail: Martin Biber
.
Date 08th 2017f June 2017
IP 77.56.244.115
Hello Sergey,
I just switch in q-box to "Summary Chart only". It would help me if there is either a scale on the left or a zero line. It helps me a lot to see where 0 is to analyze the summary chart.
Thank you.
Kind regards,
Martin
e-Mail: Martin Biber
.
Date 08th 2017f June 2017
IP 77.56.244.115
Hello Sergey,
I just switch in q-box to "Summary Chart only". It would help me if there is either a scale on the left or a zero line. It helps me a lot to see where 0 is to analyze the summary chart.
Thank you.
Kind regards,
Martin
e-Mail: Martin Biber
.
Date 08th 2017f June 2017
IP 77.56.244.115
Hello Sergey,
I just switch in q-box to "Summary Chart only". It would help me if there is either a scale on the left or a zero line. It helps me a lot to see where 0 is to analyze the summary chart.
Thank you.
Kind regards,
Martin
e-Mail: Martin Biber
.
Date 09th 2017f June 2017
IP 77.56.244.115
Hello Sergey,
I just switch in q-box to "Summary Chart only". It would help me if there is either a scale on the left or a zero line. It helps me a lot to see where 0 is to analyze the summary chart.
Thank you.
Kind regards,
Martin
e-Mail: Martin Biber
.
Date 09th 2017f June 2017
IP 77.56.244.115
Hello Sergey,
I just switch in q-box to "Summary Chart only". It would help me if there is either a scale on the left or a zero line. It helps me a lot to see where 0 is to analyze the summary chart.
Thank you.
Kind regards,
Martin
e-Mail: David
.
Date 09th 2017f June 2017
IP 47.187.7.129
Can we get subfolders for the drawing tools?
I'm drawing ALOT of circles and would be useful to flip them all off and on at one time
I'd have hundreds of circles if it were easy lolz!
e-Mail: Martin Biber
.
Date 12th 2017f June 2017
IP 77.56.244.115
Hello Sergey,
I just switch in q-box to "Summary Chart only". It would help me if there is either a scale on the left or a zero line. It helps me a lot to see where 0 is to analyze the summary chart.
Thank you.
Kind regards,
Martin
e-Mail: Martin Biber
.
Date 12th 2017f June 2017
IP 77.56.244.115
Hello Sergey,
I just switch in q-box to "Summary Chart only". It would help me if there is either a scale on the left or a zero line. It helps me a lot to see where 0 is to analyze the summary chart.
Thank you.
Kind regards,
Martin
e-Mail: Martin Biber
.
Date 13th 2017f June 2017
IP 77.56.244.115
Hello Sergey,
I just switch in q-box to "Summary Chart only". It would help me if there is either a scale on the left or a zero line. It helps me a lot to see where 0 is to analyze the summary chart.
Thank you.
Kind regards,
Martin
e-Mail: Jim Ranum
.
Date 07th 2017f July 2017
IP 50.89.145.157
Hi Sergey,
Could you please expand the Document Designer in ULE, or another method that suits you better, of course, to enable the output report to give the same Astro data that you put into the Turning Point Analyzer?
You expanded the Zigzag Statistic Report to give the planetary positions at the turn points.
Frequently, when doing research, you have your own list of dates, based on various factors that you're trying to research the common themes. This list of dates can be put into a Fundamentals file, to be pulled up in ULE, for example.
It would be of monumental help to be able to then create a report from that, example, Document Designer (or whatever you think) to get the Astro positions for those Fundamental dates.
This would be particularly helpful for research on turn dates that don't necessarily coincide with exact highs/lows, i.e. secondary highs/lows, etc.
Right now, there doesn't seem to be ANY way to do this kind of research. And yet, it seems completely logical to do so.
The Turning Point Analyzer module's Statistic Report was a fantastic addition and this is the next logical step.
Thank you,
Jim
e-Mail: Jim Ranum
.
Date 10th 2017f July 2017
IP 50.89.145.157
Hi Sergey,
Please add the feature to Easy Cycle module to add cycles with a start and end dates.
Since cycles usually "begin and end", as illustrated by Wavelet module, it would be extremely useful to create cycles and see the interaction as they start and end.
Thank you.
JimR
e-Mail: Shengeliya Timur t2094774@ya.ru
.
Date 11th 2017f July 2017
IP 109.252.109.79
Сергей, добрый День. Благодарен Вам за программу.
Скажите, пожалуйста, Возможно ли сделать следующее---
1) Я загружаю котировки с Esignal b и хотел бы , что бы была возможность загружать бары
по 13,26,39,49,65,78 минут.
2) Сделать опцию , которая меняла бы значение цены на графике по формуле. Например, я
загрузил график S&P500 и хочу поменять значение цены по формуле--("цена" делить на 0,64). То есть для этого надо поменять значение всех баров.
e-Mail: PedRo
.
Date 21st 2017f July 2017
IP 36.70.5.210
e-Mail: Jim Ranum
.
Date 25th 2017f July 2017
IP 50.89.145.157
Regarding update to Easy cycles:
When you use the Precise Charting button to place the wavelet on a specific date, the �end� of the wavelet gets placed on the Initial date, instead of the beginning of the wavelet.
This makes it very difficult to place the wavelet where you want it, because you have to calculate the dates, add the length of the wavelet and then shift the date in the Precise Charting Initial date to get the beginning of the wavelet to be in the right place.
It would be much easier and more logical to have the beginning cycle peak be at the Initial Point.
See the picture: (emailed 7/25/2017)
The last consideration on this Initial Point is whether the cycle starts on a high or a low. (This example shows a Low) I know you can invert the cycle, but then the Initial Point won�t be correct. So you�ll be left with the same problem.
Thanks again Sergey.
Jim
e-Mail: Gabriella
.
Date 10th 2017f August 2017
IP 77.127.45.159
Dear Sergey,
How can I make a progressed transit, or Directed, or Solar arc, on a chart?
Seems that in the ULE there is only transit to natal...
thanks
PS. I thought there is a possibility, only I don't see it.
thanks.
e-Mail:
.
Date 06th 2017f September 2017
IP 125.164.30.154
e-Mail: David Hall
.
Date 06th 2017f October 2017
IP 47.187.7.129
Mean of Five planetary steps
Mean of ten planetary steps
geo and helio!
e-Mail: Vicente Alvarez
.
Date 06th 2017f October 2017
IP 23.127.243.12
hi,
Two questions:
1. I would like to add moving averages to the RSI indicator in TS. Where do I go to learn how to do that?
2. I would like to load a new (RSI based) indicator into TS. What is the process to do this?
Thank you for awesome software!
:) Vicente
e-Mail: Alon Avramson
.
Date 17th 2017f October 2017
IP 80.179.126.26
(17 Oct 2017)
Hello Sergey,
When I click in SQ9 "mark cell" the price line is marked on the chart.
Is there a way to mark also the dates on the chart when using mark-cell with "data" option?
Thanks
Alon
e-Mail:
.
Date 23rd 2017f November 2017
IP 138.68.184.169
e-Mail: wicky4415@gmail.com
.
Date 31st 2018f March 2018
IP 134.196.45.117
e-Mail: Martin
.
Date 20th 2018f April 2018
IP 99.248.42.203
> hi,
>
> 1, some tools line counting, es. my data is non intro-day, why counting days will present numbers in like 1234.5d, it should be whole numbers
>
> 2, when mouse right click the count line, pop up the tool option windows, in the counting case, could I customize the length by putting numbers in the pop up window?
>
> 3, some time I want to review the data, which bottom to click I could review the price database?
>
> 4, sometime the calculate tool pop up even after the first time I load the new data in the the working area, could I turn it off?
>
> 5, till now I feel this software is good , but it is not so convenient to use with mouse, if you ever used autocad, you would know what I am feeling, maybe in future you could add an option to add user's command shortcut, I feel the left click mouse to drag is some time will be miss click and confused, if want to move some line if I forgot to push shift, if will move the screen, in Photoshop or cad way, if you add the space as the pan mode would be better. and to zoom the view is another difficult job, mouse have a scroll wheel, if you allow user to zoom in and out with mouse scroll is painless. in Photoshop(or any other adobe professional software), the all secret of the keyboard is shirft , ctrl, and alt, combined with mouse, because ,I feel the right way to manipulating the chart is like a vector drawing software like illustrator or autocad or microstation anyway.
>
e-Mail: Jim Ranum
.
Date 25th 2018f April 2018
IP 50.89.145.157
Hi Sergey,
Please add the oppositions to the spherical conjunctions. These are certainly valid points in time and space. Just having the conjunctions is incomplete.
Thank you!
e-Mail:
.
Date 27th 2018f April 2018
IP 62.103.233.29
More features in backtesting nn models
for example :(1) more targets (not only RPO).For sure use CLOSE.
(2) ability to choose training interval (prior to LBC ) period
Thank you
e-Mail: Christian Hagglof
.
Date 28th 2018f April 2018
IP 94.255.129.229
Sergey,
Please include the DTN Iqfeed datafeed into the TS software.
Users of Timingsolution and eSignal will be grateful for reducing their high costs for data, but it will be very useful also for all other users because:
"
IQFeed is widely recognized as providing the most comprehensive service to traders at the best overall price. The data behind IQFeed is one of the fastest, most reliable datafeeds available
"
and because:
"
You won�t find faster, cleaner, more complete or more reliable data than IQFeed. Looks like we�ll even save you a few $�s too. IQFeed with real-time futures is $940.80/year + monthly exchange fees. If you are a non-professional approved for the Globex waiver then your monthly futures exchange fee will be just $3/month and $6 for NYSE and $6 for Nasdaq.
Successful traders have been using iQFeed for reliable market data since 1984.
As a Tier One Data Vendor, iQFeed is one of the very few data providers that still receives the full feed (every tick) direct from the exchange. Our subscribers trade with total confidence, knowing they have the most complete and accurate data available. For serious traders this is an essential requirement. Many other data feeds don�t provide as complete or reliable data as iQFeed. Some will bundle or consolidate their data and some only send out data on a refresh cycle. This means that their customers aren�t receiving the same true tick by-tick-data like iQFeed subscribers do. Without true tick-by-tick data charts and technical analysis programs aren�t as accurate, and could give false buy-sell signals that end up costing you money in bad trades instead of helping you make money.
An iQFeed subscription also includes tick, minute and daily historical data at no extra charge. We include more indexes and indicators (including TICK and TRIN) than other data feeds. Our calculated indicators are updated faster than any other data provider. Also included are 4 free live market newswires, including the Premium version of Benzinga News (a $39/month value). Other popular newswires are also available to add. Our free best in the industry tech support is available 24/5 via toll-free phone, email and online chat. They not only help with iQFeed data but they also help support many of the 75+ compatible software programs that use iQFeed.
Here is a link to the list of these programs:
http://www.iqfeed.net/Dave/index.cfm?displayaction=data§ion=software
Because we�ve built up a such a huge loyal customer base over the years, iQFeed is able to offer professional quality data that is affordably priced for the individual trader.
For a 7-day free trial of iQFeed please click on the link below to go to our free trial sign up site:
https://www.iqfeed.net/Dave/index.cfm?displayaction=start
For more information on iQFeed, including detailed pricing and features, please go to the iQFeed home page:
http://www.iqfeed.net/Dave/index.cfm
"
This is the link to Developers:
http://www.iqfeed.net/index.cfm?displayaction=developer§ion=main
Kind regards,
Christian
e-Mail: Ilya
.
Date 10th 2018f May 2018
IP 85.21.134.178
It would be perfect to add such futures to the interface:
1) Time scaling using mouse wheel
2) Logarithmic vs Linear scale switcher on Y-axis
Thank you in advance
e-Mail: haha
.
Date 14th 2018f May 2018
IP 27.27.160.88
e-Mail: mldarcy@embarqmail.om
.
Date 13th 2018f June 2018
IP 71.215.104.101
e-Mail: mldarcy@embarqmail.om
.
Date 13th 2018f June 2018
IP 71.215.104.101
e-Mail: mldarcy@embarqmail.om
.
Date 14th 2018f June 2018
IP 71.215.104.101
e-Mail: mldarcy@embarqmail.om
.
Date 14th 2018f June 2018
IP 71.215.104.101
e-Mail: amer ahmed amer
.
Date 15th 2018f June 2018
IP 197.49.38.104
e-Mail: Jim Ranum
.
Date 30th 2018f June 2018
IP 50.88.197.124
I'd like to request more work be done on the T17 module Quantum Spectrum tab, to allow user control of the Best Cycles threshold parameters.
I'd like to be able to click/select results of the Quantum Spectrum and see the associated Equity Curve.
I'd like it to be clearer how to implement a trade based on the results.
Lastly, I'd like the WFA tab to be updated with some way to see the results in a usable way. It doesn't allow for sorting the results, nor does it provide any statistics or insights from running the module.
I'd like to see greater use of Equity Curves throughout the program.
Thank you so much.
e-Mail: Jim Ranum
.
Date 30th 2018f June 2018
IP 50.88.197.124
Hi Sergey,
Per our discussion. I request the Filter tab in T17 be utilized.
I'd like to request something similar to what you added to the Similarity module with ULE and/or a Fundamental filter.
Per my post on the forum.
Thank you very much.
e-Mail: gucluoguz@yahoo.com
.
Date 03rd 2018f July 2018
IP 149.0.252.173
e-Mail: Jure
.
Date 30th 2018f August 2018
IP 86.61.79.223
Hello,
i would love if you could also unzoom Y axis on Ephemeris Horizontal diagram (to see aspects) that are above.
thanks and have a nice day!
Jure
e-Mail: JD Ross
.
Date 25th 2018f September 2018
IP 107.167.108.62
I would like the ability to draw a trend line and specify the values of the starting and ending points, as well as the start and end dates.
I would also like the ability to specify an angular value for a trend line.
e-Mail: J D Ross
.
Date 26th 2018f September 2018
IP 107.167.109.165
I would like to see the ability to display a price chart in logarithmic scale restored.
e-Mail: Pier (got_@libero.it)
.
Date 26th 2018f September 2018
IP 93.47.228.49
Possibility to import grafic patterns (jpg pictures) in "precise charting" section ,with the possibility to choose a specific point to rotate them to better superimpose to the chart
e-Mail: Samik Mukherjee
.
Date 04th 2018f October 2018
IP 137.59.252.236
Hi Sergey,
An animation function in the graphic ephemeris (also the astrological prediction technique) tool will be really helpful - this is to allow the time-line to be automatically forwarded or rewinded in time to see how the planets move along the zodiac between two points of interest. What happens now is that the mouse needs to be clicked onto individual points to set the time-line and see the planetary picture. This breaks up the observation as the picture moves in steps - sort of like seeing a series of individual photos vs seeing a movie clip (which makes more sense in understanding the picture) than seeing individual photo flashes (much harder to make sense).
Thanks,
Samik
(vin14481@yahoo.com)
e-Mail: Alon Avramson
.
Date 06th 2018f October 2018
IP 89.139.223.218
Hello Sergey
In SQ9, there is an option to mark a cell, in price mode it sets a line on the main window with the price level. in DATA mode it does not include the date in the list nor sets a date mark on the window. I wish you add the option to mark dates.
Thanks
Alon
e-Mail: jd ross
.
Date 14th 2018f October 2018
IP 107.167.109.206
In the Planetary Equidistant Lines module:
I would like to specify a date from which to start. This is necessary to measure planetary movement for a period that is before the data in the chart.
An example:
Soybeans began trading on October 5, 1936. Current S2 chart data only goes back to July 1, 1959. If I want to chart the dates where Jupiter moves 63.29� it is not possible. Specifying the position of Jupiter at the natal does not put the date hits at the right position on the chart.
I would like to be able to specify start date Oct 5, 1936; planet Jupiter; step 63.29� (Helio or Geo).
e-Mail: jdross@airmail.net
.
Date 17th 2018f October 2018
IP 107.167.104.64
the Planetary Return tool would be much more useful if:
It was possible to specify a start date.
Or the best option, if it linked directly to the Natal chart.
Many thanks,
JD
e-Mail: Anthony Tsousis
.
Date 20th 2018f October 2018
IP 203.220.92.229
Hi Sergey,hope you are well and prospering ! I was wondering,if it's a simple thing to add an ability to draw and move with the mouse on the Natal or Astrological prediction technique horoscopes, various aspect shapes.For eg triangle/square/pentagon/hexagon/heptagon/octogon/nonagon.This would be highly desirable.Many thanks and all the Best Anthony Tsousis. p.s I'll send a picture to the ts service address.
e-Mail: Alon Avramson
.
Date 22nd 2018f October 2018
IP 89.139.223.218
Hello Sergey,
On the main window, on the bottom, where it is written: LBC:... LAST:... TRAIN/TEST...
is there a way to define the fonts size? please add this option
Thanks
Alon
e-Mail: Thierry Sompairac
.
Date 24th 2018f October 2018
IP 90.118.238.49
Hello Sergey, Hello Tatiana,,
I have sent to you in parallel an email containing a couple of screenshots explaining my wishes.
Best
Thierry
Hello Sergey,
Hello Tatiana,
I have 2
wishes (not three as usual in the fairy tales) which are self explanatory in the
screenshots attached.
When I work
with precise charting some tools do not work, eg some tools saved in the
preferred section (heart symbol). Also the horizontal line works or does not
work in a random way.
Thanks and
regards
Thierry
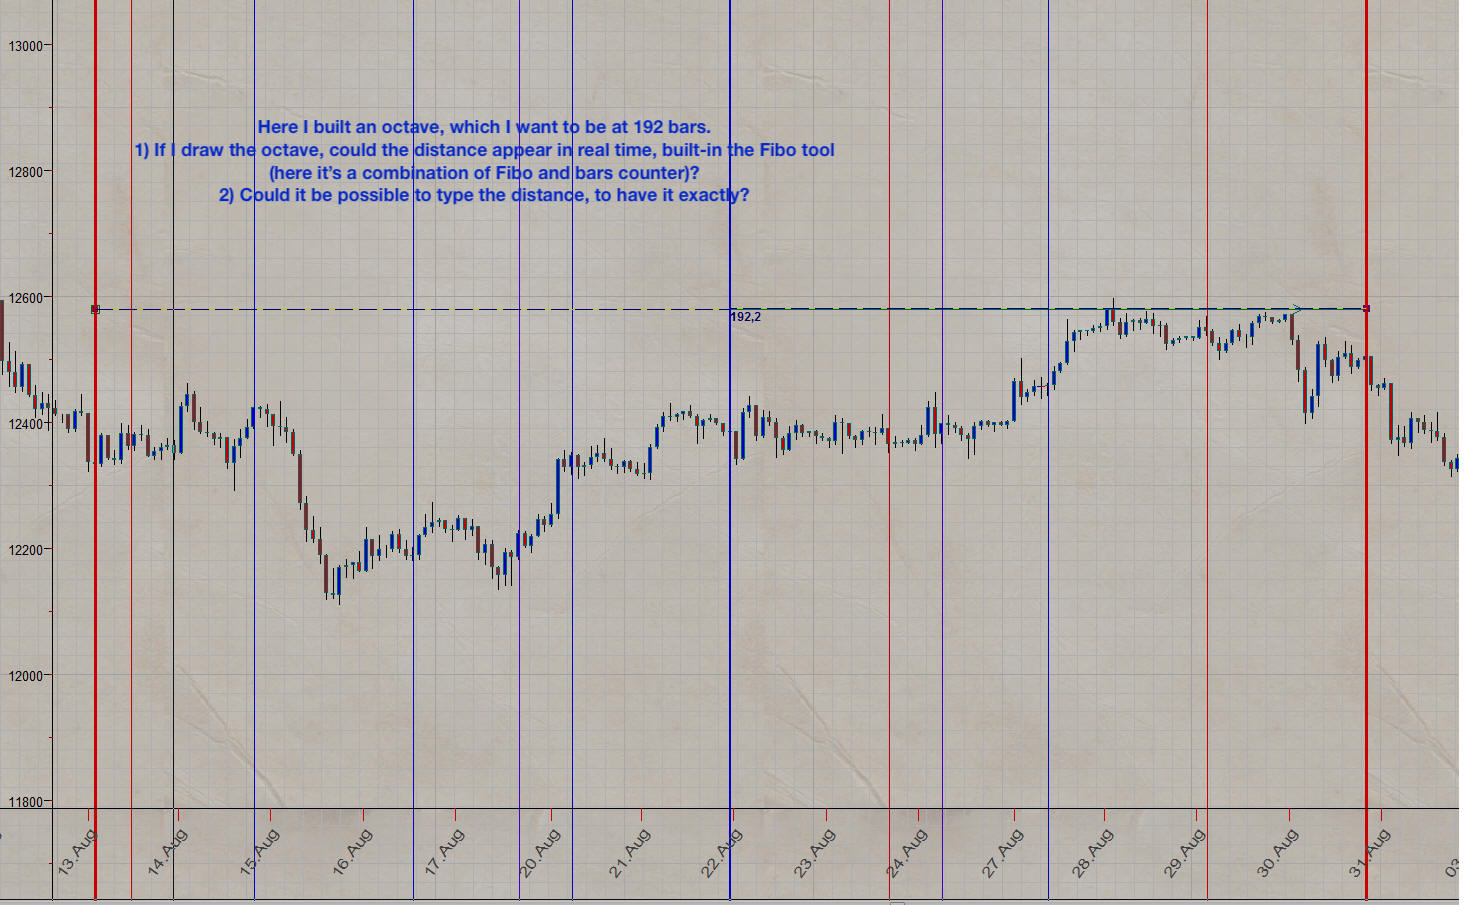
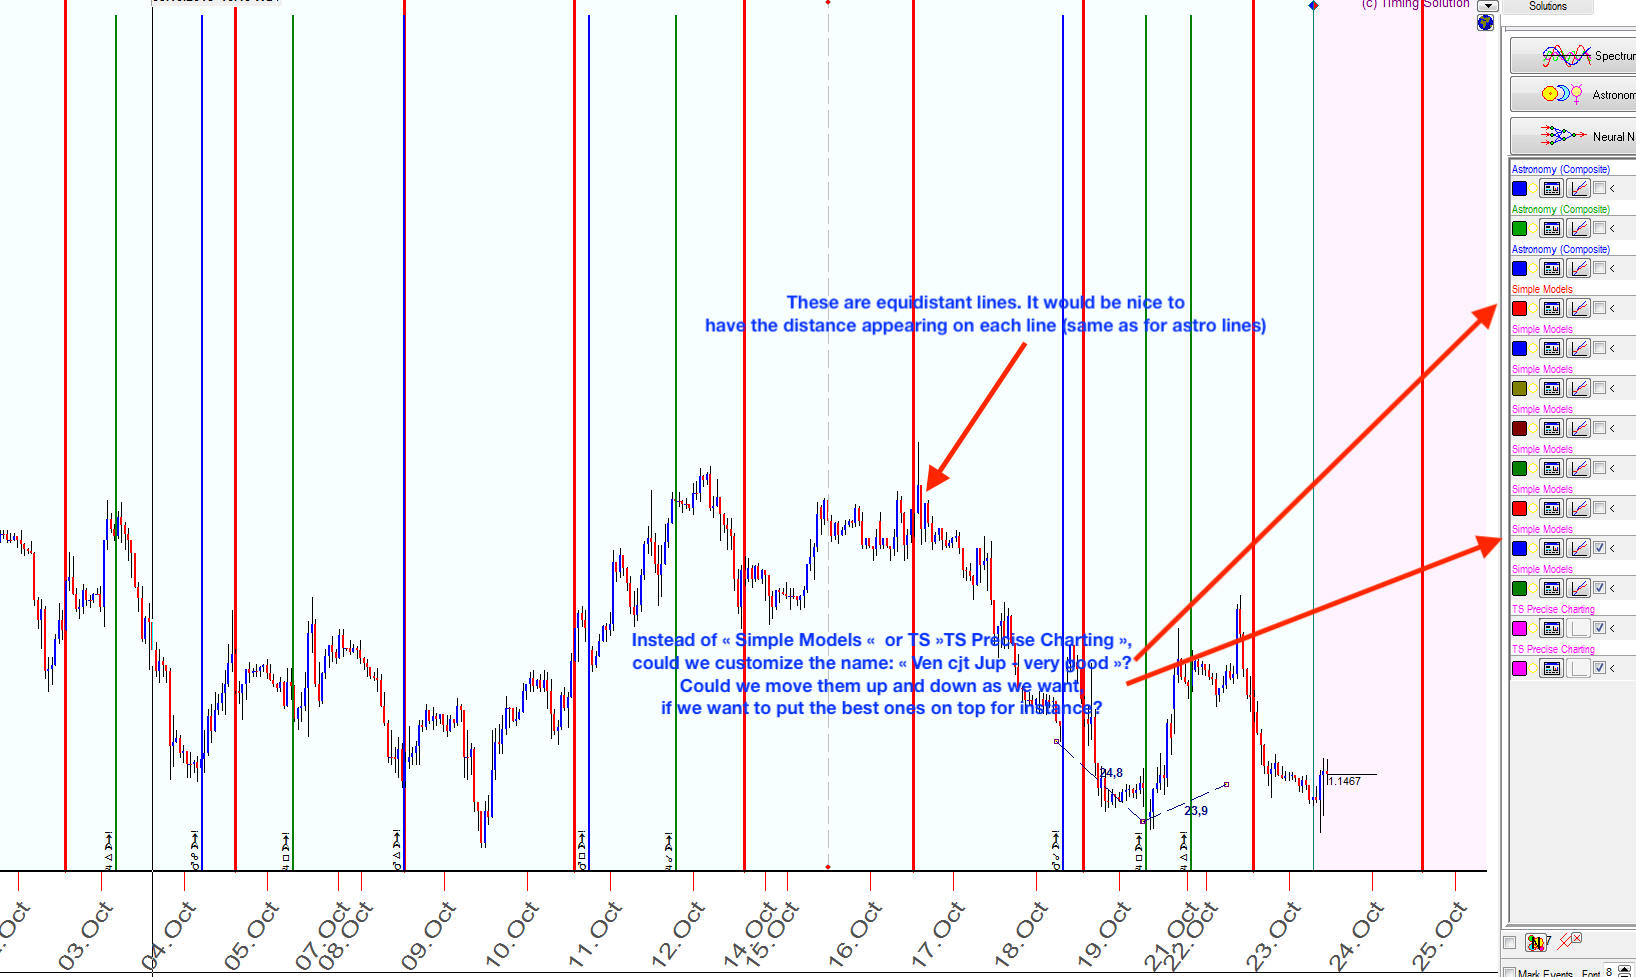
e-Mail:
.
Date 02nd 2018f November 2018
IP 73.170.150.184
e-Mail:
.
Date 24th 2018f November 2018
IP 220.225.10.130
e-Mail: Jim Ranum
.
Date 16th 2018f December 2018
IP 68.202.224.169
Trying to adjust the Equidistant Lines with the Options window, it does not let you set an exact amount manually. The place that should allow you to set the amount says �Incline $/day�, but should be Days/Weeks/Months.
I have this in the program for Day Counter, but even there, you can�t set the amount manually. It would be good if both of these tools worked the same way and allowed to set the amount of Day/Weeks/Months precisely.
Thank you very much!
e-Mail: atul
.
Date 02nd 2019f January 2019
IP 103.58.141.108
e-Mail: NABIH
.
Date 02nd 2019f January 2019
IP 91.93.82.127
please add choice to change font size in fibo retracement and all other charting tools
the font is too small and hard to read
e-Mail:
.
Date 02nd 2019f January 2019
IP 92.36.141.55
e-Mail: Nabih
.
Date 03rd 2019f January 2019
IP 91.93.82.127
please add a choice to review ULE from Solution window/tab because it is so important
I can not review all ULE because I calculate around 50 formula at a time
e-Mail: mohsen.gh1986@yahoo.com
.
Date 10th 2019f January 2019
IP 37.59.248.49
e-Mail: Martin
.
Date 13th 2019f February 2019
IP 77.56.107.85
Dear Sergey,
Please allow us to invert the "price chart slice". So far we can copy it forward but it would be nice if we could invert the price.
Best regards,
Martin
e-Mail:
.
Date 01st 2019f March 2019
IP 99.248.4.166
Test
e-Mail: nabih.zahoueh@gmail.com
.
Date 05th 2019f May 2019
IP 176.88.5.3
please add an option in "EASY CYCLE" to add label / name to wave list
please fix the issue to change projection line color for easy cycle because it is not working
thanks a lot
e-Mail:
.
Date 05th 2019f May 2019
IP 99.248.4.166
Dear Sergey,
please add an option in "EASY CYCLE" to add label / name to wave list
please fix the issue to change projection line color for easy cycle because it is not working
thanks a lot
e-Mail: kchan369@gmail.com
.
Date 05th 2019f May 2019
IP 1.65.155.87
Please add full moon point in the planet list so that other transiting planets could aspect to these full moon points.
Kenneth
e-Mail: tsompairac@mac.com
.
Date 08th 2019f May 2019
IP 109.210.74.43
Hello Sergey,
I would be very interested in having the midheaven and ascendant appear in the Astrological prediction Technique module (very useful for intraday). But it may be simply that I don't know how to let it appear...
Best regards
Thierry
e-Mail: drlvanb@yahoo.com
.
Date 09th 2019f May 2019
IP 73.243.74.60
Sergey,
Is it possible to get a tool that would work in the Precise Charting module that would let you click on the low and add a count across the chart from the low. And be able to do this for multiple highs and lows on the chart. Best would be to be tied to the grid on the chart and also be able to stop it after xxxx count if necessary otherwise continue it across the chart.
ALso would it be possible to have a cycle tool that would allow you to add a series of day time spans ie 7, 12, 21,28, 35 etc from a high or low and not have to use the percentage tool but to tell it to just add this cycle span list to the chart at the low.
ALso the handle for the text ...can it be made to disappear when you take off edit. Right now it is in the way and somewhat misleading as to the point being marked. Also could we get a few symbols to be able to add to the chart for notating points on the chart.
I can send a picture of the first request but cannot figure out how to add it to this.
Lorrie
e-Mail: tsompairac@mac.com
.
Date 22nd 2019f May 2019
IP 190.2.149.112
Hello Sergey,
When playing with the astro prediction technique module, and using the arrows, many times interesting aspects appear.
It would be nice to have a button putting a vertical line into the price graphic, including a possibility for the user to write his comment - why this line?
May I recall the wish of having asc and MC appear on this module?
Best regards
Thierry
e-Mail: surgut.andrey@gmail.com
.
Date 05th 2019f June 2019
IP 112.134.37.55
Хочу оставить пожелание по реализации в ТМ возможности фиксировать соотношение цены и бара. Спасибо большое!
e-Mail: bs@martil.ru
.
Date 17th 2019f June 2019
IP 109.252.53.70
Hello.
Please, can you make manual shifting curve in Q-Spectrum? I would like to shift it manual sometimes to fit more the price history. Like you made it in Intremarket module. Thank you.
e-Mail: Sergey
.
Date 25th 2019f June 2019
IP 99.248.4.166
******************************** COUNTERS DISCUSSION JUNE 2019 ******************
I agree with gerald the ability to push out from a desired start position - . This is generally a significant high or low.
To get around this at present i use the customised events module ( one for each date ) and an excel spreadsheet which for lots of highs and lows takes a significant amount of time. I use the spiral calendar dates to project potential turning points into the future and in the past in terms of dates but it could be any specific sequence as gerald mentions.
1. Ability to click on a specific date
2. Ability to setup specific customised interval sequence projection i.e. Every 4 days , Squared , Fibonacci sequence , Spiral calendar dates ( i envisage you could name a sequence and select that ) - You would have a faavorite if you like to auto setup when continually clicking.
3. Desired result would be a specific line on the future or previous date whether this is below or on the date - would be optional or a heatmap type of function like the Market profile but on the horizontal axis
This could also go back from a current date so you could identify from your sequence a potential swing that might have importance but is not readily identifiable from a major high or low - it could be a minor high or low.
If you would any further information on this then let me know.,
Kind Regards,
Todd
On Friday, 14 June 2019, 00:57:49 BST, Gerald wrote:
***********************************************
Hi Sergey
Regarding your below answer to Lorrie's question, maybe she asked a different private question, but the question I saw relates to a technique Gann used on almost all of his charts which is to start time counts from every important turning point. What you showed below seems to be a way to count time intervals between turning points which is very different.
Gann's technique is more of a marker rather than a timer. What it does is mark the desired points in time after a chosen start position. Most time marks would be at regular intervals like every 4 days (so starting from a chosen point, time marks would show the points 4, 8, 12, 16 etc days after the start). Some points marked would not be regular (ie they might be the squares such as 9, 16, 25, 36, 49 etc days after the chosen start point).
Hopefully the marker tool would allow the user to choose the regular interval increment (such as 4 days) and also other custom points such as the squares to be marked on the time ruler starting at a point selected by the user.
This is a tedious process to do manually but should be easy in a computer program.
Below is an example from one of Gann's charts.
*************************************************
This is another tool which may or may not be already present in TS – I mention it just in case it is not there:
A bar counter with possibility to project forward (and why not also backward) in the form of vertical lines the time distance and the price difference as time units
at some proportions based on Fibonacci ratios, user defined ratios or based on the Sq9 formula
To differentiate between vertical lines based on time and vertical lines based on price their color can be defined differently
In the setup.
1. Select that tool
2. Click on a CIT once with the left mouse button and hold the left mouse button down
3. Drag the mouse to a new position in the field PAST the last bar of the price history to the light hand side of the chart
4. Release the left mouse button at a date or at a time point in the future of your choice
5. A vertical line appears attached on the time point where the mouse button is released
6. Time distance (and optionally price difference) are displayed together with the vertical line to show the origin of the vertical line projection
I like this as an idea with the option of the projecting out likely changes in trend for the future with dates. My goal is to look for a high confluence of dates for a possible future change in trend. There could be several options for projecting out from Fibonacci dates to spiral calendar dates.
Kind regards,
Todd
Sergey,
My input is to have a way to see if a bar count that repeats, let's say a 28 trading bar shows up.
OK, but does it repeat into the past and future with accuracy? To me accuracy means the cit occurs within 1 to 3 trading days.
So we want to look at 28 tb, 56 tb, 84 tb, etc.
Thanks,
Steve
Hi Sergey,
The bar counter is messy, it gets in the way of price action.
But putting it at the bottom/top would be even worse as you would have multiple counts overlaying each other and it would be impossible to read anything at all. Unless, that is, you had a height adjustor.
As it is I run verticals and measure between the verticals wherever there is space, but each one has to be positioned relative to the others so everything can be seen. If your system did as you suggest and immediately placed two verticals joined with a horizontal and did away with the oblique, and then with one click you can drag the height up or down rather than having it fixed, this would avoid all counts overlaying and would work well.
Best,
Reece.
________________________________________
*************************************************************
e-Mail: Thierry
.
Date 26th 2019f June 2019
IP 99.248.4.166
Hello Sergey, Many thanks for your last counting tools: really great improvements. As you know I am looking for a resonance tool and we are close to it. Let's consider the multiple counting tool (from several highs and lows). People like it because they are trying to find significant numbers in it. Why not build a separate list of significant numbers (that everyone could customize)? Then, whe you draw the end of your multiple counter selection, if a distance comes to such a number, it changes colour and makes "Ding" (may be also "Bing"). Possibly put an orb. Sorry to be insistant, but it would be really a great tool (and I think quite exclusive). Best regards Thierry
e-Mail: Gerald
.
Date 26th 2019f June 2019
IP 99.248.4.166
Hi Sergey
Re your question to the group #2 below, Mars path and also the Saturn path were two Gann favourites.
Regards
Gerald
e-Mail: nabih.zahoueh@gmail.com
.
Date 09th 2019f July 2019
IP 176.88.5.99
THERE IS PROBLEM REGARDING CUSTOMIZE ASPECT
I AM TRYING TO ADD/DEFINE ASPECT OF 114 DEG 4 MIN (114 04) AND ADD IT TO ASPECT LIST
WHEN I USE IT IN ASPECT RELATIONS IT IS NOT WORKING
e-Mail:
.
Date 11th 2019f July 2019
IP 17.233.83.189
e-Mail: defender136@mail.ru
.
Date 09th 2019f August 2019
IP 195.24.255.147
Hello!
I have been using TS for one year. I had a lot of climb and fallen in this time. I tried to add the main modules into my trading strategy, but the most of it had some probability characteristics. While I require strong point about the signal.
In addition, half year ago I met "Quantum figures" module. I was interested in because I have a physics’ degree. After some time I understood that these module have only the name from Quantum physics -)
In addition, I understood that "Quantum figures" have one strong point. Its "model price and time" like wrote Gann and James A. Hyerczyk in his book "Pattern, Price and Time: Using Gann Theory in Technical Analysis".
It module can take into account history of price and time, and it cool!
Now I am have a lot of working strategies under it module.
Moreover, I want to say THANK YOU.
However, I write to you not only for share of my experience but for wishes and requests.
You know that "trading strategy constructor" module has a lot of instrument for back testing, while "Quantum figures" has not. Could you add some points in that module?
1. Curve of capital;
2. Probability of add stop lose and take profit;
3. Probability of add fee and taxes;
4. Probability to add your volume of deposit;
5. Sharp coefficient;
6. While you done back test, and set LBC into the end of your data history, data of resulted strategies displayed and sorted from the first position of LBC but not from the end position of LBC;
7. Probability to set range of "stock memory (SM)" or optimization of it. For example I still don't understand how it influent to back tests;
8. Probability to set range for minimum distance between trades.
I think it is all what I wish to see in that module. I have been spending a lot of time on find of optimal strategy from trash but these improvements will able to help your users understand that useful module.
One bigger Thanks for you!
Best wishes,
Vadim Tolstykh
e-Mail: Harvey
.
Date 21st 2019f August 2019
IP 99.248.21.74
Hi, Sergey!
On 8/21/19, SergeyTS wrote:
> Updated, VIX is there. I also have updated other similarities that we
> did not update during summer time.
The VIX indicator is used for only a couple of market indexes. Have you also included "VIX Fix" by Larry Williams, which was created to form a VIX-like indicator for individual stocks and other markets? (I think I remember a very quick mention in his presentation today, but it could be my faulty memory at times.) Its programming code was published in a market magazine article about it years ago and thus is publicly available. You can find it all over the Internet, but perhaps you might want to contact Larry himself to authorize incorporating it in Timing Solution (if it's not already there). Just thought it would be useful to TS users.
Harvey
e-Mail: Vadim Toltykh
.
Date 26th 2019f August 2019
IP 67.69.69.40
Hello, Sergey
If I be honest, the name Quantum figures is good. However, many people feel a fear when they read «Quantum», it may be "call price and time figures", or something like that. I think it does not matter the most important is how it work. Moreover, I wish I took a part in improvement of it module.
Now I have nice strategy for BTCUSD 1D (Bitfinex) and nine different strategies for shares (1W).
If you want to see these strategies, you can write me about it, I will send to you.
However now I am want to tell you, how I use the module.
First of thing, I have to enough number of bars for back test.
Second, I prepare the module for back test:
a) I have to put LBC to place that forward from big move, and that place must split not less than 1/3 (1-forecost, 2/3-backtest)
b) I enter other options:
— Average transaction length- unchanged (if we change on 0:1, we will have too many similar strategies, and it increase time of optimization significantly);
— max continuation- No Filter (this point is gave to us a lot of different strategies, and time of optimization increase not significantly;
— LBC -before LBC (of course);
— Experiment — 5 (it has not too much the analyzed models, but has enough different strategies).
— Stock memory – 30 (this number has the most ratio time of optimization/number of different strategies).
All of options I take experimentally. Moreover, I still do not understand what it are. However, I saw how it influent on optimization (analyzed models).
c) I chose several “min distance between trades” (it 5,10,15,20 usually), for example if I find perspective strategy on 10 then I will test this on 6,7,8,9,11,12,13,14 "min distance between trades".
Third, I need to choose kind of Quantum figures. My experience show that the most perspective are: Price/Time Box, Price/Time Figure and sometimes Time Fractal2. I taste all of it for every instruments.
Fourth, I input kind of optimization. Please note that Price/Time box + pricing only is incorrect, Price/Time Figure + Balanced= Price/Time Figure + More timing.
Finally, if I find good strategies, I try to find it while LBC stay on different times, and when I see that it strategy not change when I change place of LBC and it have a good resulted in forecast and back tested, I will use it.
How I see what strategy is good or bad.
I watch on different characteristics:
1. How strategy feel itself in forecast, I mean how many trades it does and how many are positive.
2. Angle of the corner points (how figure is looks like).
3. I sorted resulted strategies from profit (it is experimental point).
When I sure that it is strong strategies, I am writing the price/date of buy and sell signals to excel. After that, I have maximum downtrend/loss/profit/uptrend, sharp coefficient etc. parameters, which I can extract for this data.
FINALY I choose strategy and make money management for it.
If I want, I can change rules of signals. For example, when I buy, price move on next quantum level and after that price is going down under my buy level, then I’ll close it from stop-order, and I will buy, when price across old buy level again after time.
Alternatively, I can use with it EMA, or smth. In general, I have many varieties ways of trades.
I think I can talk a lot of time talking about this module.
I will glad to help you with it!
P.S. Can we talk on Russian? It will help me too tell you more my minds. -)
Best wishes,
Vadim Tolstykh
e-Mail: nabih.zahoueh@gmail.com
.
Date 27th 2019f August 2019
IP 212.252.56.65
Dear Sergey,
my main use of timing solution is to measure and trying to link cause & effect, I mostly use all astrological charting tools and ULE and astrological predection techniques
please add cusps / Houses to customize object to produce formulas like Arabic parts
please return back cusps to planetary steps because it is helpful to measure instant angle between houses
thank you
e-Mail: Alon Avramson
.
Date 27th 2019f August 2019
IP 99.248.21.74
Notes
regarding astrological prediction module
e-Mail: tvanhees
.
Date 03rd 2019f September 2019
IP 99.248.21.74
Excluding Public holidays and Saturdays
Your data doesn't have saturdays or the weekend like mine does. Trading from the UK the market opens at 10pm Sunday night so these are included in the count - hence my request to exclude them.
e-Mail: nabih.zahoueh@gmail.com
.
Date 09th 2019f September 2019
IP 176.88.4.150
Dear Sergey
can you please add more number of pictures in ASTROLOGICAL PREDECTION TECHNIQUES, there is only one pl. picture I can assign and more is required
or, in option > customise object > planetary picture , please add a choice to add specific number of degrees same in ULE > planetary picture
e-Mail: rjuneja123@gmail.com
.
Date 13th 2019f September 2019
IP 122.173.173.206
Hello Sergey: You see I downloaded Gold mini futures value of each: 37000 approx : so error comes : Please check decimal separator: I change it.. still gives the same error as the syytem is not built for huge values. Please introduce an allowance of a bigger numeral; ie 50000 etc.. Thanks...
e-Mail: JureN
.
Date 06th 2019f October 2019
IP 89.142.73.123
Hi,
I would love some undo futures, at least for charting, i do a lot of hi,lo trendlines and would love to be able to undo and see what i had before.
Thanks,
Jure
e-Mail: alon_avramson@yahoo.com
.
Date 09th 2019f October 2019
IP 89.139.180.24
Hello Sergey
Before this change of SOLUTIONS there was the option to create a solution and run it through this menu.
There were two options: one with "solution creator" and one with .ts scripts macro commands.
1. is there still a way to run the old solutions?
2. one of the important features was a macro command to create a screen shot automatically with X days/bars before LBC and Y days/bars after LBC. I am still in need for such a feature. Is there a way around? when using the existing picture feature there is always a need to re-adjust. maybe a 2-3 presents of before and after LBC would do the job?
Thanks
Alon Avramson
e-Mail: nabih.zahoueh@gmail.com
.
Date 15th 2019f October 2019
IP 176.40.238.125
Dear Sergey
in option > customised object there is only ability to add 20 objects, can you increse number of reserved objects to 50??
thanks
e-Mail: jnevins@jnevins.com
.
Date 18th 2019f October 2019
IP 24.190.19.43
Small bug alert... I like to use 30 min data to predict weekly swings using the Spectrum Module. When Spectrum analyzer is launched it immediately calculates the cycle peaks... I use "Time" rather than "Bars" on my data to see the weekly separations. The small bug is that I cannot save Target:Metric: Time as the default using 30 min data. So the program calculates Metric:Price Bars, then I have to manually change to Metric:Time and re-calculate. It is a small thing but still it takes extra time.A fix would be very appreciated... Thanks! Jerry
e-Mail:
.
Date 26th 2019f November 2019
IP 99.248.14.72
e-Mail:
.
Date 26th 2019f November 2019
IP 99.248.14.72
Digits in 128 charting tool
e-Mail:
.
Date 07th 2019f December 2019
IP 73.203.52.68
I was wondering if it was possible to be able to export the dates on the Annual Q Cycles to csv files. I see other area's where this is done, so I thought I would ask.
Thanks,
Steve
e-Mail: doug.aacr@gmail.com
.
Date 28th 2020f January 2020
IP 108.91.106.147
Sergey, please add Eris....it's likely the next farther planet ruling Taurus (IMO)
e-Mail: gotpeter
.
Date 29th 2020f January 2020
IP 93.47.228.162
The possibility in Multiplanetary fan (fixed scale) to have time mirroring (the same as in Gann Fan)... I think to see where planetary fan touched previous Hi/Lo could be an help. Thx Pier
e-Mail: ptryde@gmail.com
.
Date 22nd 2020f February 2020
IP 14.0.169.84
Re QF module update, under Time Quanta would you please add Mercury, I notice it relates well to a.o. disruptive product companies like Tesla, Beyond Meat and Virgin Atlantic, thanks.
e-Mail:
.
Date 22nd 2020f February 2020
IP 93.48.244.155
Hi Sergey,
if is it possible to make bigger the fonts in the "astrological prediction techniques".
thanks
Stefano
e-Mail: jaworski@tpg.com.au
.
Date 06th 2020f March 2020
IP 49.177.199.241
Hi Sergey
It would be nice to have an option to have the start point of the Gann Fan tool to be at the zero level (ie $0 either with or without also starting at the price of the click point).
At the moment, even with Precise Charting, it is fiddly to get the desired angle to start at the zero level (unless I've missed something?).
Since Gann spoke a lot about zero angles (esp 1x1 and 2x1), it would be great if creating those zero angles could be made easier for research purposes like Fabio is doing (both in the main window and Precise Charting).
Regards
Gerald
e-Mail: jaworski@tpg.com.au
.
Date 08th 2020f March 2020
IP 49.177.199.241
Dear Sergey
My wish is for the "Intermarket New" tool to include the choice to display the Price Chart (ie the same choice that is currently available in Self Similarity ie View- Draw as a Price Chart rather than just draw as a line).
I'll send a picture to ta_service@rogers.com
Thanks
Gerald
e-Mail: e.amini276@gmail.com
.
Date 10th 2020f March 2020
IP 2.184.139.110
Hi
When i upload BTCUSD historical data an try to find Jupiter+Mars (Helio,1H) cycle i can't open forecast ability it warn me that the historical data not enough
period of cycle 592/95 so in 10 years for BTCUSD historical data i have 3x rule for data so why can't use forcast ability?
is that a bug?
e-Mail: thorton9@earthlink.net
.
Date 10th 2020f March 2020
IP 24.144.74.172
the choice for advanced support resistance lines labels yesterdays pivot as CD.
the current day support resistance line labels as CD as it should
e-Mail: thorton9@earthlink.net
.
Date 10th 2020f March 2020
IP 24.144.74.172
p.s. I am wrong......... found it. need glasses
the choice for advanced support resistance lines labels yesterdays pivot as CD.
the current day support resistance line labels as CD as it should
e-Mail: alon_avramson@yahoo.com
.
Date 19th 2020f April 2020
IP 93.172.111.213
Hello Sergey
I would like to automate the following scenario:
Given a stock symbol, say in a file, the script will load TS, import the price history of X as parameter years from YAHOO/INVESTING, calculate,
set LBC (Z bars from last)
load a template (name as parameter), run the NN modules Y (parameter ) times and generate 2-3 pictures with predefined range before and after LBC.
This sript will enable to generate results by pics for a set of defined symbols
Can some parts be automated?
Can the generation of pictures be with a pre-defined pareters?
Thanks
Alon
e-Mail: rjuneja123@gmail.com
.
Date 21st 2020f April 2020
IP 171.61.222.209
Its been very good of you to have introduced a new tool: Scanner. Always proud of being in the TS group. Yes at this juncture I request you to include the Indian stocks too. Because thats where a lot of us trade . Tks & Best Rgds..
e-Mail: Guydot06@gmail.com
.
Date 01st 2020f May 2020
IP 185.120.125.37
I would like to propose integration of the Rithmic futures data feed into TS. I know this is likely of little interest to you, but respectfully wish to say I think quite a few of our community members will benefit from it as they are engaged with futures. I also wish to add that having been part of a team which did that integration into a custom platform the Rithmic API has been pretty straight forward to implement, and to the best of my understanding has even improved in accessibility with recent R-Trader Pro developments.
Thanks for reading!
e-Mail:
.
Date 05th 2020f May 2020
IP 99.248.28.4
I could also benefit from the option to have a few pre-defined setups for the viewed interval , such that already exist on the NN-backtesting, X before and Y after LBC. Since it already exist maybe it would be easy to add them to the "save picture as..." menu.
Best
Alon Avramson
Stock Market Forecasts
Sergey,
Two more items to wish list. First, if I have too many worksheets it becomes reasonable to make correspondent folder in WORK directory. BUT clicking on Save button saves worksheet in WORK folder only, despite the fact that it was open from another sub-directory.
Second, it would be helpful to make a caution if user saves current worksheet under name which already exists. Hence, it is often situation when one can lose his previously developed worksheet under the same name.
Regards,
Sergey Ivanov
e-Mail: ivserega@gmail.com
.
Date 05th 2020f May 2020
IP 5.181.233.162
Sergey,
Two more items to wish list. First, if I have too many worksheets it becomes reasonable to make correspondent folder in WORK directory. BUT clicking on Save button saves worksheet in WORK folder only, despite the fact that it was open from another sub-directory.
Second, it would be helpful to make a caution if user saves current worksheet under name which already exists. Hence, it is often situation when one can lose his previously developed worksheet under the same name.
e-Mail:
.
Date 05th 2020f May 2020
IP 46.30.152.122
e-Mail: alon_avramson@yahoo.com
.
Date 05th 2020f May 2020
IP 93.172.111.213
I am using the option of saving the picture to file, I find it the most effective to provide the view only to the main application screen without the modules.
I also noticed a few other users use this option to jot forecasts quickly to their channels.
I could also benefit from the option to have a few pre-defined setups for the viewed interval , such that already exist on the NN-backtesting, X before and Y after LBC. Since it already exist maybe it would be easy to add them to the "save picture as..." menu.
Best
Alon Avramson
e-Mail: alon_avramson@yahoo.com
.
Date 05th 2020f May 2020
IP 93.172.111.213
ello Sergey
The attached PDF summaries some of the harmonic patterns available for trading.
As I see it. they are all very much alike, all depending on the AB-BC-CD ratios.
They can be very useful at times to define the D point price level and the price direction following D point once established.
In TPA there is already a wealth of calculations of ratios of last swings.
My question: is there any way we can use TPA and the existing ratios calculation to find such patterns?
Thank you
Alon Avramson
e-Mail:
.
Date 08th 2020f May 2020
IP 118.136.15.14
e-Mail: ivan.panchenko@hotmail.com
.
Date 11th 2020f May 2020
IP 37.21.185.213
Добавить в TS Scanner кнопку рядом с каждым найденным инструментом, при нажатии на которую открывался бы этот инструмент в Timing Solution автоматически с накинутыми проекционными линиями и анализом из сканера. Это удобно для более детального анализа.
e-Mail:
.
Date 15th 2020f June 2020
IP 37.21.238.103
Если скрыта цена после LBC проекционные линии спектра и q спектра (и других модулей) нужно тоже скрывать, иначе они спойлярят цену.
e-Mail: got_@libero.it
.
Date 25th 2020f June 2020
IP 217.138.219.244
In Natural Cycles/Shifted Chart have a button that smooth the shifted line
e-Mail: jaworski@tpg.com.au
.
Date 24th 2020f July 2020
IP 49.177.199.241
With the percentage draw tool, could you please make the arrow point upwards when it is measuring from a low to a high.
At the moment, the arrow points down regardless of whether you measure from high to low or from low to high, so the user may forget which direction is being measured if the arrow points in the same direction.
Thanks
e-Mail: alon_avramson@yahoo.com
.
Date 19th 2020f August 2020
IP 217.132.23.97
Please implement the following option to enable setting the LBC X bars before last price:
RunMacro@SET_LBC_TO_LAST_BAR@100
e-Mail: alon_avramson@yahoo.com
.
Date 19th 2020f August 2020
IP 217.132.23.97
Hi Sergey
Could you please implement the following?
for RunMacro Commands for NN for:
- Setting the projection line thickness
- Set to see the dates of CIT
- Set the NN in inverse view
a RunMacro command to load a specific stock price history ?
e-Mail: got_@libero.it
.
Date 10th 2020f October 2020
IP 37.123.246.93
setting by default the windows of cursor info at minimum (open hi lo close) ...see my mail 10oct2020 19:01 gmt+1
thx Pier
e-Mail: Jeff.leauby@gmail.com
.
Date 03rd 2020f December 2020
IP 69.249.144.72
Hi,
The yellow shaded lines in the spectrum are a greta feature but it's tough to see, is there a way we can have access to change the shading color? Not a big priority but thought it would be nice to be able to adjust the color and transparency
e-Mail: futureeng21@gmail.com
.
Date 03rd 2020f January 2021
IP 125.161.95.19
e-Mail: amt2100@pm.me
.
Date 03rd 2020f January 2021
IP 71.214.122.169
Hi Sergey,
I like the Equity curve in the Astronomy Composite Buy/Sell signals tab. Can you please enable changing the color of the plot so when you run multiple instances of the Composite with different planets, you can see which one is which?
Thank you!
Jim
e-Mail: kudakwashe.chinhara@gmail.com
.
Date 28th 2021f February 2021
IP 82.22.36.2
I am looking at the "Trades" section under "History" in the "Eff. Test" output. Is there a way to add a bar chart (time series) and histogram of the returns?
e-Mail: jeff.leauby@gmail.com
.
Date 07th 2021f March 2021
IP 69.249.144.72
Hi, in the user area where it says "Update to Latest Version" , if there was a column that stated when that version was released, that would be helpful to know if the software I have installed is the latest version or not..
Also - would like to put in a request for IQFeed/DTN data feed integration into TS and Scanner... I know the scanner has a way to get data from yahoo, but I would feel more comfortable if there is a way to pull from DTN, a more reliable source..
Jeff
e-Mail: sstefanoni@ymail.com
.
Date 29th 2021f March 2021
IP 212.66.106.242
Hi Sergey,
change font size in menu astrological prediction tecnique/angle separation.
thanks
Stefano
e-Mail: ndsavino@yahoo.com
.
Date 29th 2021f March 2021
IP 108.35.42.213
Would it be possible to please add 2 digit Year on cycles in the Cycles Box in Q-Spectrum? Currently, when selecting a cycle that is a y (year long cycle) there is only 1 decimal place, previously when selecting a year it would show the cycle in days in the cycle box.
e-Mail: ivan.panchenko@hotmail.com
.
Date 30th 2021f March 2021
IP 5.136.66.159
Sergey, hello! If possible, configure the 'Annual Q Strategy' results to be saved in the program. Now we have to recalculate every time after reopening.
e-Mail: ivan.panchenko@hotmail.com
.
Date 06th 2021f April 2021
IP 5.136.66.159
Bring button "Open minimized module" to the main menu for faster access, it will greatly help those who work on Windows 10.
e-Mail: thorton9@earthlink.net
.
Date 07th 2021f April 2021
IP 65.35.90.161
I would like for workbook to save the settings for natural cycles (intraday workbook)
e-Mail: Sincerely, Corrado
.
Date 14th 2021f April 2021
IP 99.248.4.20
Hi Sergey,
mine is a question about practicality:
- I use the second pc when I am away from home, so saving jobs, histories, charts, etc. I do them on onedrive.
When I go to load the saves, the sw starts from the TS folder and not from where I had looked for them last time.
If that were the case, it would save time.
Sincerely, Corrado.
e-Mail: jnevins@jnevins.com
.
Date 14th 2021f April 2021
IP 24.190.18.37
When I open a new chart, it defaults to "bar", but I prefer "Time", so I always have to switch it too time during the calculation phase... it is a small thing, but I believe TS used to remember your preference and opened the chart with that preference. Another small wish is to have values lower than 5% in the Astronomy Composite...
Thanks,
Jerry
e-Mail: vitaliy.v.ivanov@gmail.com
.
Date 19th 2021f April 2021
IP 85.140.7.183
Simple improvements of NN:
1) add ReLu activation function.
Since the state of the art of Deep Learning has shown that more layers helps a lot, then disadvantage of the Sigmoid function is a game killer.
The derivative of the sigmoid function is always smaller than one. The down side of this is that if you have many layers, you will multiply these gradients, and the product of many smaller than 1 values goes to zero very quickly.
On the other hand the gradient of the ReLu function is either 0 for a<0 or 1 for a>0.
That means that you can put as many layers as you like, because multiplying the gradients will neither vanish nor explode.
2) add ADAM optimizer instead of SGD.
Currently this is the most performance optimizer. Here you can find evolution from SGD to Adam. Details https://medium.com/mdr-inc/from-sgd-to-adam-c9fce513c4bb
3) add capability to identify suitable learning rate. There's simple method discovered just in 2015.
The approach:
a) Starting with small learning rate,
b) Print on the chart the loss value of one sample,
c) Double the learning rate and than again print on the chart the loss value of one sample,
d) Finally get chart with different learning rate and capabilities for the learning.
Details in paper https://arxiv.org/pdf/1506.01186.pdf
4) Add capability to chose which metric to optimize RMSE, MSE, MAE. RMSE more suitable for exponential growth chart, MAE more suitable for prediction over the average.
More complex changes:
Once ReLu activation could be introduced it will be possible to get benefits from additional layers.
Currently supported only one type of layer.
Request to add new types of layers that recommended in Time Series Forecasting. LTSM layers with/without combination of CNN layers.
Details: https://alexrachnog.medium.com/deep-learning-the-final-frontier-for-signal-processing-and-time-series-analysis-734307167ad6
e-Mail: pwaijers@ziggo.nl
.
Date 27th 2021f April 2021
IP 84.105.135.252
When using Meastock daily data I would like the ability for TS version to transform the daily data into weekly, bi-weekly, monthly, quarterly or yearly data as as some stocks/indices are better to analyse in a higher timeframe to analyse the longer term trends as a Gann analist.
e-Mail: nicola.abis.144@gmail.com
.
Date 05th 2021f May 2021
IP 78.15.75.173
Hi sergey,
new statistics on natural cycles is very useful for me, would it be possible to add a button for exporting full calendar on excel? Like the possibility to export a full month of statistics at once.
-It would be great to add also the net gain of these single days (i always build this on excel, so i would save a lot of time)
-it would be great to add "last x months/years/bars". Working on these statistics since many years, looks like on very long term all data tend to 50%, but if you look just last x months or weeks, you find short term strong deviations that lasts for some month and can be used, like a trend that lasts for some period and then disappear.
e-Mail: demirci_1453_mavi@hotmail.com
.
Date 02nd 2021f June 2021
IP 37.39.60.0
e-Mail: A Kumar
.
Date 14th 2021f July 2021
IP 99.248.4.20
Hi Sergey
1. I tried Event Box module for optimizing TPAI significant events but results are better before optimization, so I dropped the idea of using EB module
2. I tried curvature parameter from 1 to 10 (1,2,3...) results are same, there is no change in index/projection line ( I used smooth 0 in all cases)
3. in TPAI statistical criteria ( minimum sample size & critical chi square) can we have 2 options for each, one for slow moving planets & other for fast moving planets , so that for slow moving planets we can select sample size between 1-3 & for fast moving planets above 10, same with chi square
4. In TPAI can we do calculations for Top, Bottom, Big Down, Big UP simultaneously ? at present top & bottom are indicated by red & blue color & there is no color for big up/down , my idea is : index/projection line itself will indicate top ,bottom, big up, big down indicated by 4 different colors
5. if my main objective is to identify future dates of top, bottom & big up/down based on astronomical phenomena which model other than TPAI you would suggest ?. I am not keen to use any astro cycle, I love the idea of using multiple combination of astrological/astronomical phenomena like we do in TPAI, any other model where we can do similar calculations ?
RegardsAnup On Tuesday, 13 July, 2021, 05:57:27 pm IST, A Kumar wrote:
e-Mail: Terrencetan@yahoo.com
.
Date 26th 2021f July 2021
IP 49.199.246.244
Hi Sergey,
When deleting items from the Charting Panel, we have to select the item then click - using the mouse. This is a slow process when I have lots of items to delete when updating a chart. Is it possible to do this using the keyboard using arrow and delete on the keyboard.
I have noticed this can be done on the keyboard (ie. deleting items off the Charting Panel) in the Precise charting module. Was wondering if the same can be implemented in the Main Module.
Thank you,
Terrence
e-Mail: pwaijers@ziggo.nl
.
Date 08th 2021f August 2021
IP 84.105.135.252
Hi Sergey, I would like to be able to plot the averages of 5, 6, 8 planets longitudes together both in Geo and Helio, in the planetary fans module.
Which are known as the:
Circle/Cycle of Eight planets, This is an average of the geocentric/heliocentric longitudes of Mercury, Venus, Mars, Jupiter, Saturn, Uranus, Neptune and Pluto.
Mean of Five planets : Jupiter, Saturn, Uranus, Neptune and Pluto averaged for both heliocentric and geocentric longitudes
Mean of 6 planets:Mars, Jupiter, Saturn, Uranus, Neptune and Pluto averaged for both heliocentric and geocentric longitudes
W.D. Gann talked about this in his Soybean letter of 1954.
Patrick Mikula talked about this in his book Ganns Scientific Methods Unveiled (how this is implemented): Volume 2 (pp. 28-33). Mikula Forecasting Company. Kindle Edition.
In Optuma this can be done easily : see this tweet from Olga Morales: https://twitter.com/AstroGann33/status/1424153226790674434?s=03
e-Mail: anuj.jain32@gmail
.
Date 04th 2021f September 2021
IP 223.233.69.236
Hello sergy,
Can we have file/ save/ excel tool in TS scanner.
Thanks and regards,
Anuj jain
e-Mail: kasabehm@gmail.com
.
Date 04th 2021f September 2021
IP 77.243.191.215
e-Mail: Terrencetan@yahoo.com
.
Date 29th 2021f September 2021
IP 49.199.21.23
Is it possible to load a (excel) file for Day counter instead of manually using the tool to do counts ?
Eg. maybe the file can be like : startdate1, enddate1
startdate2,enddate2........
Thank you.
e-Mail: sstefanoni@ymail.com
.
Date 08th 2021f November 2021
IP 93.34.92.79
add the value on "carting panel" and "choose figure" for "percentage+counter", when added multiple items , they are anonymous and we need to click on each to select the correct.
thanks
Stefano
e-Mail: hlygson@gmail.com
.
Date 13th 2021f November 2021
IP 99.248.4.20
Hi Sergey and teem -
I wanted to ask about a little programming part ...
Here in the picture, I show the problem in short.
- Is it possible to get a price day (candle) into a 24-hour frame vs the calendar day?
Hlynur
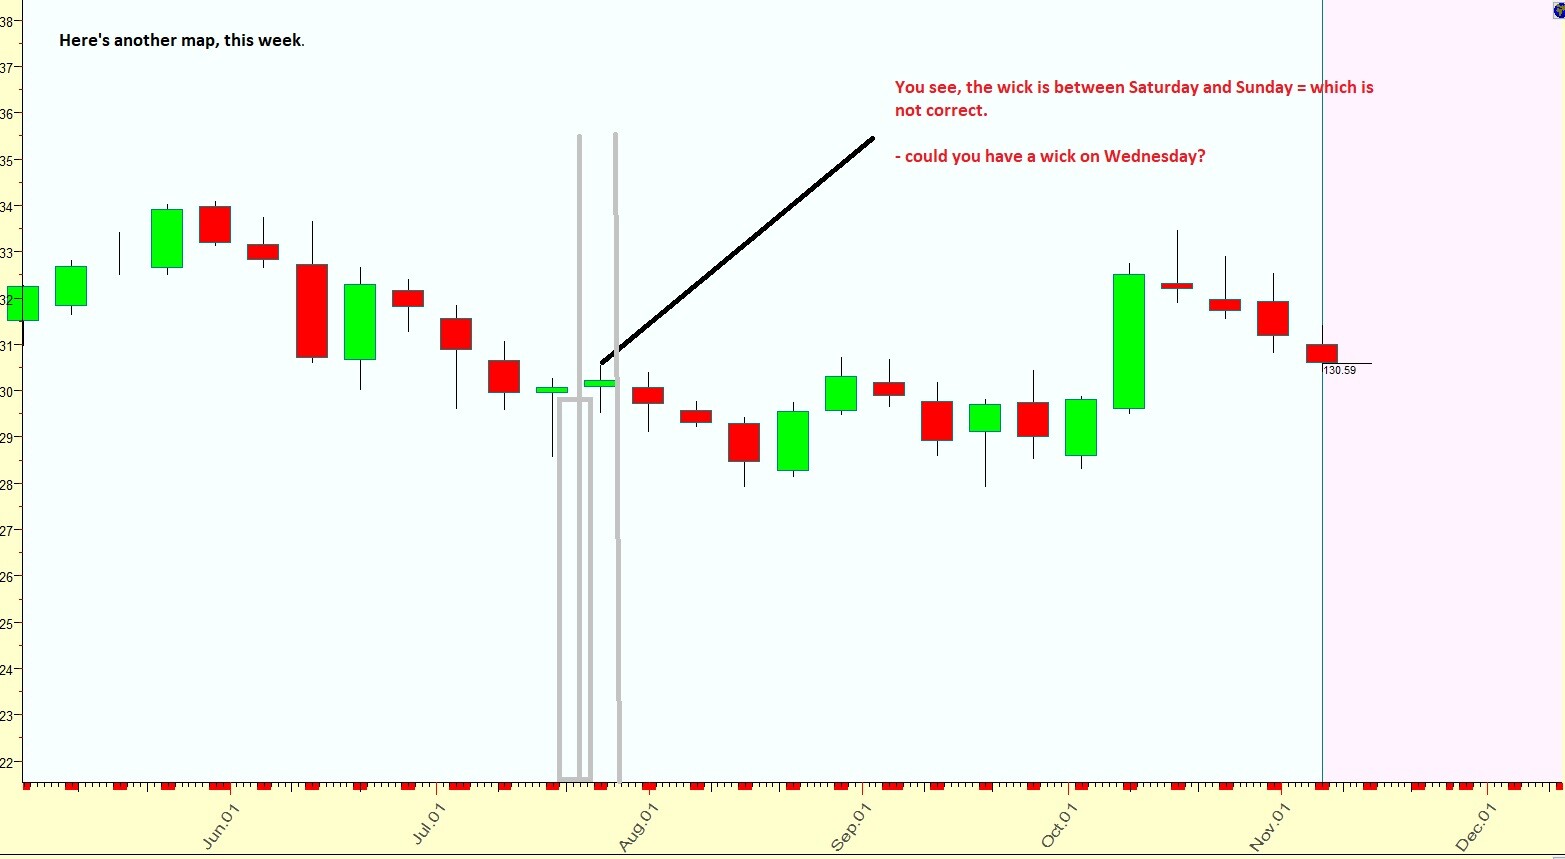
e-Mail: dickiebeardsmore@gmail.com
.
Date 21st 2021f November 2021
IP 99.242.17.181
1- be able to save similarity studies so that they are NOT wiped out when the price data is updated.
2- be able to name any study the same way that similarity studies can be named but have the names NOT dissapear whenever the chart/ file is closed and reloaded.
e-Mail: dickiebeardsmore@gmail.com
.
Date 23rd 2021f November 2021
IP 2.57.169.51
1- be able to save similarity studies so that they are NOT wiped out when the price data is updated.
2- be able to name any study the same way that similarity studies can be named but have the names NOT dissapear whenever the chart/ file is closed and reloaded.
e-Mail: dickiebeardsmore@gmail.com
.
Date 28th 2021f November 2021
IP 99.242.17.181
1- be able to save similarity studies so that they are NOT wiped out when the price data is updated.
2- be able to name any study the same way that similarity studies can be named but have the names NOT dissapear whenever the chart/ file is closed and reloaded.
e-Mail: dickiebeardsmore@gmail.com
.
Date 28th 2021f November 2021
IP 99.242.17.181
1- be able to save similarity studies so that they are NOT wiped out when the price data is updated.
2- be able to name any study the same way that similarity studies can be named but have the names NOT dissapear whenever the chart/ file is closed and reloaded.
e-Mail: dtc_jacobs@hotmail.com
.
Date 29th 2021f November 2021
IP 80.112.195.180
Hi Sergey,
Three suggestions for Q-spectrum2 (including Bartels):
- an option to toggle the committee line on and off. Now it seems always present when selecting more than one cycle.
- an option to automatically select the cycles that coincide with the harmonics of a selected cycle. To give an example. Let's assume that Q-spectrum2 shows that price seems to follow the 900 day cycle. In that case, Q-spectrum2 allows to see easily the harmonics of the 900 cycle by the vertical lines in the screen, which is very helpful. It would be nice if these cycles could be automatically selected by TS (and to have some options to choose which harmonics are selected)
- the third suggestion relates to keeping the harmonical cycles present after switching to a lower timeframe. In the example metioned above: if I switch to the 1 hour timeframe and calculate q-spectrum2 (including Bartels) again, TS does not make it easy to see or select the harmonical cycles of the 900 day cyles if the 900d cycle falls beyond the scope of the calculated cycles. It would be helpful if there was an option to automatically view and select the harmonics of a cycle, even if that cycle is not present in the cycles that were calculated by Q-spectrum2 or Bartels.
Thank you in advance!
e-Mail: tibor@balcab.ch
.
Date 18th 2022f January 2022
IP 84.17.52.143
Hello Sergey,
I hope you are doing fine!
Another "plea/wish" of mine:
Can you do an option in FOURIER STRING to give different colors to the OVERTONES-cycles? Right now (18-Jan-2022) one can choose colors for the regular FOURIER, and also ONE OTHER color for ALL OVERTONES. So if I use 4 overtones, ALL OF THEM have the SAME COLOR.
- If you have time, can you change it to give DIFFERENT COLORS for EACH OVERTONE?
(my first "wish" was if you can give option for us to choose from CUSTOMIZE COLORS in ULE - and Fourier/etc - where it is NOT possible right now.
example: ASTRONOMY (composite) does not allow to choose from CUSTOM colors, but a fixed amount of colors, whereas in ASTROL FONTS one CAN choose from CUSTOM COLORS/etc)
best regards, Tibor.
e-Mail:
.
Date 01st 2022f February 2022
IP 82.84.198.85
Hello Sergey, it would be great adding the backtest equity line in QBOX... it makes much easier to understand result and profit distributions of the signal... i have some problems in using this module because i can't see the equity line and prefer older modules or stat efficiency just for this reason!
thank you
e-Mail:
.
Date 06th 2022f February 2022
IP 185.59.246.12
e-Mail: Sergey Khokhlachev
.
Date 06th 2022f February 2022
IP 185.59.246.12
Добрый день, Сергей!
Слова благодарности за объемную и функциональную программу!
64x версия работает быстрее, но иконки очень маленькие, изменение в настройках дисплея увеличивают незначительно. В качестве монитора использую большой телевизор.
Спасибо и удачи!
e-Mail: tibor@balcab.ch
.
Date 06th 2022f February 2022
IP 84.17.52.175
Hello Sergey,
I hope you are doing fine!
Another "plea/wish" of mine:
Can you do an option in FOURIER STRING to give different colors to the OVERTONES-cycles? Right now (18-Jan-2022) one can choose colors for the regular FOURIER, and also ONE OTHER color for ALL OVERTONES. So if I use 4 overtones, ALL OF THEM have the SAME COLOR.
- If you have time, can you change it to give DIFFERENT COLORS for EACH OVERTONE?
(my first "wish" was if you can give option for us to choose from CUSTOMIZE COLORS in ULE - and Fourier/etc - where it is NOT possible right now.
example: ASTRONOMY (composite) does not allow to choose from CUSTOM colors, but a fixed amount of colors, whereas in ASTROL FONTS one CAN choose from CUSTOM COLORS/etc)
best regards, Tibor.
e-Mail: cenkle.112@gmail.com
.
Date 11th 2022f February 2022
IP 188.236.151.121
l want to demo timing solution
e-Mail:
.
Date 25th 2022f April 2022
IP 65.35.90.161
e-Mail: matteo.innocenti47@gmail.com
.
Date 11th 2022f June 2022
IP 5.171.96.159
Hi, when I compute cycles using Q-spectrum I often find peaks in inverted cycles. However, when I display it on the chart I see that that they overall provide better correlation with the price in normal mode (as before the LBC). I'd like to have the chance of keeping the inverted cycle as normal even after LBC.
Thank you,
Matteo
e-Mail: Joel Kreger
.
Date 16th 2022f June 2022
IP 23.92.29.22
On TSMobile the way the graph works bothers me. I always like to put the cursor on the potential turning points but when I do that, the price chart disappears and other unchecked indicators start popping in and out of view. I would like a stable diagram that stays the way I set it. When I uncheck something, I don't want to see it pop into view. It seems that the diagram is trying to do me favors that I didn't ask for.
In a related issue, the cursor has a geometric shape for each indicator line such as a small circle, square or triangle but the corresponding indicator checkbox area for an indicator does not have the shape. If the purpose of the shapes is to help distinguish between colors that are similar, then the shapes should be on the right side also.
e-Mail:
.
Date 26th 2022f June 2022
IP 27.96.211.172
e-Mail: dariuszkopec5@gmail.com
.
Date 08th 2022f September 2022
IP 82.102.46.32
e-Mail: dariuszkopec5@gmail.com
.
Date 11th 2022f September 2022
IP 82.102.46.47
e-Mail:
.
Date 13th 2022f September 2022
IP 99.248.50.97
Secondly, Missing the most viewed option in download from the internet as it was before. Can I request here to return it back?
Thanks and regards,
Anuj Jain
_._,_._,
e-Mail: Oshaieverett@gmail.com
.
Date 18th 2022f October 2022
IP 47.144.227.198
e-Mail:
.
Date 07th 2022f December 2022
IP 84.121.2.230
e-Mail: calanquer@hotmail.com
.
Date 07th 2022f December 2022
IP 84.121.2.230
e-Mail:
.
Date 10th 2023f January 2023
IP 65.35.90.161
e-Mail:
.
Date 10th 2023f January 2023
IP 65.35.90.161
planetary lines, view, Mark + does not hold a yes check from one use to another. thanks
e-Mail:
.
Date 21st 2023f January 2023
IP 99.248.50.97
Close line in charting tool
e-Mail: hlygson@gmail.com
.
Date 04th 2023f February 2023
IP 46.182.187.175
I would like to make a request regarding Intermarket pattern similarity up to one week of recognition.
It would be good to have the possibility to choose a time frame when looking at the possibility of a match, e.g. days + weeks.
Is this possible?
Thank you.
e-Mail:
.
Date 11th 2023f February 2023
IP 182.48.206.44
e-Mail: stepanovmoscow@yandex.ru
.
Date 01st 2023f April 2023
IP 31.185.7.35
Good afternoon, Sergey!
I watched the video on YouTube. Thanks for the reply.
But ...,
to my regret, you did not hear me in my message that I suggested optimizing the working time with the NEURAL NET module, and not the option "TEMP" folder (temporary solution templates) to save settings.
You offer an option how to save my settings in the "TEMP" folder and search for the "TEMP" folder every time you use new trading quotes and new trading tools, download and perform RANDOMIZE NN. This is not time-efficient, but it is a good and additional solution if the user has no memory. And this also happens.
My suggestion was to increase productivity in work, and to do this, make the DEFAULT button. Select 1 time and constantly use these settings immediately after opening the NEURAL NET module by clicking the TRAINING button. This saves a lot of time when you use 2 or more trading instruments with new trading quotes every day.
I heard you
that smoothing is used in other modules like ASPECT.
If smoothing is used in other modules, like ASPECT, then in this case I suggest installing the RESET button. The reset button next to the DEFAULT button is needed in any case to reset all settings at once, including in the NEURAL NET module, indicated by the red arrows in the figure.
I may be wrong, but I think that the settings of two modules, like the NEURAL NET module and the ASPECT module, should not overlap and each module should be able to configure and reset its settings separately, independently of each other. The NEURAL NET module and the ASPECT module should have their own DEFAULT and RESET buttons. For me, this is logical, but for the developer I think that it is an additional waste of time for revision, alteration. It's possible that I'm wrong.
Sergey, the "TEMP" folder is only an option, but this solution does not optimize the load in the user's work, but increases it. Using the "TEMP" folder does not improve performance when working with the NEURAL NET module. Then, in this case, it will be less costly to continue to constantly select the parameters indicated by the arrows in the figure for each instrument every time the trading quotes are updated.
Then the world idea breaks down – the introduction of Artificial Intelligence, which should help a person to live easier and spend less time.
Quote: "The integration of AI into mechanisms and systems allows you to automate routine, time-consuming or complex processes, including improving their accuracy and productivity."
With respect,
Stepanov Dmitry
Добрый день, Сергей!
Посмотрел видео на Ютуб. Спасибо за ответ.
Но…,
к моему сожалению, Вы меня не услышали в моем сообщении, что я предлагал оптимизировать время работы с модулем NEURAL NET, а не вариант папка «TEMP» (шаблоны временных решений) для сохранения настроек.
Вы предлагаете вариант, как можно мои настройки сохранить в папке «TEMP» и каждый раз при использовании новых торговых котировок и новых торговых инструментов искать папку «TEMP», загружать и выполнять RANDOMIZE NN. Это не эффективно по времени, но хорошее и дополнительное решение при отсутствии памяти у пользователя. И такое тоже бывает.
Мое предложение было повысить производительность в работе, а для этого сделать кнопку УМОЛЧАНИЕ. Выбрать 1 раз и постоянно пользоваться этими настройками сразу после открытия модуля NEURAL NET, нажав кнопку TRAINING. Это экономит большое количество времени, когда каждый день используешь в работе от 2 и более торговых инструментов с новыми торговыми котировками.
Я Вас услышал,
что сглаживание используется в других модулях, как ASPECT.
Если сглаживание используется в других модулях, как ASPECT, то на такой случай предлагаю установить кнопку СБРОС. Кнопка сброс радом с кнопкой УМОЛЧАНИЕ нужна в любом случае, чтобы обнулять сразу все настройки, в том числе в модуле NEURAL NET, указанные красными стрелками на рисунке.
Возможно, я ошибаюсь, но считаю, что настройки двух модулей, как модуля NEURAL NET и модуля ASPECT, не должны пересекаться и у каждого модуля должна быть возможность настраивать и сбрасывать свои настройки отдельно, независимо друг от друга. У модуля NEURAL NET и модуля ASPECT должны быть свои кнопки УМОЛЧАНИЕ и СБРОС. Для меня это логично, а для разработчика думаю, что дополнительная трата времени на доработку, переделку. Возможно, что я не прав.
Сергей, папка «TEMP», это только вариант, но данное решение не оптимизирует загрузку в работе пользователя, а увеличивает. Использование папкой «TEMP» не повышает производительность в работе с модулем NEURAL NET. Тогда в таком случае менее затратно будет продолжать каждый раз при обновленных торговых котировках для каждого инструмента постоянно выбирать параметры, указанные по стрелкам на рисунке.
Тогда ломается мировая идея – внедрение Искусственного Интеллекта, который должен помогать человеку проще жить и меньше тратить времени.
Цитата: «Интеграция ИИ в механизмы и системы позволяет автоматизировать рутинные, трудоемкие или сложные процессы, в том числе повысить их точность и производительность».
С уважением,
Степанов Дмитрий
e-Mail: test@test.com
.
Date 2023-May-15
IP [::1]:64332
MISHAMISHAMISHA
e-Mail: test@test.com
.
Date 2023-May-15
IP [::1]:64375
asdsadasdsadasdsa
e-Mail: tsmobile@tester.com
.
Date 2023-May-15
IP 127.0.0.1:37902
TESTING TESTING TESTING
e-Mail: Terst
.
Date 2023-May-30
IP [::1]:49510
Test
e-Mail:
.
Date 2023-Jun-27
IP 127.0.0.1:40506
to planetary lines / view / mark
allow default button to save yes check box on 'mark'
e-Mail: fxwavez@gmail.com
.
Date 2023-Jul-04
IP 127.0.0.1:54790
Hi Sergey,
I work with the Natural Cycle module every day, it would be nice if, after making the main window bigger, you could also make the font bigger. It would also be helpful if you could export the left window (APZ) as Excel, just a thought or "wish"
Greetings Stephan
e-Mail:
.
Date 2023-Jul-11
IP 127.0.0.1:56816
On the face of the program is a section for the charting panel. Currently you can turn this off by deleting it. I don't want to do that I'd like to just blank it out long enough for me to see other things on the chart.
I know you can open it up and check off boxes etcetera but I have quite a few boxes. I just need a temporary on off switch in a convenient location. thank you
e-Mail:
.
Date 2023-Aug-01
IP [::1]:40170
Hi, if is it possible to add the minutes time calc similar to count bars tool. In this way is more readable than percentage tool when there are multiple lines.
thanks
regards
Stefano
e-Mail: hlygson@gmail.com
.
Date 2023-Aug-16
IP 127.0.0.1:50992
I have some speculations here .... I have been looking for this possibility but haven't found anything, maybe you know better and can give advice?
- I want to use the "Fibonacci channel" that is based on a slope ... my question is is this possible in TS?
(here before I used a lot of "Trading view" and this is easily done there and shouldn't be a very complicated operation here)
Sincerely -
Hlynur Chadwick
e-Mail: rajeshjvasoya@gmail.com
.
Date 2023-Sep-03
IP 127.0.0.1:37148
Hi, is it possible to add ANCHORED VWAP in the indicator list?
Thanks.
e-Mail: hhl3rd@suddenlink.net
.
Date 2023-Sep-12
IP 127.0.0.1:46466
With respect to the recent Intermarket Module , the width of the output list (top entry always lag=0) does not allow viewing the (Inv) flag if hourly bars , 15 min bars or any intraday time data is used.
This field could be widened so the qualifiers can be viewed. Normal correlation could be red and inverse blue same as in WFA outputs. The correlation coefficient number R used for ranking may
be useful. The ability to highlight the listbox output to copy to clipboard will be useful for research purposes of identifying stable lookback intervals. Haytham in WITS presented some examples
but did not reveal the algorithm. Delta Phenomenon mentions a 4 calendar day cluster repeating directly or inversely. A better metric may be trading days or weekdays. Price numbers projected
in time will produce restricted examples (not whole projection lines) if the time scale is properly constructed. Just finding boundary locations is fine for trading and the projection line goal could
be a bit optimistic given the uncertainty principle involved in vibrating systems with a large random vibration component. The intraday "noise" from the viewpoint of the outside observer is huge.
From the manipulator's viewpoint it is not noise. So fooling around with intraday data which can be set at will and without restriction by large trade desks with the right permissions and memberships
seems a waste of time on the surface but every trader has to contend with entry and exit sometime during a day. The trade desk(s) operate with a limited set of proven procedures with a limited
set of purposes in mind. So price patterns are likely to repeat given similar conditions. There may be useful repeats that the computer can find , maybe timed to 45 calendar day FED FOMC cycle ?
though I would much favor Venus ingress cycles or Moon in Cancer the market may not see it that way given all the unearned FED money created and channeled into the markets. Perhaps a display
option to widen the output box could be provided if the output panel width is being restricted to accommodate cell phone displays. Having the box extend down enough to get a screen shot .png
file would help avoid copying the entries by hand.
Next intraday topic: It is now possible to bin tick data into tick bars , volume bars and range bars (unirenko is special case) . Volume bars seem most important to me because the trade desk
employees are paid according to how much profit they take in and that depends almost solely on the volume they can steal for their own positions. It costs the desk the same to move the ES
20 points whether the desk is holding 1 contract or 240,000 contracts but the desk makes 240,000 x as much with the larger position. When I took thermodynamics it was quite forcefully stated
that time is not a thermodynamic variable, The same principle shows up in the cobweb model of price change in economics. ( A lot of economics / econometrics is borrowed from chemistry / molecular physics topics.) Trade volume binned into price bars is an economic/thermodynamic variable (volume on X axis , price on Y axis). Cyclical repeats should appear in a spectral model. This may just be the
preferred sizes the trade desk(s)/syndicate of desks wants to accumulate but that is useful information to know. When executing this analysis in ES for 10000 contract bars , I'm not confident that the
spectral analysis is done on the bars(volume counts) and their price amplitudes and not on an inferred or interpolated time bar substitute even though the chart was set to bars. The projection line
X-axis values are in date-time units not bar counts. I'm not sure that this is what you intend. This is not an analysis I would do more than once in about 90 days and not a high priority. I don't see
a reason why an analysis can't be done barwise instead of timewise if that is desired for some special case / data set. Similar volume considerations are published in "Trades About To Happen" by David Weiss
I do not see a facility in Wish list for appending some test data files. I found collecting real time tick data to be destructive to SSD hard drives due to Microsoft Windows use of a hard drive memory buffer that the data collection is programmed to use and this can't be reset or avoided. Some Samsung drives allow setting a write buffer size (upward) which dramatically reduces the number of writes and overwrites
to each sector. The SSDs can only tolerate about 6 overwrites so SSD use as a RAM extension is not appropriate but can't be avoided using Microsoft programs. This wish is more along the lines of having
TS perform well and give proper output than an expression of high value in the study of intraday data for creation of a projection line.
Ok , so the microcosm of tapping intraday activity (high price change per time change region) corresponds to microcosm of tapping nuclear energy. It's not as easy as burning wood but we have to try ?
Thanks
Herb Land
e-Mail: p.halczak@gmail.com
.
Date 2023-Oct-05
IP [::1]:47394
Is it possible to add regression channel function and parallel lines of standard deviations of the regression line?
e-Mail: mauriceseguin@protonmail.com
.
Date 2023-Oct-20
IP 127.0.0.1:33672
Hi Sergey
It would be great to have the Vedic/Jyotish south node, Ketu, as a item equivalent to a planet.
Just north node + 180° in H1 (D1) chart. Maybe there is a way to do that now which I don't know?🤔
Love your software.
Best wishes
Maurice
e-Mail:
.
Date 2023-Oct-20
IP [::1]:43110
When you choose 'update automatically' while saving the model and open it in some time you will get 'Updated!' dialog...
Is it possible to remove/avoid 'Updated!' dialog once you open the model?
Thanks in advance,
Evgen Odrina
e-Mail: jeff.leauby@gmail.com
.
Date 2023-Oct-31
IP 127.0.0.1:60270
Feature request: to have the OHLC data visible somewhere on the screen, ideally when the mouse pointer is in alignment with a particular candlestick/bar.
One idea - when the mouse is hovering over a particular candle/bar , there already is a box that appears towards the top of the screen that lists the date and day - example "10.31.23 TU" , now if it could read "10.31.23 TU, O:100.5 H:101.25 L:99.5 C:100.65" that would possibly a good way to see the OHLC data.
This OHLC data I need to reference for various reasons and I can't seem to find an easy way in the software, the only way seems to line up vertically with a price bar and look at the price reading but I'm not sure if I'm actually getting the exact low or high ,etc of the price bar
e-Mail: 9692266@gmail.com
.
Date 2023-Nov-12
IP 127.0.0.1:55640
Please make it possible to fractal a circle in your charting tools to create a flower of life, as you have implemented a Gann square "prolong". I will also send you an email ts_service@rogers.com with screenshots ... thank you =)
Jiminy Lummox
e-Mail: jemanville@gmail.com
.
Date 2023-Nov-15
IP [::1]:33248
Hello Sergey,
I want to try to guess to the AI the target price with your composite indicators
Please let output the screen values
In Delphi (I guess this is your program language), there is a getpixel function
Please read the pixel status for each composite on screen and output them to CSV
https://docwiki.embarcadero.com/Libraries/Sydney/en/Vcl.Graphics.TCanvas.GetPixel
Thanks
Jocelyn
e-Mail:
.
Date 2023-Nov-16
IP [::1]:40546
advanced support resistence should include yearly pivots and if you really want to get into it..... quarterly. Also many services use pivot S1 S2 S3 and R1 R2 R3
e-Mail: martin@biber.net
.
Date 2023-Nov-21
IP 127.0.0.1:37598
Hi Sergey,
In the module Natural Cycles, the LBC is set to Final. I changed it and saved the workbook. When I reopen it, it is back to Final. The same is true when the I change it to backtest and then click on the default button. I think it would make sense to allow us to have it saved in the backtesting mode.
Best regards,
Martin
e-Mail: martin@biber.net
.
Date 2023-Nov-30
IP 127.0.0.1:37636
Hi Sergey,
Could you add ROC lag to the first step of the NN Module? Or is it the same metric like ROC Williams R%? In this case I would wish that it got renamed that we know it is the same. Thank you.
Best regards,
Martin
e-Mail:
.
Date 2023-Dec-12
IP [::1]:58410
From Topic: https://timingsolution.groups.io/g/main/topic/103102682
Still missing in the calendar if the aspect is more positive or negative. As you can see all aspects are equally weighted.
However using the Turning Points Astro Indicator calculates if the aspect is positive or negative. This would be a good addition if these weights can be included in the calendar.
e-Mail: martin@biber.net
.
Date 2023-Dec-19
IP [::1]:37468
Hi Sergey
you asked me to send my wish that the font size of the y-axis can be changed to this list. the x-axis works perfectly.
Thank you
Martin
e-Mail: ce.sschen@gmail.com
.
Date 2024-Jan-20
IP 127.0.0.1:33168
CYCLE SEASONAL CHARTS
Like this example:
https://charts.equityclock.com/dow-jones-industrial-average-10-year-cycle-seasonal-charts
e-Mail: andrew.gibbs777@gmail.com
.
Date 2024-Jan-21
IP [::1]:56734
Is it possible to generate pine script code for the projection line from timing solution, so it can be copied and pasted into Tradingview, and viewed on a tradingview chart?
It wouldn't need to be anything special, just a table with the raw data would be sufficient, I.e date, time, value. The projection line would be static in trading view and viewed as an indicator.
Not just tradingview either, Tradestation, metatrader, multicharts etc, but tradingview very popular.
e-Mail: Mariosteidl@gmail.com
.
Date 2024-Jan-24
IP 127.0.0.1:35404
I was going to suggest this for the wish list, but then wanted to check if perhaps it already exists in the tool.
I would like to be able to select highs and lows on a chart. (Similar to what you can do when you are looking at planetary lines and optimisation function - where you can click on highs and lows on chart.
Then I would like to be able to select an option which displays the date and price of this on the chart
Another option which when selected would also show the time periods between the last low to the next high or between the two selected points. (Also would be nice if we could have a drop down on this selection option to choose if it is days, weeks, months or choose planet to show the planetary degrees between these 2 points.
Something like this: But if you change the time option it will automaticalyl calculate the planet degrees for the chosen planet.
Then I would like to be able to clcik on xls download which will download the selected points, (with the date, price, and time period from the prior selected point. This will allow me to quckly makr up highs and lows and time perido between and doanload and analyse them in an xls.
Could you let me know if this is already possible, or if we should add this to the wishlist, and I will send to the wishlist email address.
Many thanks
image.png
e-Mail:
.
Date 2024-Feb-01
IP [::1]:59560
How to incorporate multiple planetary speeds into the model for turning points? And how to input other astro phenomenom as well? Is that in the model tab?
e-Mail: terrencetan@yahoo.com
.
Date 2024-Feb-07
IP 127.0.0.1:37724
Currently the projection line in the Intermarket module is a line based on Closing price.
Can we please have an option to see that projection line as a Candlestick as well.
This is because the current projection line based on closing price might not catch the true top or bottom if that day is a reversal day.
Thank you.
e-Mail: pularis@gmail.com
.
Date 2024-Feb-07
IP [::1]:49528
Hi,
When using TS Mobile, can the Predictable Zones output be exported as a csv file so it can be used in watchlists etc. or further filtered in excel.
Thanks
Himanshu
e-Mail: pularis@gmail.com
.
Date 2024-Feb-07
IP [::1]:43338
Hi,
When using TS Mobile, can the Predictable Zones output be exported as a csv file so it can be used in watchlists etc. or further filtered in excel.
Thanks
Himanshu
e-Mail: thorton9@earthlink.net
.
Date 2024-May-15
IP 127.0.0.1:59968
natural cycles, shifted chart
I would like a duplicate of shifted chart options so I can use 2 choices plotted , simultaneously. Thankyou. If there is a ULE way to do this for my self , I'll take that also, (view/ day/ days back)
e-Mail: balabhadrasudhakararao@gmail.com
.
Date 2024-May-18
IP 127.0.0.1:43788
India how can get your software per year how much subscription India rupee.
e-Mail: gxtommie@gmail.com
.
Date 2024-May-23
IP 127.0.0.1:33764
I hope to add the difference between 32-bit and 64-bit icons. Because sometimes I open multiple windows and forget which one is 32-bit. The format of 32-bit saving is different from that of 64-bit. (Although removing the 1 of wts1 works)
e-Mail: dronin_d@mail.ru
.
Date 2024-Jun-19
IP [::1]:51826
Sergey good afternoon, please add the CNY/RUB ticker to the TS Datafeed Forex, thank you
e-Mail:
.
Date 2024-Jul-11
IP 127.0.0.1:46252
Hello
can you please add http://www.timingsolution.com/TS/User_Area/atlas.zip or incorporate it right into TS.
Actually the reason I ask this is many locations are missing, including big cities in Vietnam, such as Ho Chi Min City, (Saigon) and even Dak Lak : Area: 13,062 km² Capital: Buon Ma Thuot Population: 2.127 million (2019)
If there is a way to manually update the atlas file ourself, that's fine, as I can get GPT to insert alot of the data. but for now, I find it hard to work with some cities.
e-Mail: Tommie
.
Date 2024-Jul-15
IP 127.0.0.1:49170
For the NN model, after I set the LBC calculation, can it display a marker like the spectrum to show where I set it? Because every time I want to review my previous NN model, I forget where I set the LBC.
e-Mail: Tommie
.
Date 2024-Jul-17
IP 127.0.0.1:41712
Save viewed TZ into worksheet
e-Mail: Jonathan Johnston
.
Date 2024-Jul-29
IP [::1]:60422
Dear Sergey,
I hate to bother you when you are on holiday. I see that the group won't leave you alone 😆
Please, no rush to answer or reply. I hope you are both having a lovely time.
My question is regarding the planetary fans. I can customise price per degree in planetary lines module but I was wondering if it was possible to do the same on fans. I have looked but cannot seem to see a customise option unless I am not looking in the correct place. (Very possible) Basically I would like to be able to input my musical vibrations and not use the standard ratios of 1dollar , 10 cents, 1 cent etc... Any way to customise this so I can change the inputs?
Again, please no rush to reply. Have a lovely holiday but just wanted to ask you when it was on my mind.
Kindest Wishes to you all,
Jonathan
Jonathan Johnston
e-Mail:
.
Date 2024-Aug-27
IP 127.0.0.1:43028
Hello Sergey,
I'm using TimingSolution in intraday on stocks and I'm wondering if it is possible to add the pre/post market datas with Yahoo?
It seems the parameter includePrePost must be set to true
https://query1.finance.yahoo.com/v8/finance/chart/TSLA?range=1mo&interval=5m&indicators=quote&includeTimestamps=true&includePrePost=true&corsDomain=finance.yahoo.com
When I'm setting it manually, it does not seems to work
https://timingsolution.groups.io/g/main/message/39902
If it is easy for you, please try to add this functionality because the spectrum analyzer would forecast better I think
Thanks
Jocelyn
_._,_._,_
________________________________________
Groups.io Links:
You receive all messages sent to this group.
View/Reply Online (#39902) | Reply To Group | Reply To Sender | Mute This Topic | New Topic
Your Subscription | Contact Group Owner | Unsubscribe [timingsolution17@gmail.com]
_._,_._,_
e-Mail: aaa4a4@hotmail.com
.
Date 2024-Sep-20
IP [::1]:52178
Hello,
I have been waiting for more than a year for your offers, whether at the end of the year or on Black Friday. However, it seems that your prices remain the same.
I am a student, and the cost of the program is very high for me. Are there any specific times when you offer discounts, or do you provide special offers for your customers? I would be very grateful.
---
e-Mail: jgavrity@gmail.com
.
Date 2024-Sep-30
IP 127.0.0.1:48888
Sergey I going to put this om the wish list ! I Wish for A collaboration between Timing Solutions and Larry R. Williams. This could bring some powerful new tools to the table. Larry R. Williams is renowned for his trading indicators. Integrating them into Timing Solutions could offer users even more robust analysis options. I will open my wallet for that one. Oh I wish.
Stocks
• 1 Williams Accumulation Index
• 2Williams True Seasonal
• 4 Williams Money Flow Index
• 5 Williams Pinch/Paunch
• 6 Williams Sentiment Index
• 7 Williams VixFix
• 8 Williams WillVal
• Futures
• 9 Williams_NS COT Commercials Net Positions
• 10 Williams_NS COT Commercials Index FC
• 11 Williams_NS COT Large Spec Index FC
• 12 Williams_NS COT Large Spec Net Positions
• 13 Williams_NS COT Large Spec Open OI
• 14 Williams_NS COT Small Spec Index
• 15Williams_NS COT Small Spec Net Positions
• 16 Williams_NS POIV
• 17 Williams_NS ProGo Professional
• 18 Williams_NS ProGo Public
• 19 Williams_NS WillStop
e-Mail: gxtommie@gmail.com
.
Date 2024-Oct-08
IP 127.0.0.1:54676
Hello, Sergey and team. Can neuralnet generate a curve directly from the calculation results? Because I found that after I made two neuralnets and saved the file, it took a long time to load the next time I opened it.Is this possible? Like alphee system software, if it can be exported as a strategy, will it be faster to open it next time?
Thank you very much for your hard work and dedication.
have nice day
——Tommie
e-Mail: gxtommie@gmail.com
.
Date 2024-Oct-08
IP [::1]:53852
Can easy expert add a setting so that it can be backtested when it is turned on? Because every time I open it, it is final and I need to manually set up backtesting.
Thanks to Sergey and his team for their hard work.
Have a nice day~
——Tommie
e-Mail:
.
Date 2024-Oct-30
IP 127.0.0.1:53380
Bradley into Strategy - save into worksheet
e-Mail: adonissingh@gmail.com
.
Date 2024-Nov-21
IP [::1]:49800
Hello Sergey and TS Team,
Please if you could add the following two features to the Gann Square charting tools, that would be great:
1) Addition of angles 3/1, 1/3, and 4/1 and 1/4. And check boxes in the settings to switch them on and off.
2) The ability to click and drag the Gann Square across the chart, kind of like Gann's Square plastic overlays.
Thank you,
Adonis
e-Mail: adonissingh@gmail.com
.
Date 2024-Nov-21
IP [::1]:58698
Hello Sergey and the TS Team,
Under Astrological Prediction Technique > Save Picture As...,
Could you also please include the Date and Time in the astro-chart picture?
If it is a comparison astro-chart, also the Date and Time of the natal?
It would make it much easier for those who save these astro charts for future reference.
Thank you,
Adonis
e-Mail: matthewskane@gmail.com
.
Date 2025-Jan-04
IP [::1]:48078
Interface Change: the ability to re-name the modules in the side-bar list. For example, when two Astronomy modules are open, one can be temporarily renamed "Decennial", and the other "2 Year" instead of both displaying "Astronomy (Composite)". In this way, when modules are minimized, user can pull back up the Astro module they know is displaying the given cycle they want to work with without having to remember which color is associated with which cycle.
e-Mail:
.
Date 2025-Jan-15
IP [::1]:32916
In most modules like the Intermarket module the use of colors could be improved.
Like in this example, the percentages are hardly readable.
Could you please use the color black on a light color background and white on a darker color background for readability.
see this post: https://timingsolution.groups.io/g/main/topic/110605815
e-Mail: dronin_d@mail.ru
.
Date 2025-Jan-29
IP [::1]:56344
Sergey hello, in the Intermarket module you can add a shift of the composite line sometimes there is a desire to shift the composite forward or backward, also in Intermarket look at the RPO 1:150:150 Exponent non Lag Clos indicator. Thank you.
e-Mail: pranxtrr@gmail.com
.
Date 2025-Feb-01
IP [::1]:52642
Hi Sergey
I was wondering if it would be possible to add percent steps within the Planetary Equidistant Lines charting tool
to be able to expand and contract using Fibonacci and other percentages
thank you Brent
e-Mail: jeff.leauby@gmail.com
.
Date 2025-Feb-07
IP [::1]:59784
A Timing Solution get together/conference with users and speakers would be interesting
e-Mail: jeff.leauby@gmail.com
.
Date 2025-Feb-07
IP 127.0.0.1:59480
In spectrum - the new composite is great. If it had ability to cut & paste or export the trade list into csv, that would be great. also, if the statistics from natural cycles could appear in composite trade summary like the mean and standard deviation (in addition to what is there 'median' ) that would be useful. thanks for the great feature!
e-Mail: martincannington@gmail.com
.
Date 2025-Jun-01
IP [::1]:56072
Hello Timing Solution
If possible I'd like on the RSI Oscillator the option to add horizontal lines at 30 (red), 40 (blue), 65 (red) and 80 (blue)
This is in line with Constance Brown's book, Technical Analysis for the Trading Professional - Chapter 1 that Oscillators do not travel between 0 and 100. In a Bear Market the RSI Oscillator travels between 30 and 65 and in a Bull Market travels between 40 and 80.
Regards
Martin Cannington
e-Mail: martincannington@gmail.com
.
Date 2025-Jun-22
IP [::1]:54474
Hi Sergey and Timing Solution team,
This is not a important wish, but it would be nice to be able to have the option to open multiple Charts ( 4 realistically) to be used when there are 2 additional monitors.
Anyway thank you for your time
Martin
e-Mail: jonathanbjohnston@gmail.com
.
Date 2025-Jul-09
IP 127.0.0.1:45472
Would it be a big job or ask to be able to change $ per degree to customisable on planetary fans? The reasoning is that I use very specific numbers not on whole....
If this is possible it would be incredible and save me much work. Many MANY thanks in advance.
Happy summer from us all and thanks for everything you do!
Jonathan
e-Mail: tarassov.m@gmail.com
.
Date 2025-Jul-29
IP [::1]:38084
Ya testiruyu
e-Mail: tarassov.m@gmail.com
.
Date 2025-Jul-29
IP [::1]:55442
This should go through. .%2F.%2F^^^
e-Mail: adonissingh@gmail.com
.
Date 2025-Aug-10
IP 127.0.0.1:45732
The Counter > 2D Day-Price distance tool currently shows the delta Price and delta Time. I propose to include also ratio of Price%2FTime.
Sometimes the ratio clues the user into which planetary rate is active. Then the user can investigate further using planetary lines or planetary fan angles.
Thanks%2C
Adonis SB
e-Mail: timingsolution17@gmail.com
.
Date 2025-Aug-17
IP [::1]:37284
Hi
One more question%3A your MATIC crypto data stops in March 2025. I see yahoo finance also stopped there. There was ticker migration to POL in Sep 2024%2C so at some point companies stopped maintaining old price feed. Is there a way you could add or Merge the data? Thanks!
Regards%2C
Namik
e-Mail: timingsolution17@gmail.com
.
Date 2025-Aug-17
IP [::1]:50800
Good morning
I asked to add ENA%2FUSD
tku
e-Mail: val.vrel@hotmail.fr
.
Date 2025-Aug-17
IP 127.0.0.1:46502
Hello Sergey%2C hope everything goes well for you.
I want to make a suggestion that could help to save lot of time with ULE module.
It would be a nice addition to be able to send events from Astrological prediction techniques directly to ULE module. It really could be a great addition to you're software.%28see picture%29.
For exemple by one click you could put event in ULE module one by one.
Best regards
Valentin
e-Mail: martincannington@gmail.com
.
Date 2025-Aug-17
IP 127.0.0.1:41584
Hello Timing Solution%2C
I would like to request the following Companies be added to the respective Stock Markets; Ubtech Robotics Corp Ltd 9880.HK and Contemporary Amperex Technology Co Ltd 300750.SZ
Also could Share Markets have the companies listed sorted alphabetically for easier searching.
Thank you for considering additions to Timing Solution
Martin
e-Mail: val.vrel@hotmail.fr
.
Date 2025-Aug-17
IP 127.0.0.1:50798
Possibility to rename ULE's multifactorial efficiency tests on the side of the screen %28sandwich menu on the right%29 to bring more clarity because a L1 %2A L2 formula can be confusing and it's easy to lose track when working on aspects.
e-Mail: Moharbi621@hotmail.com
.
Date 2025-Aug-17
IP [::1]:53668
Dear Sergey;
Can you add an option to export wavelet data to excel %28or Csv file%29 as table %28period vs. Cycle%29? Please you might add option for normal active cycle%2C inverted cycle and inactive dead cycle over the period.
It will be good feature to study the Euclidean rhythmic sequence or do further study to anticipate leaked future cycle
Thanks Sergey for your great effort to develop and improve the TS to become the best program in cycle analysis. Please keep it up ; Bravo 👏
BR;
Mohammad
e-Mail: val.vrel@hotmail.fr
.
Date 2025-Aug-21
IP [::1]:55966
Suggestions for efficiency tests %282 new buttons%29 %3A
1%29 Possibility to clic on "open astrological prediction technique wheel" next to each date where event occurs %28in efficiency tests to compare past aspects with future aspects quickly%29. Prediction wheel need to open at the choosen date in efficiency test.
2%29 Button next to each date "Put chart at this date". In order to put chart exactly where event occurs. %28To compare future aspects with past aspects and see if there is superposition of aspects%29. If there is superpositions of severals aspects there is a lot of chance that aspects is going to be harder to trade and less reliable.
At the moment we can do this manually but this is not practical.
Hard to compare everything because it takes lot of time especially to study intraweek aspects %28M30bars%29
e-Mail: timingsolution17@gmail.com
.
Date 2025-Aug-26
IP [::1]:45354
from Atul Gupta
Q-Box report
average median profit %24 and %25
P%2FL
e-Mail: val.vrel@hotmail.fr
.
Date 2025-Sep-20
IP [::1]:51430
It would be nice if we could display an efficiency test projection line directly on the chart %28by choosing how many bars before and after culmination to build the curve%29. Could help to see quickly a projection line based on an efficiency test
e-Mail: Ffruazwzlpearsgso@gmail.com
.
Date 2025-Sep-30
IP 127.0.0.1:58580
e-Mail: Ffruazwzlpearsgso@gmail.com
.
Date 2025-Sep-30
IP [::1]:59992
e-Mail: adonissingh@gmail.com
.
Date 2025-Oct-01
IP [::1]:52650
Text tool proposals%3A
1%29 Allow adding text vertically %28same like for Date%29.
2%29 Allow adding multiple rows in the same text box.
Thanks!
e-Mail: testing@example.com
.
Date 2025-Oct-24
IP 127.0.0.1:43066
555
e-Mail: 5f0u9z3z11823394@6gmail.com
.
Date 2025-Nov-27
IP [::1]:51470
e-Mail: 5f0u9z3z11823394@6gmail.com
.
Date 2025-Nov-27
IP 127.0.0.1:55238
e-Mail: testing@example.com
.
Date 2025-Nov-27
IP 127.0.0.1:55752
555
e-Mail: testing@example.com
.
Date 2025-Nov-27
IP 127.0.0.1:59704
555
e-Mail: testing@example.com
.
Date 2025-Nov-27
IP [::1]:36848
555
e-Mail: testing@example.com
.
Date 2025-Nov-27
IP 127.0.0.1:59712
555
e-Mail: testing@example.com
.
Date 2025-Nov-27
IP 127.0.0.1:59748
555
e-Mail: testing@example.com
.
Date 2025-Nov-27
IP [::1]:48298
555
e-Mail: testing@example.com
.
Date 2025-Nov-28
IP [::1]:42016
555
e-Mail: testing@example.com
.
Date 2025-Nov-28
IP 127.0.0.1:47930
555
e-Mail: jonathanbjohnston@gmail.com
.
Date 2025-Dec-01
IP [::1]:44472
Hi Sergey%2C
Tatiana kindly replied to my email. I would love for TS to have Ganns true CE averages and any planet combo available for my private students as explained on email. I do not have enough space here to write whole formula but I sent on email and can send you my spreadsheet as and when you get around to it. All has been emailed so when you get time %28I totally understand you are v busy!!%29 just drop me an email and we can discuss. Gann ONLY taught this to private students. VERY important!
Kindest regards%2C
Jonathan Johnston
e-Mail: testing@example.com
.
Date 2025-Dec-07
IP [::1]:50504
555
e-Mail: testing@example.com
.
Date 2025-Dec-09
IP [::1]:38848
555
e-Mail: fuzz1234@gmail.com
.
Date 2025-Dec-09
IP [::1]:41504
5f0u9z3z118233946@gmail.com
e-Mail: 5f0u9z3z118233946@gmail.com
.
Date 2025-Dec-09
IP 127.0.0.1:55432
e-Mail: fuzz1234@gmail.com
.
Date 2025-Dec-09
IP [::1]:58014
5f0u9z3z118233946@gmail.com
e-Mail: 5f0u9z3z118233946@gmail.com
.
Date 2025-Dec-09
IP 127.0.0.1:43058
e-Mail: fuzz1234@gmail.com
.
Date 2025-Dec-10
IP 127.0.0.1:52310
5f0u9z3z118233946@gmail.com
e-Mail: fuzz1234@gmail.com
.
Date 2025-Dec-10
IP [::1]:39794
5f0u9z3z118233946@gmail.com
e-Mail: testing@example.com
.
Date 2025-Dec-23
IP [::1]:34250
555
e-Mail: testing@example.com
.
Date 2025-Dec-31
IP 127.0.0.1:51198
555
e-Mail: yskhjrqu@forms-checker.online
.
Date 2026-Jan-24
IP [::1]:55016
ziinfxmkrklrhwryhwsyuihikldplk
e-Mail: JIM@GRENNENFINANCIAL.COM
.
Date 2026-Feb-16
IP [::1]:36728
I was wondering if you will be adding fixed stars to the Occultation data set in Eclipse Finder? And in Occultation will there be the option to select more than one planet at a time?
e-Mail: alexnagy@seznam.cz
.
Date 2026-Apr-16
IP 127.0.0.1:52426
Dobry den%2C%2C%2Cjaka je prognoza SP 5OO index?..analyza? dekuji Nagy Alexander