Question:
How to work with targets in the Composite module?
Answer:
I think the best answer to this question is experimental one. Let us consider two examples � two different targets.
As a first example, I will work with RPO. I have downloaded the Dow Jones Industrial index from 1885 to 2006 years. It is shown on this diagram:
We cannot use this index itself as it has different ranges of fluctuation at different times. In 1885-1900, this index changes were 30-50 points, while in 1950s it was 300-700, and now (2006) it is trying to overcome the level of 12,000 points. The analysis of the index as it is shown on this diagram will be corrupted. Before doing anything, we need to normalize this index in some way, to be able to work with its fluctuations now as well as in 1890s or 1950s.
The standard solution is the usage of Relative Price Oscillator instead of the index value. And we face here one more question: what should be a period for this oscillator?
Look at these two relative price oscillators, with the period=73 days (a red curve) and the period=866 days (a purple curve):
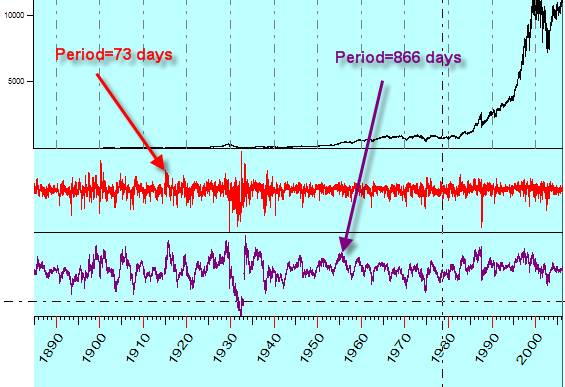
Both of them show the fluctuations of DJI. However, I would say that the red oscillator is more suitable to reveal shorter waves, while the purple one is better for long term waves.
The Composite module in Timing Solution automatically finds the appropriate oscillator in respect to the period of the analyzed astro cycle.
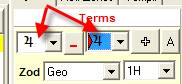
For example, if we do a research of the Annual cycle:
 ,
,
the program automatically creates the oscillator with the period of 73 days and uses it to calculate the Composite diagram.
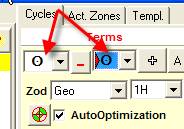
If you research some longer cycle (like Jupiter�s 12-year cycle):
 ,
,
the program automatically creates the oscillator that is more suitable to catch long term swings. In this case, it uses the oscillator with the period of 866 days.
The program does this job automatically; you see only final results.
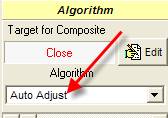
By the way, the �Algorithm� option should be set on �Auto Adjust�:
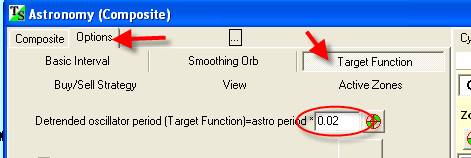
The period of Relative Price Oscillator you can define here (it is a proportion of astro-cycle period):
Now let us consider another example. We will analyze RSI index. This index changes in the range of 0-100%. It had been so in the late 1890s, in 1950s and it is so now. You do not need to normalize these data.
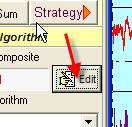
Let us calculate the Composite for RSI index. Click here:�
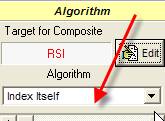
Choose RSI:

and highlight �Index Itself�:
This is diagram that shows the RSI in respect to Jupiter�s position:
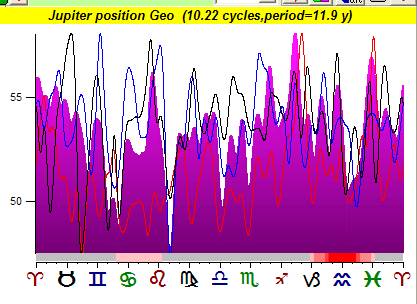
The same type of analysis can be performed for any non-trend indicators (like Volatility, ADX).