Question:
What artifacts we
may face providing the Efficiency Test?
Why do we need
control groups?
Answer:
Artifacts are phenomena that can be explained by reasons other than the factors that we explore. In our case, we explore the effect of astronomical phenomena on the markets. Therefore, artifacts are the factors other than astronomical phenomena. The following example makes it clear.
Let�s consider the FTSE100 price chart starting from 2003:
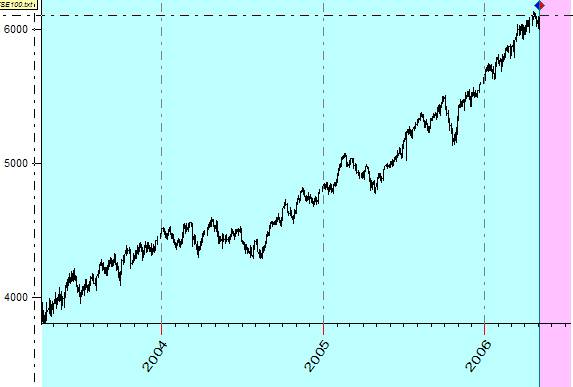
As you see, there is a strong up trend within these three years.
Now, let us do some research on this market; we will explore the effect of the �good� aspects between the Moon and the Sun.
Here is this event:
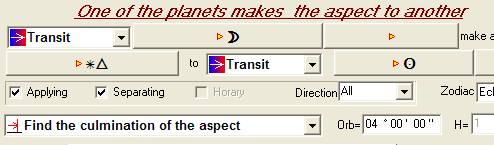
To understand how these aspects affect our
market, let us calculate the Efficiency Test for these phenomena. Click this
button: ![]() .
.
You will get this Efficiency Test diagram:
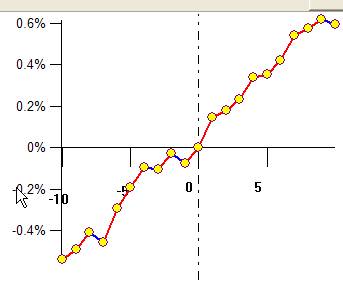
While looking at this diagram, the conclusion comes easily: this aspect pushes prices up. Is it really so?
Let�s create the trading strategy based on good aspects between the Sun and the Moon: buy at the culmination and sell 2 days after it:
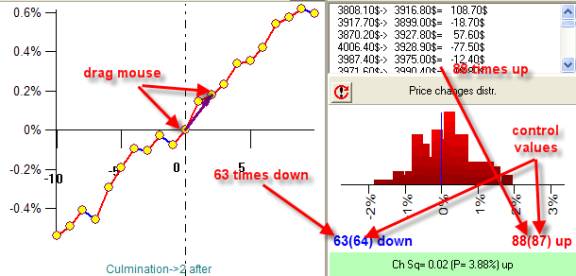
To do that, drag the mouse from the culmination point (0 on X axis) to 2 days after the culmination (2 on X axis). The program does the statistical analysis automatically.
What do we have here? The price went up 88 times, while it went down 63 times. Actually this difference can be explained by the up tend price movement rather than the actual aspect�s influence. We can see it looking at the control values (they are shown in brackets, right beside the numbers for up and down price). The control values in this case are 64 down and 87 up - very close to our aspect�s statistics.
What the control value is?
The program creates the virtual aspect that takes place 151 times (same as a real aspect), and it is totally random. Then the program counts how many times the randomly taken prices went up and how many times they went down.� You see that this virtual aspect affects the market almost in the same way as the real aspect. (Here is a common mistake, as usually people assume 50/50 ratio between up and down cases as a control value).
Thus, to understand better whether the aspect does really impact the market, we need to compare the aspect�s statistic to the control values.
If, for instance, we do a research on some down trend price history, we will get more down points in the control group. For sideway market, this value will be close to classical �fifty-fifty�.