DJIA, August, 5 2011 - It looks like the correction is coming down the road
This is a forecast for Dow Jones Index:
The most trustworthy projection line comes from astronomy; this is a projection line based on Jupiter cycle. The composite diagram below shows us that DJIA tends to move down when Jupiter passes through Taurus, Gemini and Cancer, up to the end of Leo:
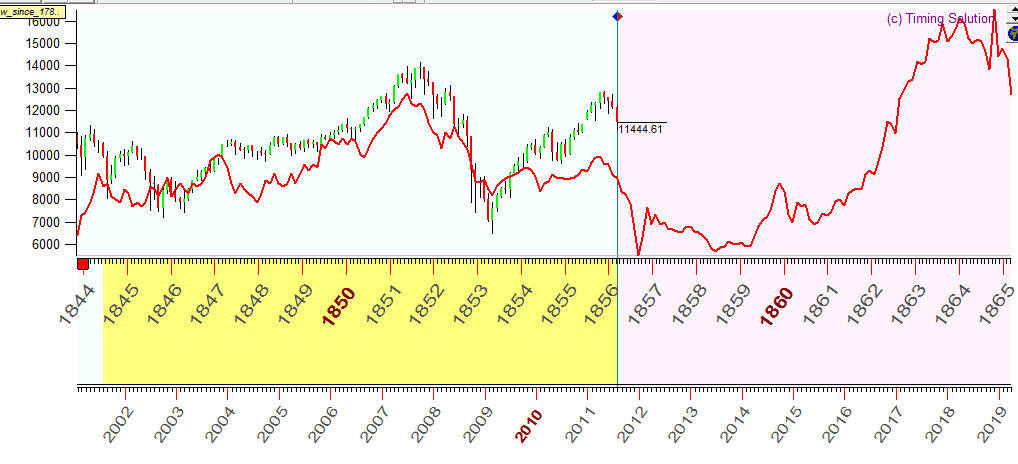
Analyzing Dow since 1789, we have found that last ten years (2001-2011) have a pattern very similar to that one in the past (1845-1856). In other words we are going now the same road as our ancestors did 150 years ago. Look at these two price charts separated by 150 years of history displayed together:
There is also an analogy to 1887:
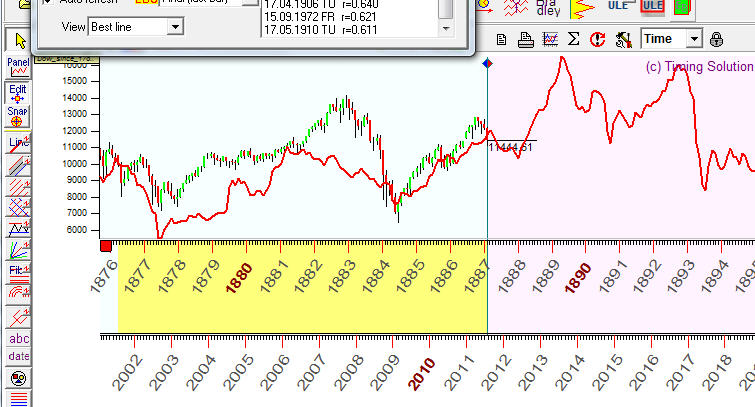
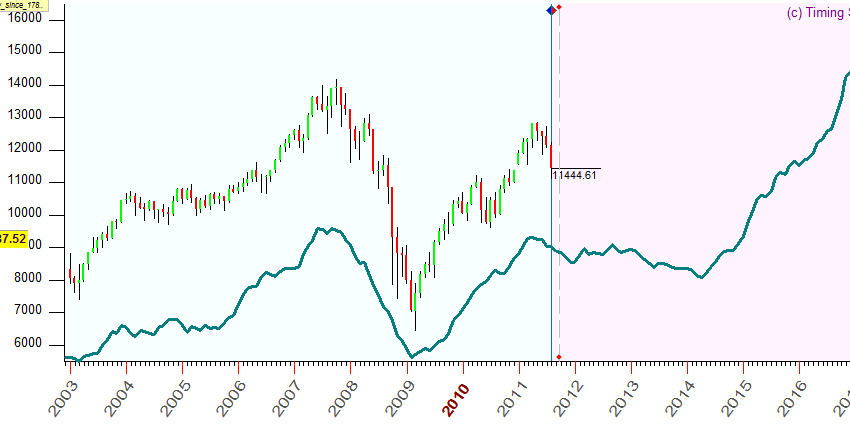
as well as to 1810, 1923, 1906 etc. For me it is very interesting fact that most of these analogies indicate an upcoming correction for the next 2-3 years. We can make a projection line based on all these analogies; here it is:
The models based on regular math cycles provide a picture that is not so certain; see the wavelet diagram below:
The only active cycle now (i.e. yellow regions) is 33 years cycle, this cycle is active since 1850-1860 years. It is possible that this cycle is ignited by Civil War of South and North and the first president election in the States. BTW, this cycle is very close to Saturn-Pluto cycle.
Look how that cycle worked since 1850:
This is the same cycle in more detailed scale: