Gold cycles
written by Sergey Tarassov
Case Study
This analysis is based on the
historical data of gold prices from 1975 up to 2006. It shows that the most significant
cycles for the gold market are:
1) 21 months cycle;
2) 2 years cycle;
3) 4 years Presidential cycle.
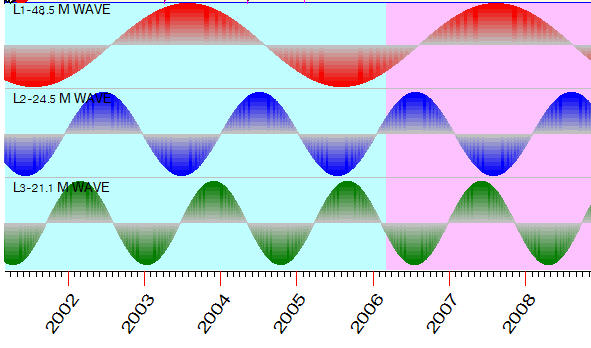
This diagram these 3 cycles in action (the red wave - 4 years, the blue wave - 2 years, and the green wave stands for 21-month cycles):
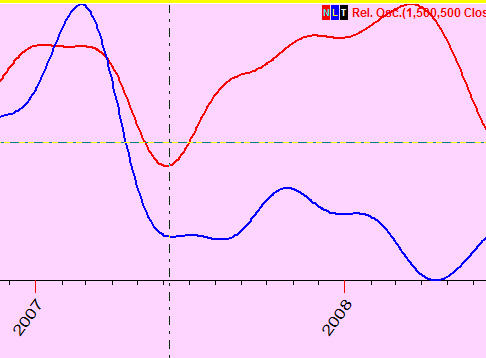
This is the projection line for gold price based on these 3 cycles, for the nearest future:
Research
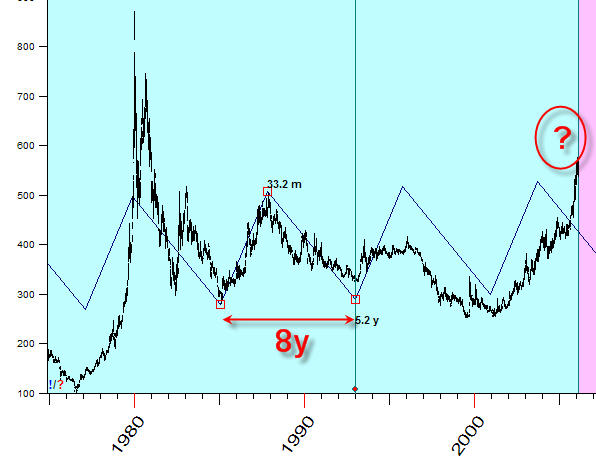
It is very difficult to make the cyclic analysis for gold. Usually, the first approach in cycle analysis is the attempt to find patterns formed by major tops/bottoms. This rule is not applicable for gold. The only cycle that I have found by this approach is 8-years wave that does not explain the huge trend for the last years:
In this case, we need to apply more sophisticated math methods - like spectrum analysis. This analysis shows three cycles for the gold:
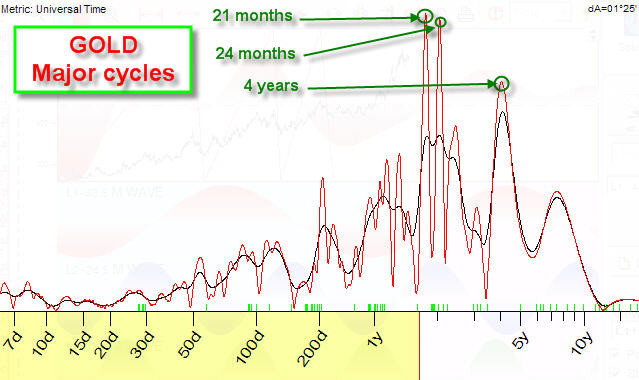
The major peaks on this diagram show the periods for the cycles that move the gold price. It is interesting that the Presidential cycle (4 years) is pretty strong for gold price; in other words, this financial instrument correlates pretty well to the Presidential elections. Usually for securities 40-month Kitchen economical cycle (which is a bit shorter than the Presidential cycle) is much more important.
Knowing the periods of these major cycles, we could easily draw the picture above.
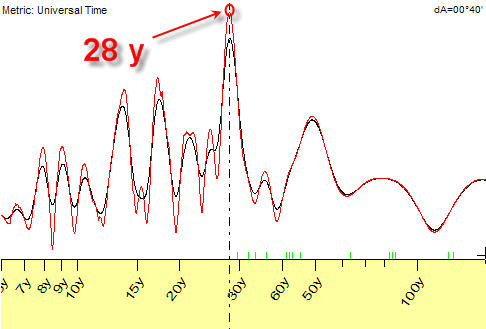
We can also assume that the gold might follow some longer term cycle that can not be observed in available price history (from 1974 year). Look at this one:
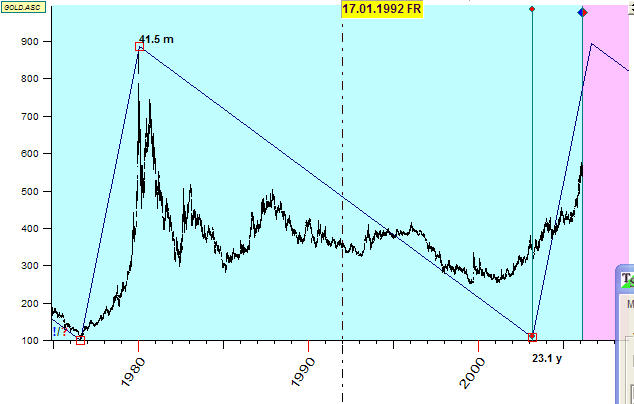
After 4-5 years of strong trend movement, the price has dropped within 3 years, and after that we have 20 years of steady price. It makes in total 28 years. However, it is just an assumption, we cannot prove this fact due to the short history available. We only can point out that 28-years cycle is pretty strong for consumer price inflation factor for UK (this statement is based on yearly data, starting from the year 1665!). Look at this periodogram for the inflation factor:
If we concentrate on searching short term cycles ,we can select weekly 7-days cycle and 4-month cycle:
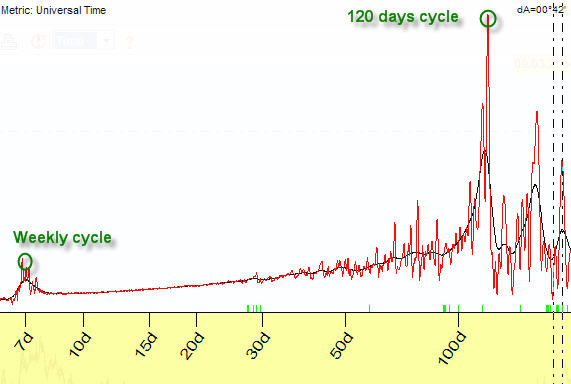
The 4-month (120-days) cycle is very close to Mercury phase cycle. Is it a coincidence or some valuable information, we do not know.
All calculations are made with Timing Solution software: http://www.timingsolution.com
Sergey Tarassov.
Toronto, Ontario
January 7, 2007