Inversions - projection line with a secret
I highly recommend to be very careful with inverted projection lines, and I will explain why.
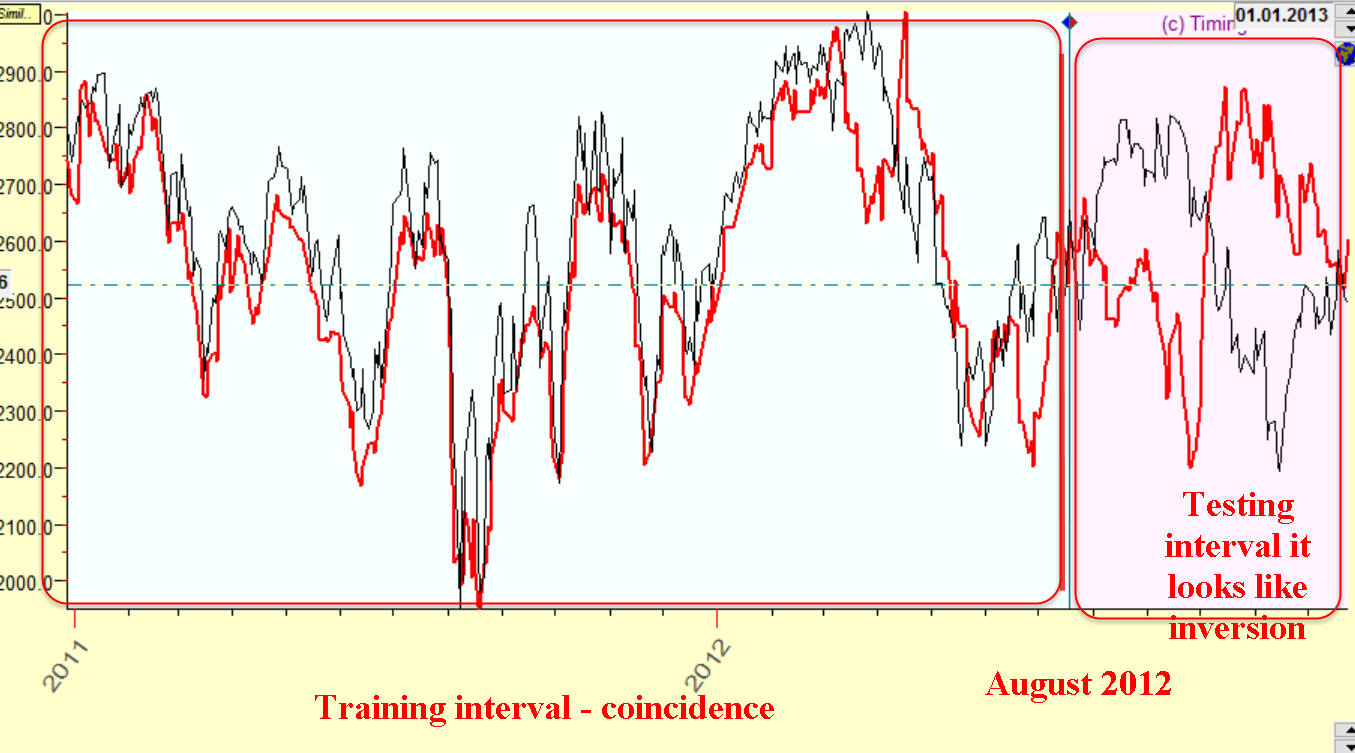
Let's start with explaining how an inversion works. Suppose we train Neural Network using the price history till August 2012, i.e. the training interval ends before August 2012:
As you see, we have a good coincidence here between the price (a black curve) and Neural Network projection line (a red line). After August 2102 (the testing interval) the projection line works strange somehow, it looks like it fits the price history after August 2012 only if we invert this projection line:
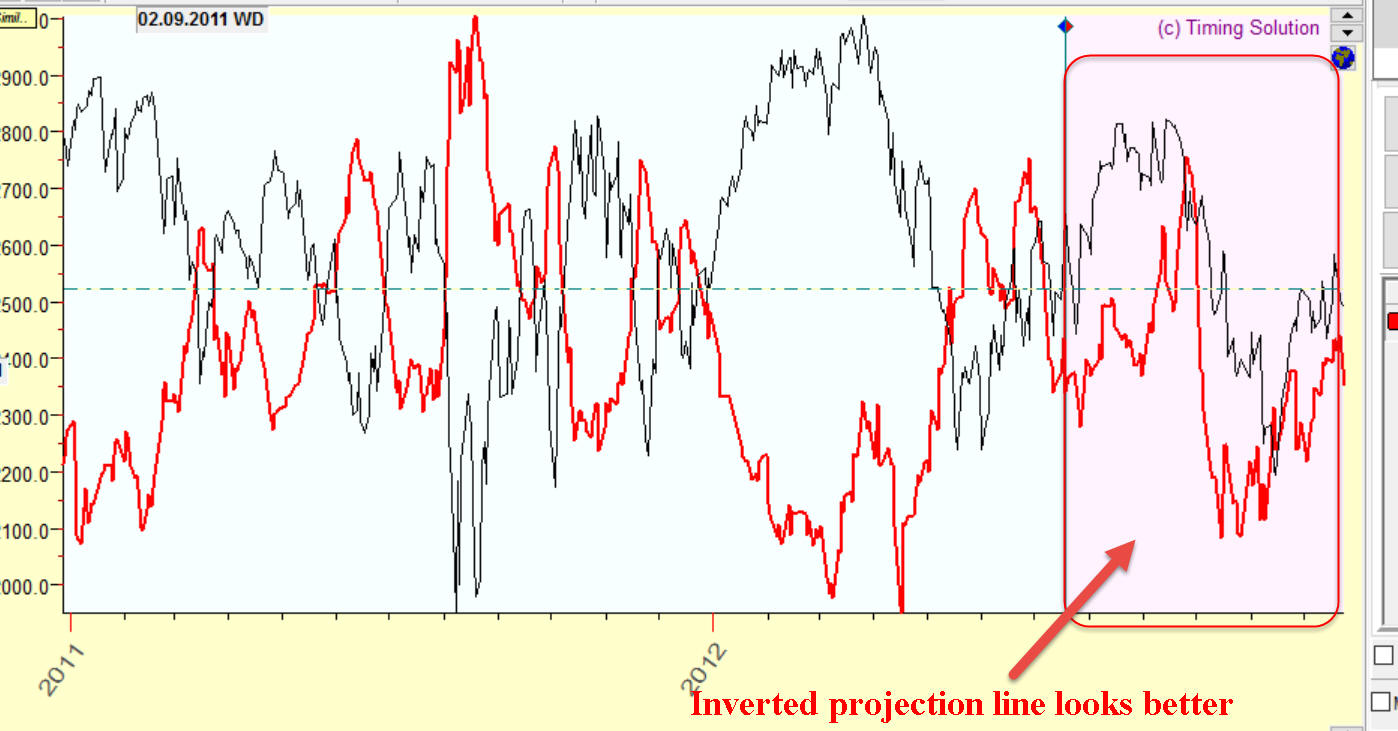
So finally we get a good coincidence between the price and the INVERTED projection line after August 2012, though a cost of that is an inverted coincidence on the training interval, prior August 2012.
Let's do the same for the next year, ending August 2013. We train our Neural Network using the price history till August 2013; in attempt to get a better future forecast, we invert our projection line again. Instead of August, it might be any other month - April or another month, this is not important. The point is: TIME TO TIME WE HAVE TO INVERT THIS PROJECTION LINE TO GET A BETTER FORECAST.
We can do it once only. Mathematically, ONCE inverted projection line is simply a regular not inverted projection line, nothing else. One inversion will be immediately taken into account by NN, and for a final user it will be just a regular projection line.
So my point is: the inversions can take place again and again if we start applying them. This is not a one-time-happened event. This is a mathematical necessity. It means that for inverted projection line we need to have also the dates when this projection line is inverted. This is not a good news as there is no such a list. Technically it means that we have a projection line with a secret. Or let's say more precisely - we have Pandora box, we have the projection line that can be inverted at any moment.
The moments of inversions can be taken as bifurcation points (IMHO), they are the moments when the system has a choices between two trajectories - a normal one and inverted. I think these dates somehow may be related to fundamental factors, I would not recommend to forecast these dates. It sends us to non-linear dynamic field, where complicated things tend to be explained by something more complicated...
BTW, this is why in Timing Solution we mostly display an inverted projection line together with a normal one (both of them together):
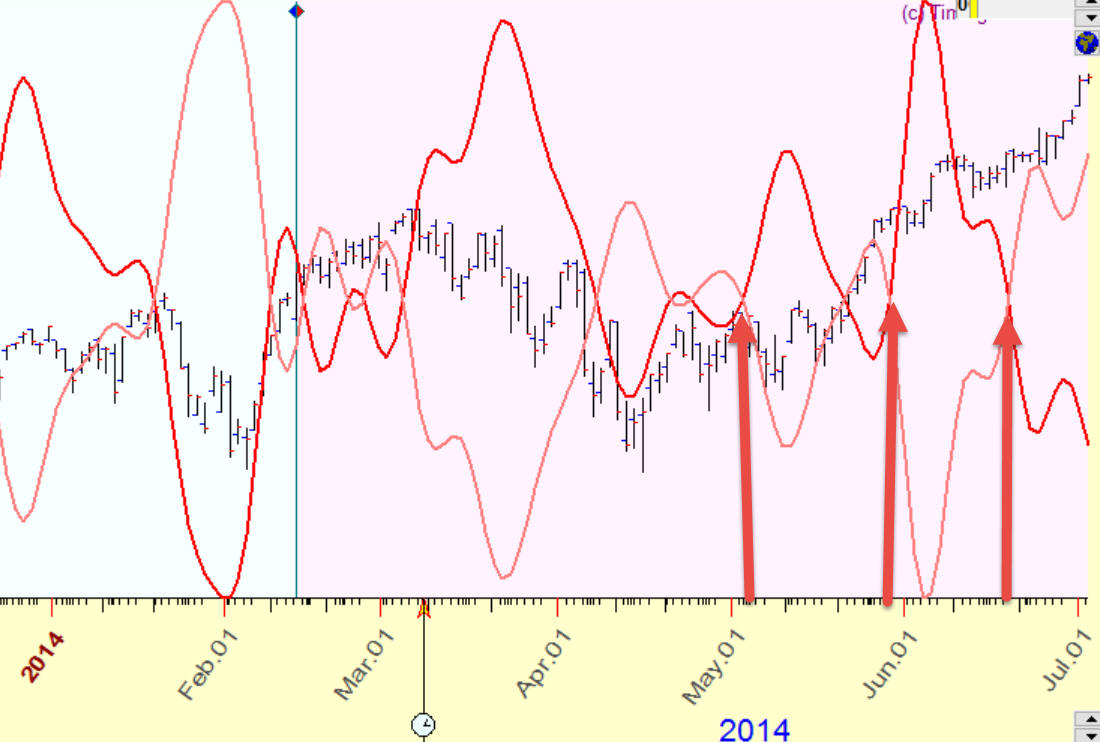
Any moment the real price movement can switch from one (inverted) to another (normal) projection line, and vice versa. I have marked these dates in the screenshot above.