Simplest Back Testing
Back Testing (BT) is the procedure to understand how our forecast models work in practice. Do not take it as a new forecasting model; this is not right. Take it as a way to examiner your models.
I would like to be sure that users understand this procedure very clear. Otherwise I would not recommend to go further. You should decide yourself what you want to do: play a simple game of dicing/guessing or do a forecast.
General idea: guessing versus forecasting
Everyday there is somebody on any of Internet financial forums who sends there some projection line that provides very good forecast in the PAST. In every trade magazine you can read the story about some very successful trader; again, the described success has happened in the PAST as well. Try to skip the forums and magazines just for two weeks (like I did going for vacation). When you come back, you will be surprised: new heroes appear, and nobody remembers what was there just two week ago� If somebody is lucky enough to point the right direction of the stock market, the records of this event are kept forever, and this person would always refer to something like this: "in 1987 I have made a forecast...". And the user always faces the same question: to trust or not to trust that forecast, technique, method, etc; to use it or not to use?.
It is only you who can answer this question. And before answering it, you need to decide honestly what you prefer to do: to spin the wheel of Fortune again and again - or do a systematic job. If you are a gambler or you are looking for a miracle, do not read further. The following is only for those who need tools to understand and evaluate.
No future leaks technology
The most important issue in backtesting procedure is to separate the piece of price history that is used to adjust your models and another piece of price history that is used to verify how these models work.
In other words when somebody comes to you and shows a very impressive projection line stating that it worked very well till today - September 19, 2008, tell him or her to provide a forecast starting from today on two weeks ahead and forget about it for these two weeks.
In two weeks (October 3) check this projection line (that has been calculated on September 19,2008) with the real price. If the results are good, ask this guy to prolong this projection line on two weeks ahead starting from October 3,2008 � just to be sure that this result is not occasional. Do this procedure several times. This is a hard test for the guy though very useful for you as in this case you can get a true impression of how this model works. Do not be very demanding to this guy, there are no models that are good forever. You need get a full picture and understand advantages of each model together with its risks.
Technology
Now I will demonstrate how you can do this job with Timing Solution. Suppose you want to figure out how Turbo Cycles module works. This module extracts dominant cycles and generates the projection line based on these cycles.
Look at this screen:
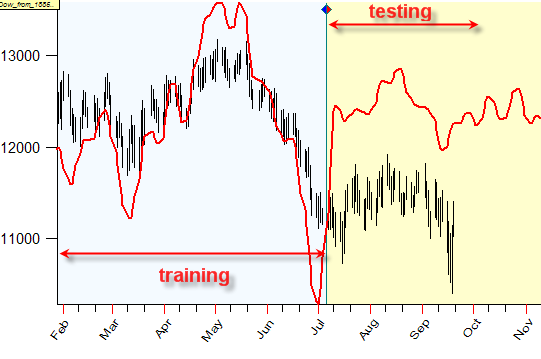
Here the LBC (Learning Border Cursor) is set on July 6, 2008. The price history before LBC is called �the training interval� while the price history after LBC is �the testing interval�. The program uses the price history prior LBC (i.e. July 6, 2008) to perform all necessary operations to generate the projection line. The program does not know about the price movement after LBC at all. This is the advantage of "no future leaks technology". It does not give you any illusions like "80% accurate" models; from the other side you will not be surprised applying this technology for the real trading.
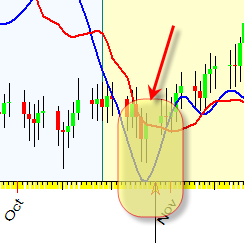
Now let us do this experiment: we change LBC position, say put it on September 15, 2008 and watch what is going on (move the mouse cursor on a desired spot on the price chart and click the right mouse button; choose "Set LBC at ..." item there). You see the program will recalculate the projection line. Now it uses the price history till September 15, 2008 to generate the projection line. It does not know about the price history after new LBC position (September 15, 2008). Here it is:
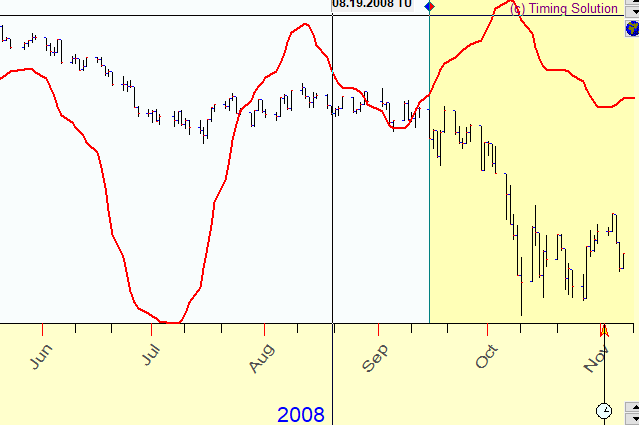
Thus we can model the new coming price history and observe how our model reflects it. As you see in this case this particular model does not work. It does not mean that this model is bad, it simply means that at that moment the stock market behavior is not in a �cyclic mode�. The earlier we recognize that fact the better.
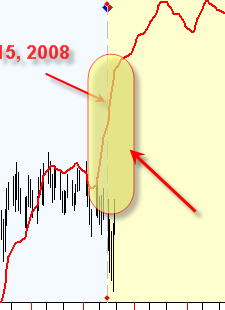
Let�s simply hide the price history after LBC, trying to put yourselves on September 15, 2008:
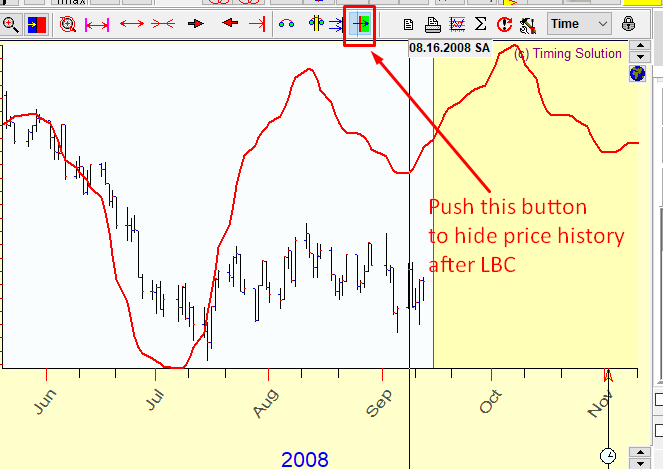
As you see it was a big divergence between the model and the price starting from September 10, when the model �lost� its cyclic mode.
Work with other modules in the program exactly in the same manner. For example working with Composite module you can see how the projection line changes while you change LBC position:
Thus general recommendation is: try to vary LBC position setting it on different dates and watch what is going with your models, when these models work and when they do not work.
There are no �forever� models or recommendations here.
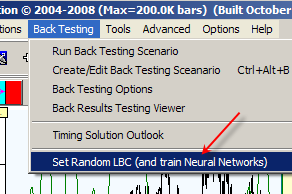
In Timing Solution you can set LBC randomly here:
Just click �OK� button
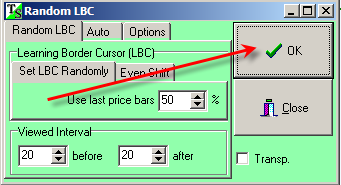
And program will set randomly LBC and recalculate the projection lines.
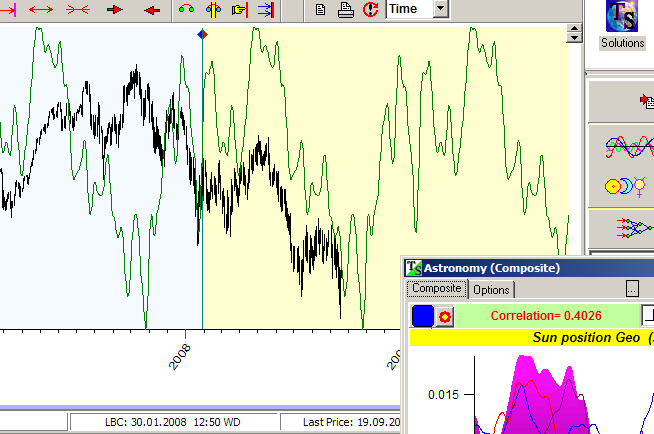
Your working place should be like this:
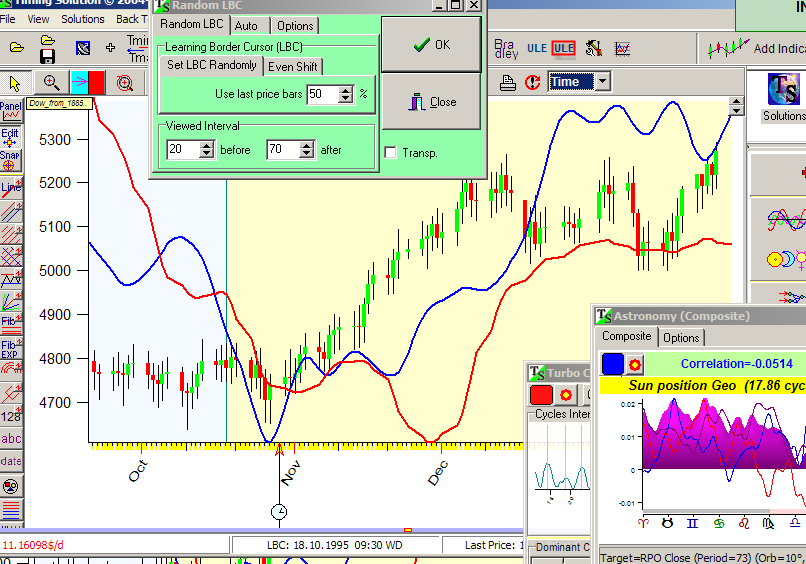
I run two models here - Turbo Cycles (red projection line) and Composite for Sun (Annual cycle, blue projection line), vary LBC position and watch how these projection lines fit the real price chart after LBC.
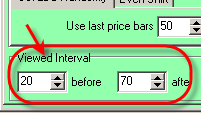
You can vary left and right margins here:
Again, there are no any �forever� recommendations here.
These are my observations:
1)
Use 2-3 different models;
2)
Always pay attention when
several projection lines point at the same turning points � �synchronize
points�:
3)
For daily data always use
Annual cycle;
4)
When the model shows a huge gap
(whatever up or down), this is not a good sign for this model. Like here:
It looks like the model has �lost� an equilibrium point. This is kind of �reaction effect� (see here http://www.timingsolution.com/TS/Study/Reaction/reaction.htm)