Planetary Picture Time module (PPT)
The idea of Planetary Picture Time (PPT) is very simple. We construct the synthetic planet (which is called "a planetary picture") and try to forecast the stock market events using the coordinates of this synthetic planet.
As an example we can consider this planetary picture the Sun+Mercury-Venus. It means that geocentric coordinates of this "planet" are calculated as geo longitude of the Sun plus longitude of Mercury minus longitude of Venus.
To run PPT module follow "Advanced"->"Planetary Picture Time".
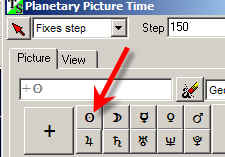
First of all define the planetary picture the Sun+Mercury-Venus. Click "the Sun" button:
Then click on Mercury:
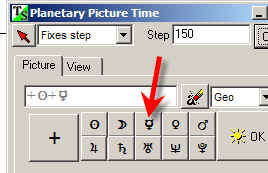
Now add Venus with MINUS sign. Push "+/-" button and after that click Venus button:
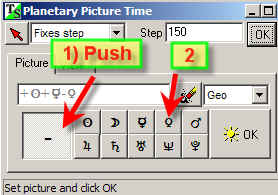
The picture is defined.
The next step is to calculate the coordinates of our synthetic planet. Click on this button:
Now in the Main Screen drag the mouse cursor from point A to point B:
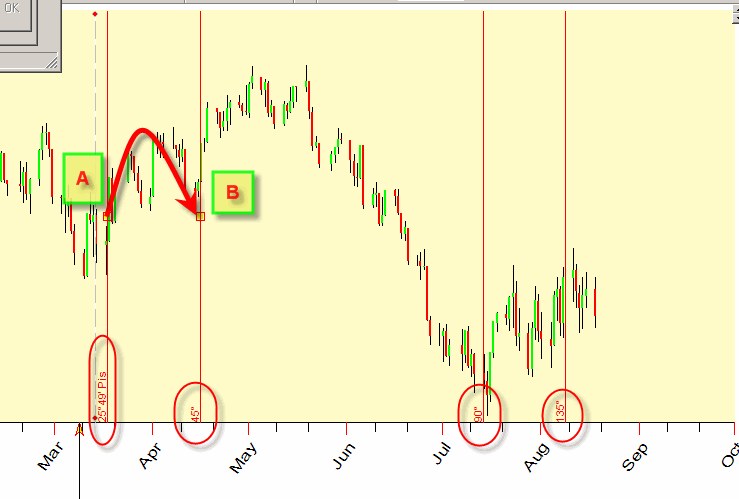
You will see the bunch of vertical stripes. The first (point A) vertical stripe is our initial point; here the program indicates that the coordinate of Sun+Mercury-Venus point is 25degrees 49 minutes of Pisces. The second stripe (point B) shows the angle separation between A and B points, I set it to 45 degrees. It means that the longitude of our synthetic planet is increased on 45 degrees. Next vertical stripe corresponds to 90 degrees increment (2x45); the next is 135 degrees (3x45).
We can see these lines in both directions (back and forward):
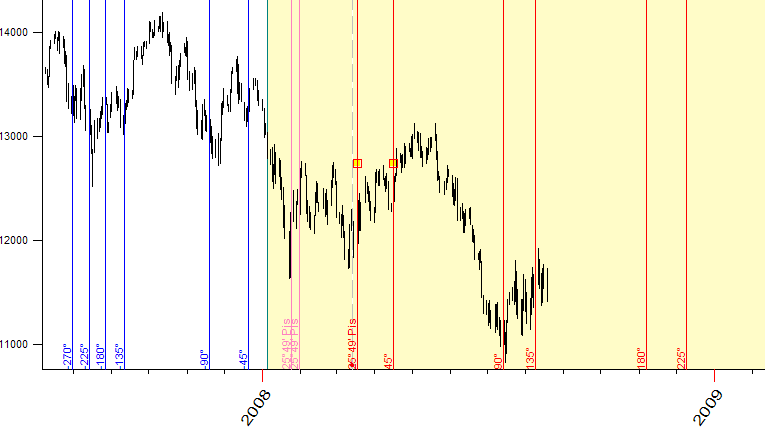
Pay attention to these purple vertical stripes (we call them "Shadow"):
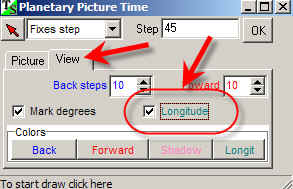
To figure out what it means let's go back to Planetary Picture Time module, choose "View" tab and set "ON" for "Longitude" option:
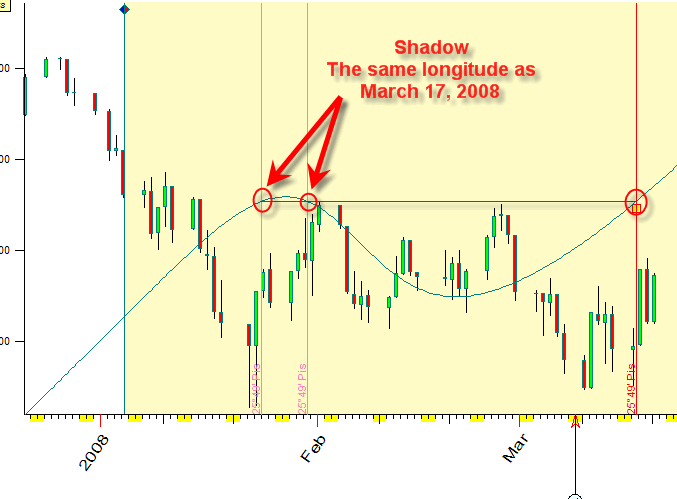
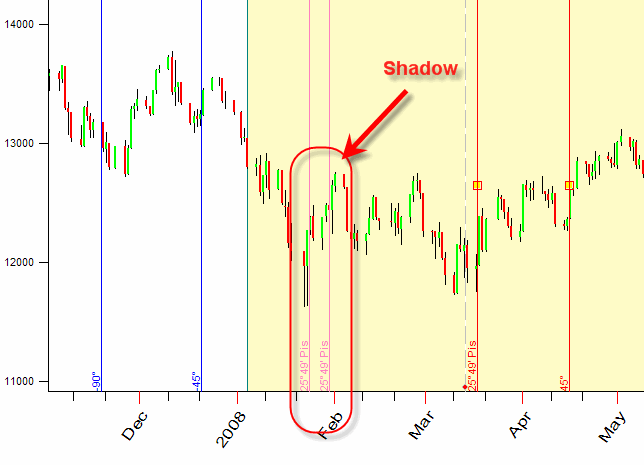
The program will display the longitude of our planetary picture together with the price chart. As you see, in the end of January 2008 the longitude has been the same as for our anchor data, March, 17 2008. It was caused by retrograde motion of one of the planets involved (Mercury in our case).
Thus due to the retrograde motion we may have more than one vertical line for the same longitude. For example in this example we have two "shadow" lines for each line:
Some notes regarding the interface in general. While you drag the mouse along the Main screen, the program automatically recalculates the angle separation between the anchors and coordinates of planetary picture for the first anchor and displays them here:
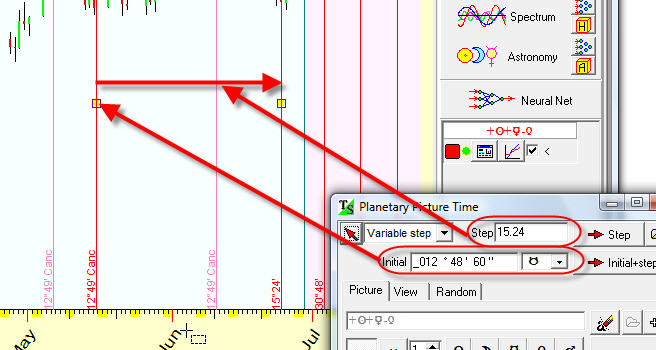
You can also set these angles manually using these controls:
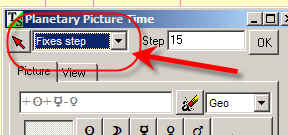
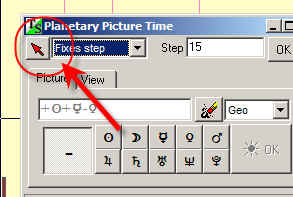
There is one more possibility: set "Fixed step" here, and the program will adjust all vertical lines for manually defined step:
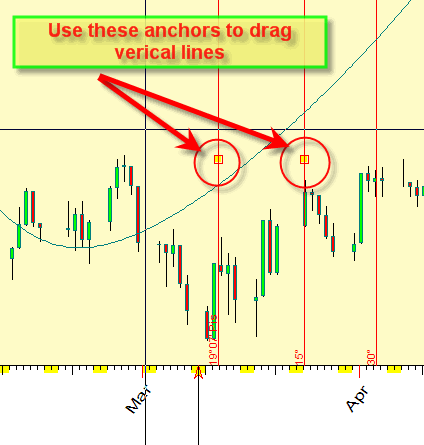
In reality you will drag only one vertical line to define the initial position, all other lines will be calculated automatically (in our example: 15 deg, 30 deg, 45 deg, -15 deg. -30 deg, -45 deg etc),
Pay attention to these yellow marks. Use them to drag appropriate lines. Just move the cursor to this rectangle, push the left mouse button and drag this line keeping the left mouse button pressed:
Also you can use this button if you need to draw your picture "from scratch":
Here you can set the main options:
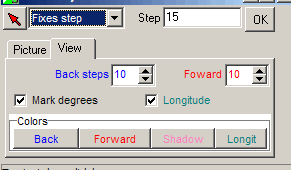
- amount of back/forward vertical stripes;
- mark/do not mark vertical lines;
-display/do not display the longitude diagram for the analyzed picture;
- colors.
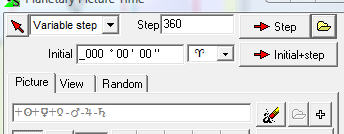
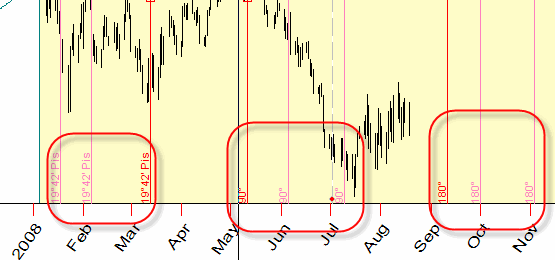
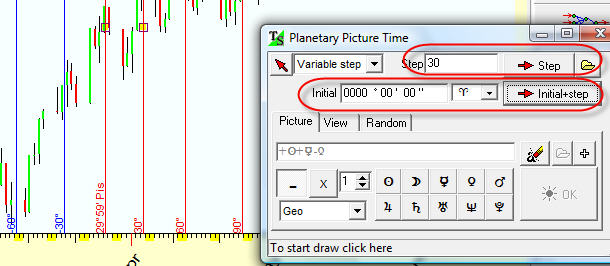
Example #1: We want to display the moments when Sun+Mercury+Venus+Mars+Jupiter+Saturn picture ingresses the first degree of Aries.
Follow these steps:
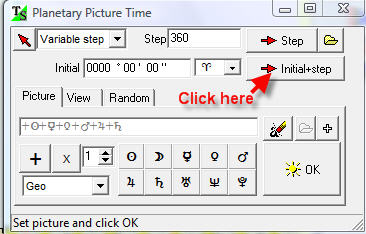
a) set Sun+Mercury+Venus+Mars+Jupiter+Saturn picture;
b) set initial 0 degree of Aries - this is the point when this planetary picture ingresses the first degree of Aries;
c) set the step 360 degrees;
d) click "Initial+step" button.
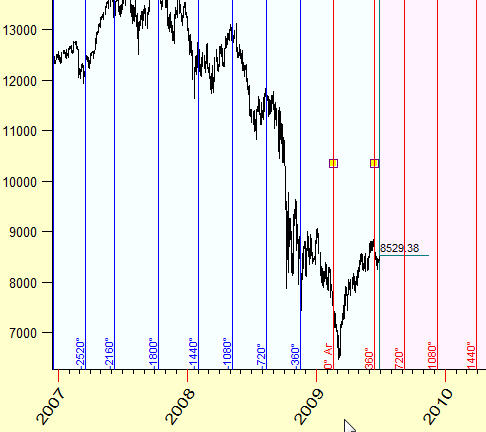
Here they are:
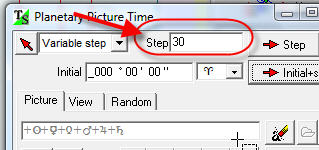
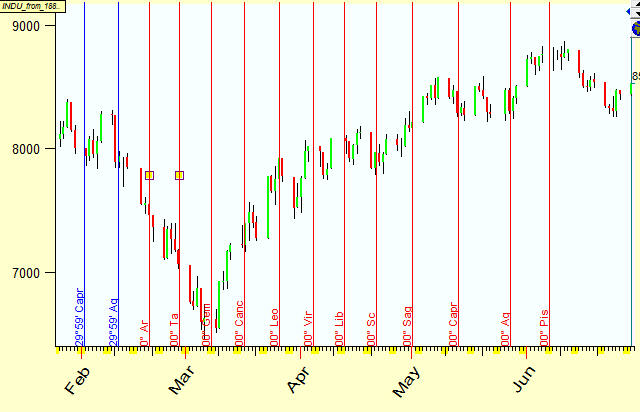
Example #2: We want to display the moments when Sun+Mercury+Venus+Mars+Jupiter+Saturn picture ingresses the first degrees of Aries, Taurus, Gemini .. .Pisces.
The only difference here with the previous example is: you should set the step to 30 degrees because we analyze 30 degrees segments:
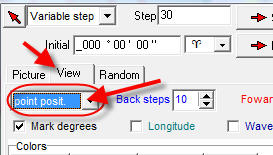
Also better set "point position" option to see the position of these ingresses (not an angle separation):
This is how these ingresses work:
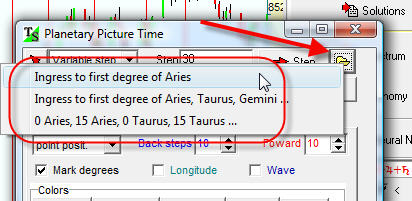
The same manner you can calculate 15, 10, 5 degrees or any other steps.
BTW clicking this button you can calculate standard steps in one mouse click:
Example #3: We want to display the moments when Sun+Mercury+Venus planetary picture has the same longitude as Mars+Jupiter+Saturn picture.
Mathematically this is the equivalent of the moments when the planetary picture Sun+Mercury+Venus-Mars-Jupiter-Saturn ingresses Aries, so we do this: