Memory of Cosmos - finding Astro similarities
Memory of Cosmos
Before any discussion, look at these two diagrams. They represent how the Cosmos "keeps in mind" two greatest stock market crashes.
The first diagram sends us to October 29, 1929. Peaks of this diagram correspond to the periods when several factors associated with crash of 1929 occur; we tend to consider these moments as a dangerous time for the stock market.
We are proud to state that our generation has faced another great crash. That crash has destroyed practically 50% of the stock market value, This is a memory diagram for this event:
As a key date, I have chosen October 6, 2008. It was Monday, and it was the beginning of that terrible week when Dow lost 18% of its value within 5 trade days. You can see how the astrological factors that played in October 2008 will be gradually decreased. All peaks here took place in October (due to the Sun position). October is the most dangerous period for the stock market.
It is not an analysis, it is just a simple consideration of the factors of some chart and moments when they re-occur. It is like looking for astrological twins for the stock market. The more factors of some chart (like 1929 crash) occur at the same time, the closer the situation is to its original (at least, astrologically). This is a way of dealing with unclear statements like "it reminds me the year 1929". I called it "Memory of Cosmos". The idea is simple: any event has a chart; the factors of the chart appear from time to time in different moments/periods; sometimes they cluster. The more factors occur at the same time, the closer this moment is to the initial chart. And the new event (that corresponds to the new chart) might have some features/similarities to the initial event. It is like echo of the event. This idea works both ways: we can trace the event in time (watching its participating factors and their evolution) or we can take a current situation and look for some similar event in the past.
Technology
Let me show you some example. Let's say that the day today is August 26, 2008 (actually, I have started this article in August 2008, it is updated on April 16, 2009 ). I look at the chart of this day trying to figure out what I should do today. I could get some tips from the days in the past that were similar to the current one. How to do that? Easy. I can find the days that are astrologically similar to this one (to some extent) and compare to the historical data. And then I can make some conclusions. Like some pattern today has happened in the past, and when it happened there was a market crash or significant drop. So, I may assume that the market will go down today.
So, where is the problem? Data to be compared with? No,
this is not a problem, more than 120
years of daily price history data are available to us. The idea is valid as "there is nothing new
under the Moon", so the repetition of some events takes place always. The
main problem comes from astrology. The problem is that there is a huge amount of
factors that we can consider.
Thus, following the Masters of Classiical Astrology, we should start with "essential dignities". These reveal the most important astrological factors. Essential dignities are related mostly to planetary positions. (This is how the idea of calculating memory of Cosmos came to me). Let us look at the chart of the last market crash (October 6, 2008) by the eyes of the astrologer.
The most important factor here is Mars's position; it is located in its own sign of dignity - Scorpio. Also Saturn in Virgo is strong enough (triplicity of Earth; this element is close to Saturn's nature). Jupiter is located in Cardinal sign (Capricorn), though this is a sign of Jupiter's fall. The Mercury position is strong - Cardinal sign plus it is in the sign of its native triplicity (Air element). However, Mercury is too close to Sun. Also mutual reception of Uranus and Neptune (Uranus in Pisces is in the sign ruled by Neptune, while Neptune in Aquarius is in the sign ruled by Uranus) is an important factor as well, and this is a long playing factor.
Here I simply reproduce the standard way of thinking when the astrologer analyzes a Cosmogram chart; these are factors to be analyzed first. When we have selected the most important factors, we may start interpreting them. This is a technology. Astrologers of the past had no other choice but to analyze the most important factors. Because they did their calculations manually, they did not have an opportunity to play with myriads of different techniques and ideas; they applied methods that they could rely on - otherwise they could loose their reputation (it would be the best case scenario, the worst case would be losing their heads).
Now, the technology itself. What I do is creating the "portrait" of Key Chart (which is the chart for October 6, 2008). This is the list of the most important factors:
Those two diagrams above simply show us how the situation of any chosen moment is close to this portrait. We do not analyze here how these phenomena affect the market (it can be done through Neural Network module); we just calculate the closest analogy periods to our Key Chart.
Technology for Timing Solution users
To
help you to conduct this kind of research, "Key Chart angles repetition" has
been developed. In Advanced version follow "Advanced"->"Key
Chart Chart similarity".
Here you should define the Key chart date. As an example, if we look for the periods in history that have the maximum similarity to October 6, 2008, we should input this date.
When necessary calculations are done, this diagram appears. There the peaks point at the most similar periods:
To
get the exact information about involved planetary pairs, follow these steps:
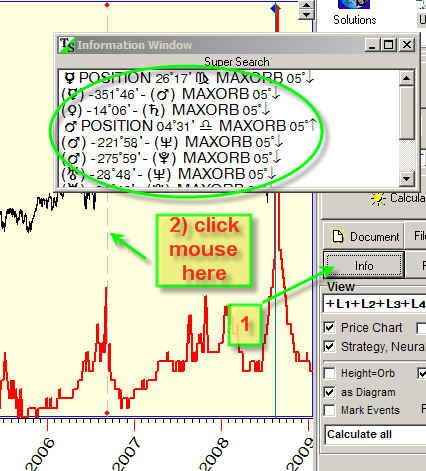
There are other features in this module.
First, you can open one of these standard Key Charts by clicking on this button:
Second, you can define several Key Charts clicking "Add this chart" button several times:
The program calculates similarity diagram that covers several Key Charts.
The only tricky parameter here is:
When you choose "Multiplication" option there, you are looking for the moments when all these three Key Charts work together, kind of "synergy" between these charts. For example if any of these charts has no analogy at all, we will get zero; all these charts should work together.
Setting the "Summation" option you calculate the summary effect of these charts. The difference between these two methods is especially obvious when you analyze more than three Key Charts.