Market Profile
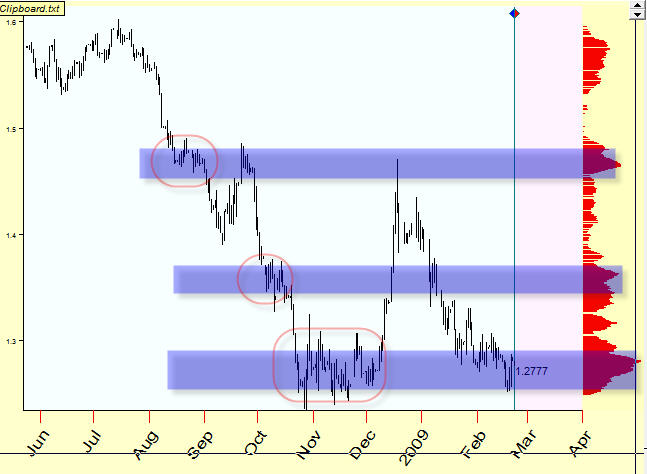
Market Profile is the classical technique that allows to specify "attraction zones" in price history. I downloaded daily Euro/Usd and ran Market Profile module ("Advanced"->"Market Profile"). This is what I have got:
Look attentively to this price chart. I marked price zones where Market Profile indicator is high (peaks on the market profile histogram in the right part of the screen).
As you see the price behavior on these levels is unusual. It looks like the stock market feels itself insecure on these levels, and these levels often represent support/resistance levels.
Thus you can consider the Market Profile as an indicator that indicates the most probable support/resistance levels.
Now some words about the parameters of this module:
View - allows to vary the view of Market Profile diagram, like this:
Last %X Bars - indicates how many price bars are used to calculate Market Profile. I recommend to vary this parameter, it looks like it depends strongly on the price behavior:
Bin size parameter defines the accuracy of this histogram, it works similar to moving average helping to eliminate random noise.
Normalize - this is a very important and interesting parameter.
For example if you set Volume:
You will get volume histogram. In other words these active red zones points at the price levels where the VOLUME is higher than average:
For option traders, this feature might be interesting. When we normalize to True Range (High-Low range) we will get the price levels where True Range (i.e. volatility) is high: