Timing Solution Advanced - Price Pattern Finder
This is a powerful module that allows to reveal similar patterns in the past, much more faster and effectively. Just run this module (Advanced->Price pattern finder), click "Calculate" button and you will see the most similar pattern (for my example, it took place in 2001):
We call this chart for 2001-2002 "Key chart". The program displays together the original chart and the Key chart, together with their time scales.
Also, you will see the list of Key Charts. Look at it. Each record has the ending date of the similar pattern of the price chart, the correlation between the two and the time lag parameter (i.e. how many days ago the similar pattern took place). You can highlight any Key Chart in the list to see it together with the analyzed chart. On the example below, the Key Chart ends on March 31, 2003 which has occurred 1803 days ago ("Time Lag" parameter):
Here are these two charts together:
The list of Key Charts includes similar pattern charts and mirrored charts as well. The mirrored charts are shown at the end of that list.
For example look at the last record:
It sends us to the year 2003-2004, and the chart is mirrored to our current chart:
In this case you may invert the Key Chart:
The most important parameter here that you may vary is:
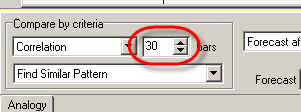
This is the length of the interval used to find the most similar pattern. Set this pattern at some small value (say 15 bars), and you will get this picture:
The situation in the beginning of 2008 bar by bar repeats the price history in February 2006.
See some other features of this module.
In the Options, you can set "Target". By default the program does a research of similarity patterns for Close. Also you can use other targets - like finding the repetitive patterns for RSI index.
This is one more option that allows you to figure out how this technique works:
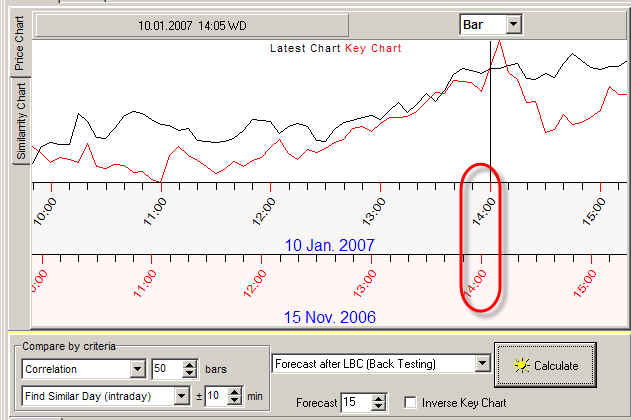
You can restrict your search by the position of Learning Border Cursor (LBC):
In this example the LBC is set to the end of December 2007. Thus the program is looking for similar patterns among the pieces of the price chart from August 2007 till the end of December 2007.
The data after LBC are "untouched" data, and they are used to figure out the forecasting abilities of the Key Charts.
There are additional options in this module that allow to search patterns more selective:
When you choose "Find Similar Year", the program finds the most similar year. Use this option for daily and weekly data only. For example today is August 18, 2008; it is our base date, and we want to find the years with similar price patterns. We compare data around August 18, 2007, then for the year 2006, etc. trying to find what year is the most similar to the base one in regards to the price patterns. The program sends us to the year 2002 as the most similar and gives us some hints for the future:
The program adjusts days of the year with the accuracy of 5 calendar days.
The next choice "Find Similar Day" works for intraday data:
For example we need to compare price charts with the adjusted time:
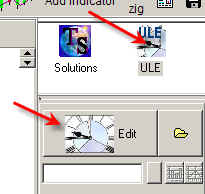
The last line in the drop-down menu of "ULE" filter allows to use this module together with ULE module.
Let me show how it works. As an example, we will look for similar price charts not for the whole available price history, but only for those periods when Republicans have been in power in USA (this is one of the options of ULE module).
Go to ULE module
set in "Fundamentals" tab the event "Republican in power":
Click calculate:
The program will show you the periods when Republicans have been in power for the chosen interval, together with the price chart:
Now the program analyses the charts only for these periods looking for the similarity:
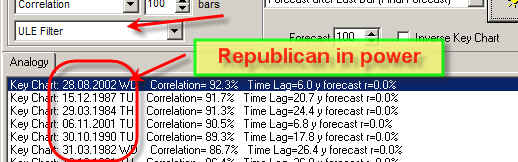
In ULE module you can define very complicated events, like "Republican in power and Jupiter retrograde", and the program will find you the most similar chart when "Republican in power and Jupiter retrograde".