Stock Memory (SM) in Timing Solution
Now practically everywhere in Timing Solution we use Stock Memory (SM). What does it mean? In brief, stock memory is a number of whole cycles. However, it has different flavor in different modules.
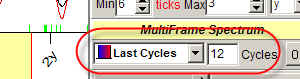
Let us start with the Spectrum module.
Here we use Multiframe algorithm to calculate the spectrum diagram. Stock memory parameter here is 12. It means that:
we use last 10x12=120 bars of price history to calculate 10 bars cycle;
we use last 50X12=600 bars to calculate 50 bars cycle;
we use last 100x12=1200 bars to calculate 100 bars cycle.
In other words, calculating some cycle we should use 12 times more price bars than the length of that cycle. If the stock memory would be 10, we need 10 times more price bars to calculate the same cycle.
This is a very obvious approach: to reveal long term cycles we need to analyze more price history. This type of spectrum treats equally short and long term cycles.
From the other side, we have to recalculate this spectrum when the new price history comes.
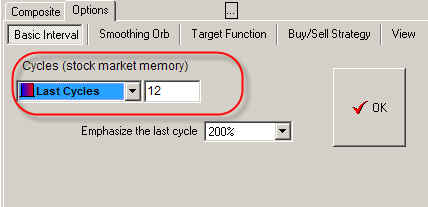
When we use "drag and drop" technology (see here http://www.timingsolution.com/TS/Study/E/4.htm ) to calculate the projection line based on cycles, the program asks us to input stock memory here:
This SM parameter differs from what has been discussed above. Here it shows how many price history is used to adjust the analyzed cycle. (The cycle is revealed already, and now the program creates the projection line based on this cycle.) The stock memory parameter here shows how long the cycles live in time before disappearing.
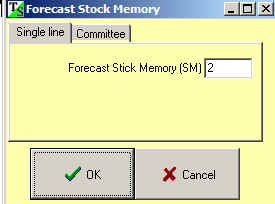
Varying SM here, we calculate committee diagram:
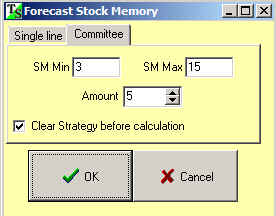
The committee diagram gives us the bunch of projection lines. The projection line with small SM (red line) reflects the cycles that live short time (3 full cycles), while the blue projection line with SM=12 involves longer cycles:
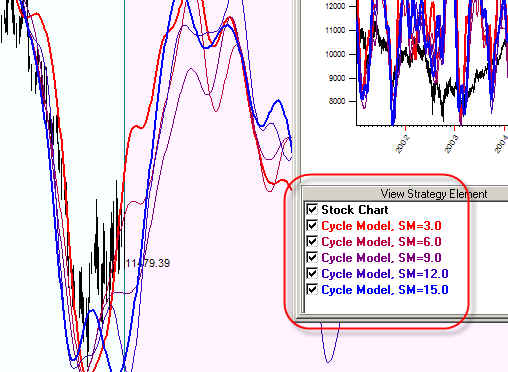
We can say as well that Stock Memory works as a filter for cycles. Usually the projection line with smaller SM is more choppy - because smaller SM provides smaller degree of filtration; it increases the amount of occasional cycles involved into the process. The bigger SM means that this filter is more picky, it allows smaller amount of cycles to form the projection line.
The same technology as in the first example is applied when we calculate the projection line based on astro cycles ("Astronomy" module). For example, to calculate the Annual Cycle, we may use 3 years of price history, or 5, or 7, 12 - whatever you define here: