Nyquist frequency - door into Chaos
I would like to start this article with some question from TS user and some definition:
The question from user:
Please explain how this works. Using different harmonic
settings produces different sensitive degrees. I get how this works on a graphic
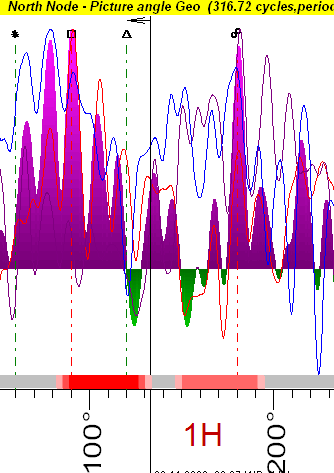
ephemeris, but it doesn�t seem to be the same here. On the 1H chart, the
sensitive degrees are diffused and showing 90*-120*.
On the 4H chart, the sensitive degrees are tight and
dark red and 71*-81*.
Definition:
Nyquist frequency: it is named after the Swedish-American engineer Harry Nyquist; he has spent a lot of time determining the minimal time tick to be able to see a cycle. For us, it is important to remember that if we are working with daily data, it is no use to try catching the cycle lesser than two days (nyquist frequency); if we have 15 minutes data, the 30 minutes is the shortest cycle to use. Based on my practice, I would recommend using 5-7 ticks; i.e. for daily data use the cycles with a period higher than 5-7 days. I would say that Nyquist frequency is a door to a kingdom of Chaos. Keep this door locked.
Answer:
The answer to this question is: this composite cycle is too noisy. Why?
Here we analyze daily data. The period of this cycle is about 28 days. As you know now, the minimal cycle/movement we can analyze is 5-7 days movement. All movements within this movement are very chaotic.
Now let's calculate this interval in terms of cyclic movement:
The analyzed cycle covers the full cycle within 28 days i.e.
360 degrees -> 28 days
It means that 7 days of this cycle correspond to 90 degrees interval.
Therefore, in this composite diagram, 90 degrees interval is the smallest movement we can observe, all smaller movements within this interval can be consider as chaotic movements.
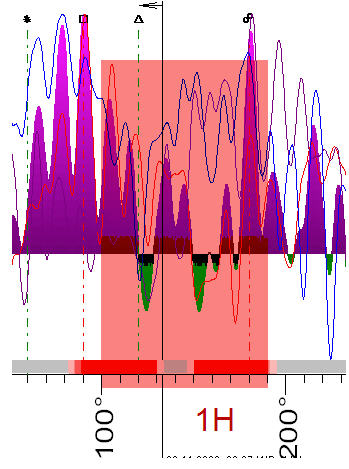
So my recommendation is to increase the smoothing orb, it is here:
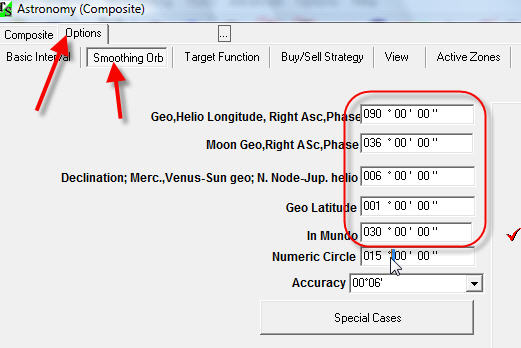
Here I set 90 degrees orb; it makes the composite curve smoother, and this way we filter the chaotic movements.