Forecast with 2D planetary distance charting tool
Before any discussion, I must mention that this is a totally experimental technique. In this article, I show the possible way of applying this charting tool as I see it now (September, 2009). The main idea of this technology is explained here http://www.timingsolution.com/TS/Articles/ptd/
The final forecast made with this tool looks like this:
The ellipses represent possible support levels. Remember that these support lines "exist" in time-price Universe, i.e. they indicate price levels in respect to the time when these levels will be reached.
Here you can download Timing Solution worksheet with this example (for Dow Jones Industrial Index).
Now, let me explain step-by-step how to calculate these ellipses.
Step #1: Start with specifying the most important turning points.
I choose the last 5 turning points for the year 2009, here they are:
The last turning point A (August, 28 2009) is not confirmed by the downtrend movement, though I tend t consider this point as a reversal point due to confirmation it by Annual cycle:
Step #2: Apply 2D planetary distance charting tool. Simply take this 2D planetary distance charting tool and connect points A-B, B-C, C-D and E-F by mouse clicks.
I recommend to start with A-B line; it connects the most recent turning points. Do not worry about involved planets and the scale, we deal with them later. This is what you should see on your screens:
I recommend to use "snap" mode to catch the nearest turning points automatically, this button should be pushed:

Step #3: Find the HARMONIC proportions. We are looking for a hidden harmony and hope that this harmony exists.
As you can see the distance between points A and B is 161.51 degrees, B and C - 83.10 degrees etc.
Now we try to find the ratio that corresponds to these harmonic distances between turning points (we will look for something like 360, 180 120 ... degrees between turning points).
In order to find these proportions, open Charting Panel clicking here:

and click "2D" button there:
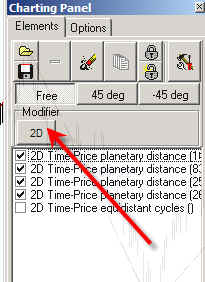
You will get the window where you can vary the parameters for all charting tools:
For example you can set price/degree scale to 20; click Ok and see how the distance between major turning points changes:
We can vary this parameter and watch how the distance between turning points changes, trying to find the parameter that provides us the harmonic distances.
You can do this procedure automatically: click "H" button and choose the harmonic distance there (90 degrees in this example):
The program has found the ratio=20.415 that corresponds to 90-degree distance between turning points A and B:
Pay attention that in this case the distance between:
B-C=46 degrees (close to 45 degrees)
C-D=151 degrees (close to 150 degrees). It is a confirmation that this proportion works.
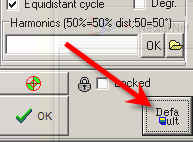
So we may use this proportion (20.415) for forecasting. Click "Default" button:
Step#4: Forecasting Now the time comes for "2D Time-Price equidistant cycle" charting tool:
Choose it and click the mouse on point A:
You will see the equidistant cycles that show the harmonic distances from point A.
I used these harmonic distances: