Bradley Siderograph - Part II
Donald Bradley in 1940th applied the methods of classical astrology to financial analysis. His Siderograph shows us the balance of "good" and "bad" aspects. And this is quite logical. Nowadays nobody argues that the mass psychology is one of the most important factors of stock market behavior, and astrology used to deal with human psychology three thousands years at least. In early 1940s, it was impossible to solve this task better than Donald Bradley did. One of the reasons is that it needs a lot of calculations. Sure the first computers appeared just at that time, however they were busy calculating the first atomic bomb project (Los Alamos). Bradley did a great job, and he did it very well taking into account the means available to him.
I am not going to repeat here how Bradley's Siderograph works. You should know it already from the Part I or from Bradley's book. I suggest you to look at this problem with the eyes of the third Millennium's representative. The most argued and the most uncertain question here is how really the aspects affect the stock market. We need to make a difference between human behavior and the stock market's behavior.
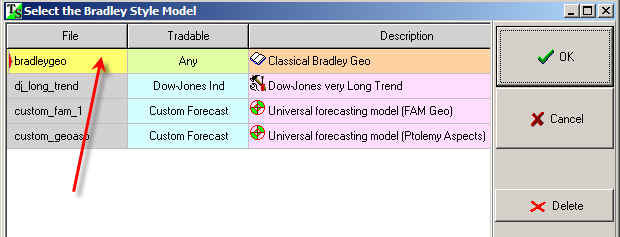
Download DJIA for the last 8 years (2001-2008). Let us run Bradley Barometer ("Solutions"->"Bradley Barometer"). You will get the library of Bradley Models:
Choose the first one: "Classical Bradley Geo"; after the calculations you will get a projection line based on Classical Bradley model:
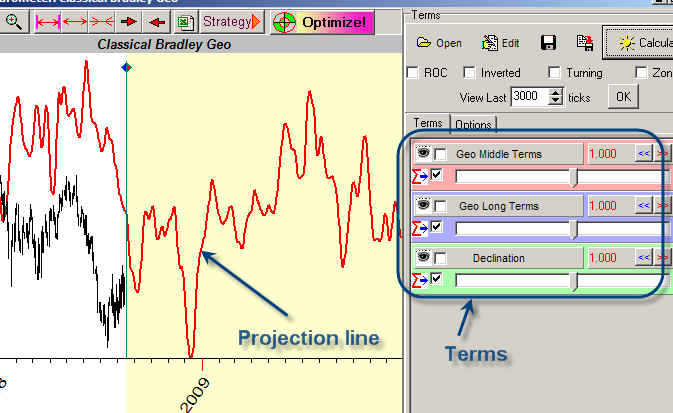
In the right part of this window you can see the set of slides that allows to vary the weight of Middle/Long/Declination terms of Bradley model. When you move them, the projection line is recalculated automatically. This is good; however for the stock market reality we need to analyze the effect of each aspect separately. The experience shows that some astrologically "good" aspects are not so good for the stock market.
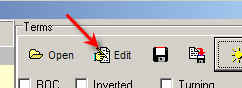
OK, let us do this analysis. To edit the weight of any aspect, click this button:
You will get this window:
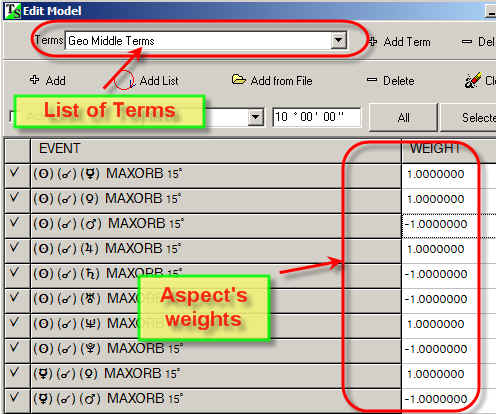
Here you can choose any term (Middle/Long/Declination as Bradley used), and for each aspect you can see the table with this aspect's weight.
Try to change the weight of the aspect; say make the Sun conjunction Mercury aspect five times more powerful.
In order to do that, move the mouse cursor on the cell with the weight to be changed, make a mouse click there, type there digit 5, and move the mouse cursor on any other cell to confirm the change:
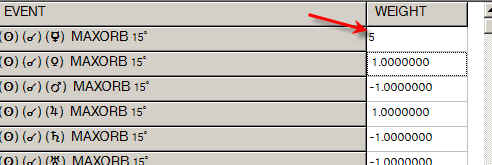
You will see that the program recalculates the projection line immediately. Thus you can change the weight of any aspect and watch how that change affects the projection line.
Next step is Optimization. For this particular model, we have almost two hundreds of planetary aspects combinations, and it takes a lot of time to adjust manually the aspects strengths to get a good projection line.
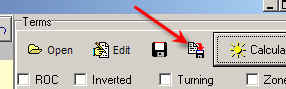
To speed up this procedure, click this ![]() button. You will get the "Optimization panel":
button. You will get the "Optimization panel":
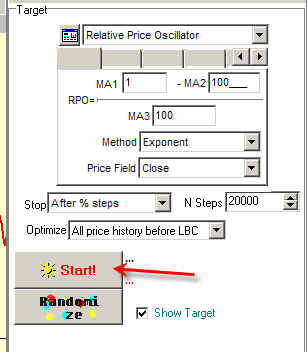
Just click "Start" button; in some seconds you will get the new projection line adjusted to your financial instrument:
Clicking this button 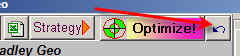 ,you can set the weights of the aspects in the previous state.
Now look at the weights that program has found for Dow:
It would take a lot of time to do this job manually. Just look at this table attentively, and you will see that astrology works. There are a lot of negative weights for square aspects, while trines are practically all positive. This is pure mathematical fact. The program didn't know astrology, it knows astronomy to calculate aspects and the price history to adjust the weights of these aspects.
I would like to mention the most important options in this module.
Pay attention to the indicator that is used for optimization (1)
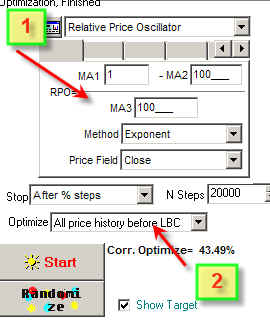
Here I used the relative price oscillator with the period 100 bars, do not use too short oscillators (like 10bars oscillator). They are too noisy.
You can adjust your projection line to all available price history before LBC, or you may use some specific interval:
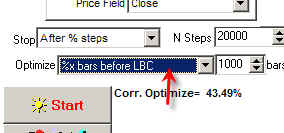
Here the last 1000 bars (4 years for daily data) are used to adjust the projection line. It is a good practice to use 1-2 full Presidential cycles of price history (4-8 years = 1000-2000 bars for daily data) to adjust the projection line.
When you change the weights manually, it takes some time for the program to recalculate the projection line. To speed up this process, we can calculate not the whole projection line, but only last 3000 ticks. Try to vary this parameter:
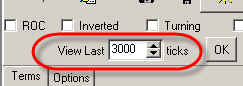
If the program works slowly when you modify the weights manually, try to decrease this parameter.
And finally you can save your work clicking this button: