Events Box module
Events Box module allows to design astro based models manually. In Timing Solution there are modules that generate the projection line automatically; they analyze past price history, select automatically the events that play a significant role and assign the most optimal weights for analyzed events. These modules are: Neural Network, Bradley Barometer, Composite.
However, I have received many requests to develop a module that allows to generate the projection line manually. This new module will allow to apply users' knowledge and consideration in regards to each astronomical/astrological phenomenon.
Black Box module has been developed special for these users. You can run this module clicking this button:
Let's create together the simplest model based on major aspects. Click this button:
I believe you remember this dialog box; it allows to create the list of phenomena.
For example, you may create the list of 180 major aspects. Fill in the form this way:
Now click "Calculate" button:

In several seconds you will see on the Main screen the projection line based on chosen aspects:
Now is the time to modify our model. The most important parameter here is the weights of the analyzed aspects.
Just try to modify the weight of one aspect first ( let it be Weight=10 for
the Sun conjuncting
Mercury in our example), and you will see how the projection line is changing:
Pay attention to the fact that the program modifies the projection line immediately while you change the weights. It means that you can see the result of your actions immediately
You can also highlight a group of cells (using "Shift" button) and set the same weight for ALL highlighted cells:
and the program recalculates the projection line again.
When you work with the real price history, you need to adjust the weights of aspects that are active on some specific interval; there is no need to know all aspects, it is enough to know only aspects that are active. As an example, consider aspects that work within January 2010.
In order to do that select January 2010 interval in the Main
screen and set on this option ![]() in the Events Box:
in the Events Box:
Now you can see all January 2010 aspects.
Also, the useful feature is an ability to see how each aspect works: set this option ON ![]()
and as soon as you highlight any aspect (the Sun - Mars opposition in our example) the program displays the diagram that shows how this aspect works (a purple diagram):
You can use this feature to adjust aspects weight. It works like this:
Let\s say that you see some discrepancy between your projection line and the price in the beginning of March 2009; your model "does not see" the bottom that has been formed at this time:
Look at all aspects that have worked within this period; do it setting these
options: ![]() and
and ![]() .
.
Then go through the list of these aspects one-by-one to see their performance. One of the aspects to watch is the opposition between the Sun and Saturn:
You may decide that this aspect plays important role in that bottom (it is strong enough, coincides with the bottom though it is reversed, other considerations). Thus, to describe this bottom, assign a big negative weight for this aspect. I made it as "-10" ("-" because it is reversed). See how the projection line has changed:
Then I recommend to look how this aspect has worked in the past (its presence when bottoms occur to the price). If it does not work the same way, try another aspect (for example, the Sun's conjunction with Uranus).
These buttons 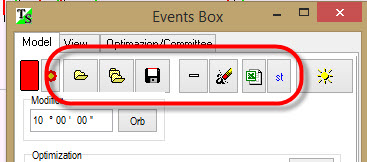 allow to save what has been done, delete any term (=aspect in our example) from
your
formula or add a new element to it.
allow to save what has been done, delete any term (=aspect in our example) from
your
formula or add a new element to it.
You can also change the orbs for analyzed aspects. In order to do that, you need to highlight the events, type the orb that you plan to set for highlighted events and click "Orb" button:
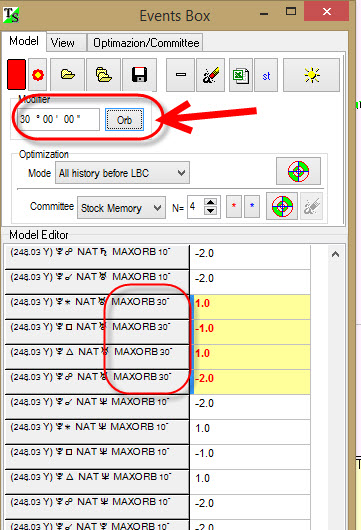
You see that the orb for highlighted events is changed to 30 degrees in our example. Do not forget to click "Calculate" button to update the projection line with new orbs:
In most cases the procedure of finding the best fitting weights maybe a very time consuming procedure. Usually we deal with a set of contradicting factors, and we have to find the best balance while looking for the best solution. The task of finding the optimal weights for %X financial instrument is called the optimization procedure. "De facto" Neural Network module is based on an optimization procedure as well, in this module we provide the simplest version of optimization. Moreover in most cases this simplicity has more advantages than disadvantages.
Let's look how this technique works. As an example we will analyze "Heliocentric declination index". The diagram below shows this index together with Dow Jones Industrial Index (red curve):
This index is a sum of heliocentric declinations for the planets from the Earth till Saturn.
Now let's analyze this index with Events Box module. Download it following these steps:

Choose this model from Standard Events Library:

The best feature of this module is the possibility to play with this index varying weights for each term and watching how the projection line based on this model changes:
Now let's delegate this task to the program; now the program will perform this job. We will find the optimal weights using last 2000 bars of the price history (for daily data this would be 8 years). Follow these steps:
This is the optimal projection line from the mathematical point of view. Though now the process is automated, I recommend to vary these weights manually, like increasing weight for Mercury we can add more Mercury vibrations:
Here we used last 2000 bars to adjust the projection line, in other words the program is looking for the optimal weights for heliocentric declination using last 8 years of the price history (=2000 bars).
Why 2000 bars? Why not 500 or 1000 or 5000 bars? The committee technique is very convenient feature that allows to handle this problem the best way. We adjust our model using last 500 bars (i.e. 2 years) price history, 1000 years price history ... using the whole price history. We draw all these projection lines together. Thus we can see all possible ways of the price movements for the analyzed model.
In order to calculate the committee, simply click this button:
and you will see the bunch of the projection lines which are based on the heliocentric declination:
More about committee technique and its usage see here: http://www.timingsolution.com/TS/Mini/12/index.htm
I recommend to try committee technique for different astrological/astronomical models.