Back Testing of Similarity module
The similarity module allows to reveal the similar patterns in the past. It means that if we find some similarity between the market today and its behavior in the past, we can make a prediction for future price movements.
Look at this picture:
The program has found some analogy between price movements in 2003 and 2009 years. We may assume that this analogy can be prolonged into the future: 2004 and 2010, giving us some clues regarding future price movements. So, basically speaking, our task is to find such analogies and then create forecasts based on these findings.
In our example, we used last 250 bars of the price history (July 2008 - July 2009) to find such an analogy. This parameter is called "order"; it is here:
The question is: how much price history should be used to get a reliable forecast, i.e. what "order" parameter is the best for this model?
Also, we need to know the prediction horizon - how long this forecast will work: a month, three months, half a year?
If you used to work with committee technique, you need to know as well one more thing -the amount of prediction lines in the committee:
Answers to all these questions can be received in back testing module. It is here:
All the job is done by the program; you need only to define things that need to be explored: order parameters for the optimization procedure, forecast horizons and the amount of lines in the committee.
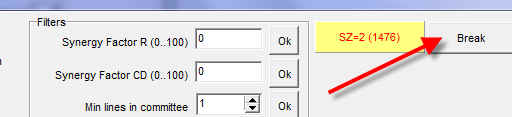
Click "Run BT" button and wait a bit. When the sample size
parameter ![]() reaches at
least 100, click "Break" button:
reaches at
least 100, click "Break" button:
What does the program do here? It performs Walk Forward Analysis (WFA): it changes the LBC position, performs all calculations for this particular position of LBC and watches how well our models forecast the future. It tries different models with different "order" parameters.
After the calculations, you will get this table:
This table shows that the best model has order=30 and it forecasts 10 bars ahead. Now (when these parameters are found) you can use them in the Similarity module. If you set them exactly as in this example, do not forget that after 10 price bars (i.e. in two weeks for daily data) this forecast does not work, you need to find something else:
There is one more important parameter I would recommend to play with. It is "Criteria" parameter:
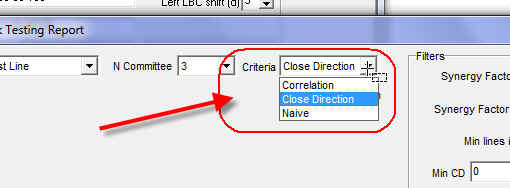
This parameter depends strongly on your prediction horizon. If you plan to forecast 5 or 10 or 20 bars ahead, I would recommend to use "Close Direction" CD criteria. The CD criteria compares the final price movement. As an example, it compares the price now and the price in 10 days and checks whether the model points correctly the general direction of the price movement (i.e. whether the price is higher or lower). This criteria does not care about the details of the price movement within the time interval in question, it analyzes the final price only. It allows to analyze statements similar to this one: with %X probability the price in ten days will be higher than the price now.
For the forecast horizon 50 and more bars I recommend to use the correlation
criteria, it is in this scroll-down menu: 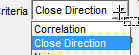
If you prefer to work with committee projection lines, highlight this item:
It also allows to find the best order and forecast horizon.
eave this option as it is: ![]() or set it to zero. It allows to exclude %X bars around LBC. Sometimes the models
are too concentrated on the latest price movement (latest in regards to LBC
position), and this is a way to overcome this phenomenon.
or set it to zero. It allows to exclude %X bars around LBC. Sometimes the models
are too concentrated on the latest price movement (latest in regards to LBC
position), and this is a way to overcome this phenomenon.