Pentagram models
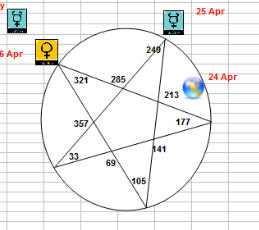
Let's call a pentagram model the model like this one: the important events on the stock market are separated by 72 degrees of heliocentric planetary movement:
In other words, we take some point as a starting point, and all other points should be separated from that one by 72 degrees. The idea behind it is that when a transiting planet hits the nodes of such a pentagram (like on the picture above), something important happens to the market. (Remember, it is not a practical recommendation, it is just some statement, and we do not know yet whether we can trust it.)
How to test this statement with Timing Solution software?
I think the best way is to apply planetary steps charting tool. Download the price history and follow these steps:
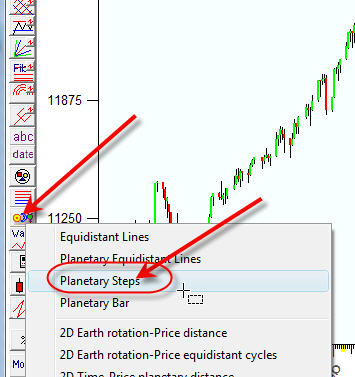
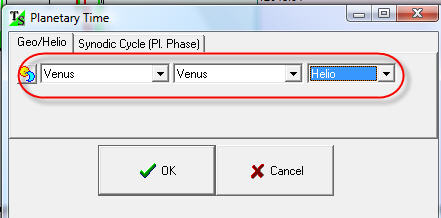
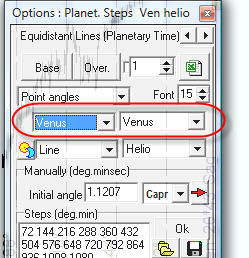
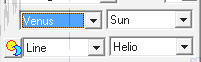
Choose a triggering planet and Zodiac (I've set heliocentric Venus):
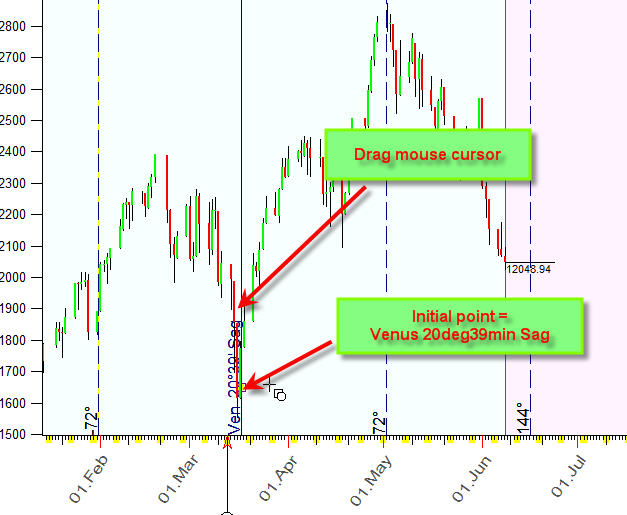
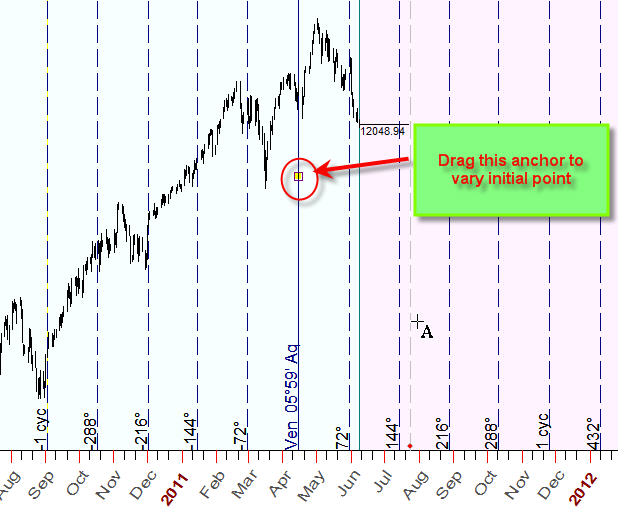
Now drag the mouse cursor, set the anchor on some important moment of the stock market history - this is the initial point:
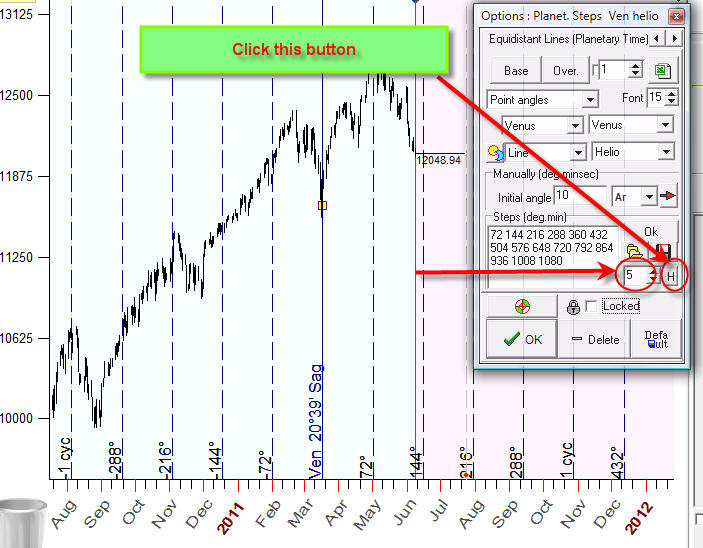
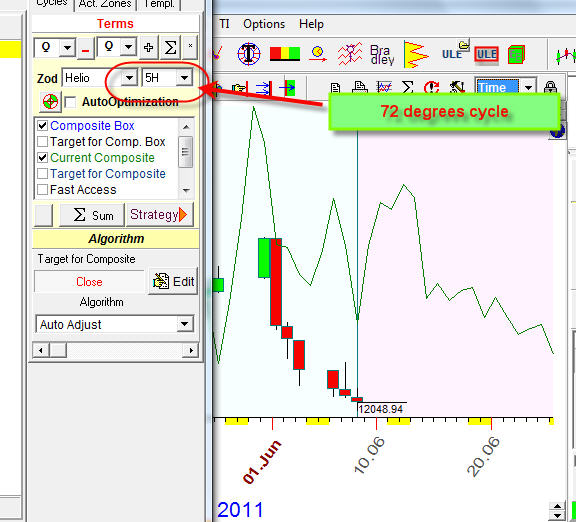
When the mouse button is released, you should get this dialog box:
* *****
*****
Set 5H harmonics there to get steps 72 degrees, 144 degrees, 216 degrees etc.
Now you will get equidistant lines separated by 72 degrees of planetary movement.
I recommend to try different variations of this charting tool:
1) You may want to start with moving the initial point (dragging the anchor). The program shows the planetary position for this initial point:
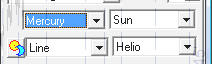
2) Try different planetary combinations - like Mercury, the Sun, etc. - to figure out what planets forecast the stock market better than others:
I recommend to play with planetary phases:
Mercury phase:
Venus phase:
etc.
Also try to create composite diagram using 5H harmonics, do it this way:
this approach allows to generate a projection line based on 72 degrees movement. You can compose a model that involves several planetary combinations: http://www.timingsolution.com/TS/Study/Classes/class_comp_4.htm