Active degrees/angles
In this class I would like to explain how to reveal active degrees in respect to different stock market phenomena. After learning this material, you should be able to evaluate quickly the statements similar to following:
In other words, you will be able to consider specific market phenomena (turning points, up/down movements, a crash, etc.) in regards to specific astro phenomena (a planet's position, an angle between two planets, planetary speed, ingresses, midpoints, etc.) Please keep in mind that my purpose is not to claim that some of these statements are true or not true. I will show you only a possible way to consider these two sets of facts.
You can do it easily with Timing Solution software.
Let us start with the analysis of turning points.
When dealing with turning points, the first question that arises is how to identify them. Usually turning points are revealed by calculating a filtered zigzag. Here it is (look at red swings):
You should define only the minimum swing percentage; thus you define the degree of importance of identified turning points.
After the turning points are calculated, you can use them together with our astronomical calculations. It is very easy; just run "Astronomy" module and follow these steps:
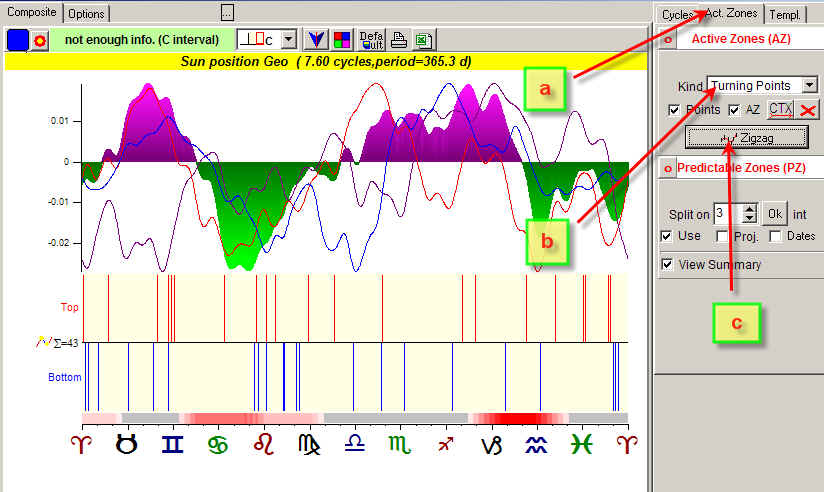
a) choose "Active Zones" tab;
b) highlight "Turning Points" item;
c) clicking ![]() you
define the parameters for zigzag. You need to move this slide:
you
define the parameters for zigzag. You need to move this slide:
![]()
It shows how many turning points can be identified by this zigzag: ![]() .
.
The program will calculate the planetary positions (in our example, Venus's positions) for all turning points and will show them all on this diagram:
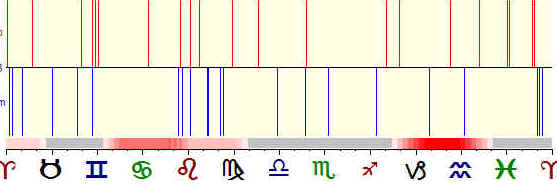
Red stripes represent top turning points, while blue ones show bottom turning points. Thus you can easily see what Zodiacal positions are more typical for turning points.
The same way we can research the angles between planets. See on the picture below the diagram calculated for the angle between the Moon and Neptune:
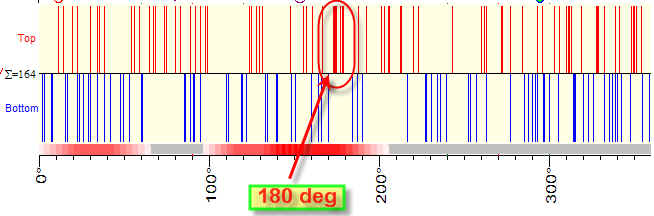
Here we have a small red cluster close to 180 degrees. It means that when the angle between the Moon and Neptune is close to the opposition (180 degrees), the top turning is more probable.
Next example is to research the extreme price movements. Choose this item:
Define the value of the price movement. For our example, we will research the moments when the price makes a big movement (5% in our example). We put all these points on this diagram:
Red stripes show when the stock market moves up at least 5%, blue ones are for a similar down movement.
The picture above shows a cluster in September-November. It means that significant price movements are more typical in fall.
There is one more possibility to research any phenomena in respect to the planetary angles.
For example, let us research the major stock market crashes for the last 100 years. There we have to do a part of the job manually. Why "manually"? Just because the stock market crashes are not a big price drop down only, they are complex phenomena. So I would prefer to define these dates by hand.
It is a very simple thing to do: in c:\TimingSolution\Fundamentals\ directory you should create a file with extension *.fnd_d. Suppose it is the file c:\TimingSolution\Fundamentals\\crashes.fnd_d
Just type there the most important crashes using any editor (like Notepad). This is the content of this file:
COL=2
TIME=10
7/16/1893 1
12/18/1895 1
12/12/1899 1
10/27/1929 2
8/17/1937 1
5/12/1940 1
5/24/1962 1
2/9/1966 1
10/29/1973 1
10/15/1987 1
10/24/1997 1
9/11/2001 1
The dates format is mm/dd/yyyy.
COL=2
TIME=10
Keep these two strings as they are.
Now choose "Fundamentals" item and click "Fundamentals" button:
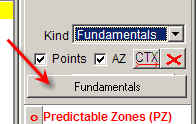
Find there your file:
and you will see the positions/angles that are the most typical for the stock market crashes:
As you see there is a cluster in the end of Libra - beginning of Scorpio.
You can use positive and negative values when you create your phenomena file, like this
10/24/1997 -1
12/12/1995 +1
9/11/2001 -1
In this case red stripes will present positive values, blue -negative ones.