Creating quantum indicators and verifying indicators
We can create many indicators. But - can we rely on them? It is important to find a way of verifying these indicators. This is what the article is about. Here I would like to introduce a technology of creating verified indicators. This technology is based on features of Trading Strategy Constructor module ( http://www.timingsolution.com/TI/1/index.htm ).
Trading Strategy Constructor module analyses thousands of trading strategies that are based on different principles. It includes well-known moving averages crossovers as well as more advanced quantum models and, digital signal processing (MESA, John Ehlers approach http://www.timingsolution.com/TI/2/index.htm ).
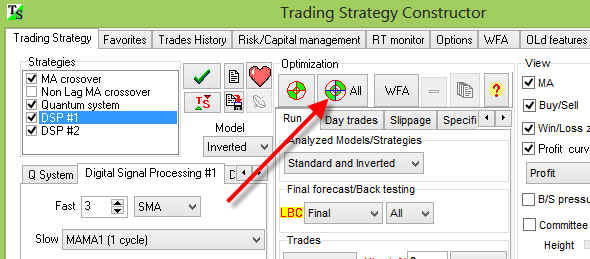
The module works this way: download the price history data, then run "Trading strategy constructor" module ("TI" section) and click "All" button to find the best trading strategy:
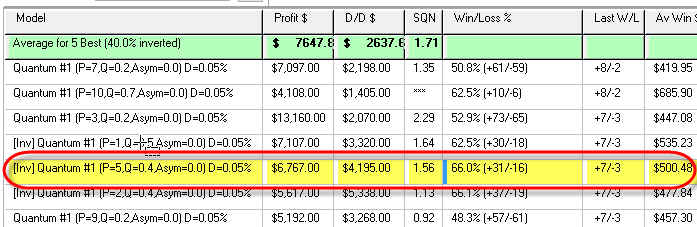
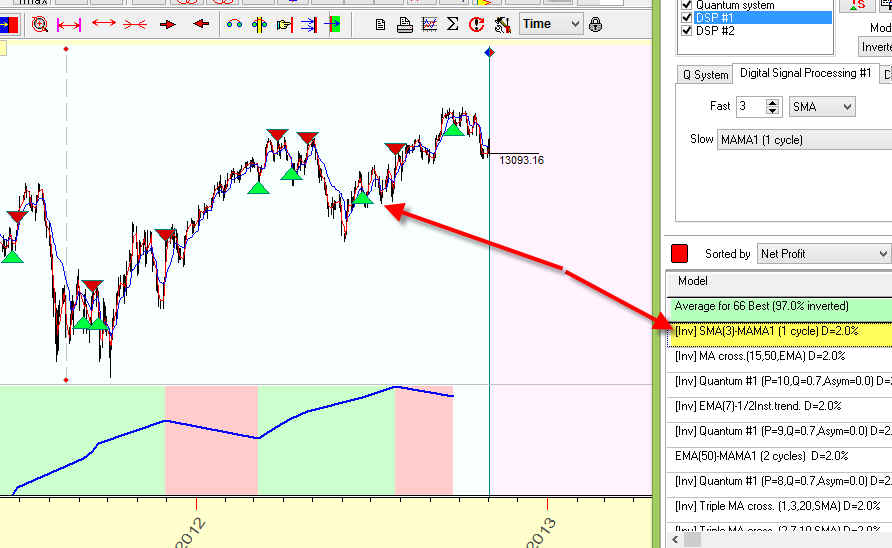
In seconds the program analyses thousands of possible strategies and displays the strategies that provide the best profit. Here they are:
 ng
ng
As you see, the best models are:
 - inverted crossover of two moving
averages simple moving average with smooth window=3 and MAMA (Mesa adaptive
moving average)
- inverted crossover of two moving
averages simple moving average with smooth window=3 and MAMA (Mesa adaptive
moving average)
 - inverted crossover of two
exponential moving averages with window 15 and 50
- inverted crossover of two
exponential moving averages with window 15 and 50
 - variation of quantum model
Highlighting any of these models you can browse on the Main screen how this models works:
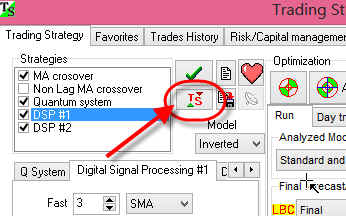
New let's create an indicator based on any of these strategies. Highlight some strategy and click this button to run "Trading strategy" module in a separate module:
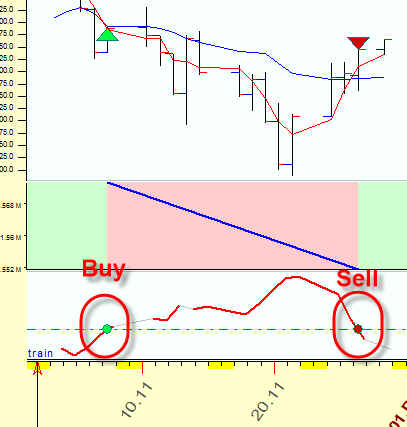
This module displays trading signals for the chosen strategy together with the most important thing - buy/sell function for this strategy. Here it is, in the bottom of Main screen:
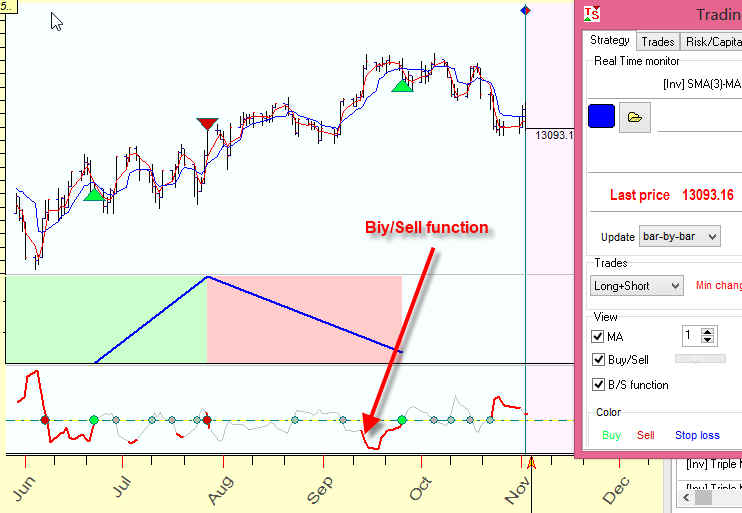
How does this buy/sell function work? This is very simple - the system generates a buy signal when buy/sell function crosses zero lever from negative to positive zone. In other words, when buy/sell function moves up, we expect up trend movement. This moment is marked by a green circle. Accordingly, a sell signal appears when buy/sell function crosses zero level from positive to negative zone, buy/sell function moves down, we expect down trend movement. This moment is marked by a red circle:
You can see there many non active crossovers as well. They correspond to "false" signals, these moments are marked by gray circles:
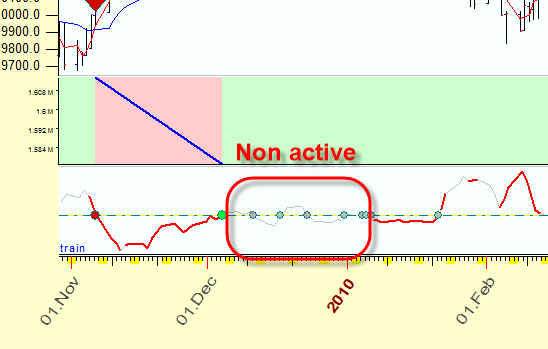
In the example above you have seen a buy/sell function that was based on moving averages crossover. Here is the example of buy/sell function that is based on quantum model:
As you see this function is sharper, more jumpy. It means that quantum model catches the changes in the stock market behavior that happen very fast.
How to choose the models?
Start with checking the quality of the equity curve, it should not have big drawdowns.
For daily chart always check how the model has worked for the last 10 trades, it is here:
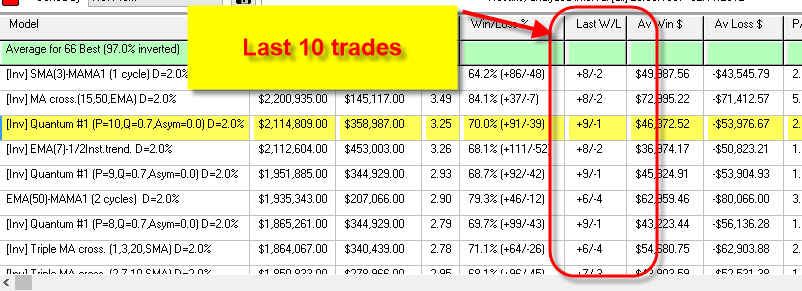
The first model here has 64% profitable trades plus 8 from 10 last trades was profitable
The situation with intraday charts is more complicated; I have no final idea yet how to choose the models for intraday.
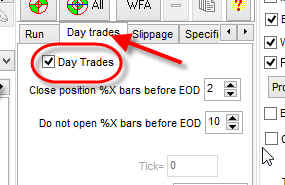
Do not forget to set "Day Trades" ON to exclude overnight trades:
Try to sort models using "Last win/loss" criteria:
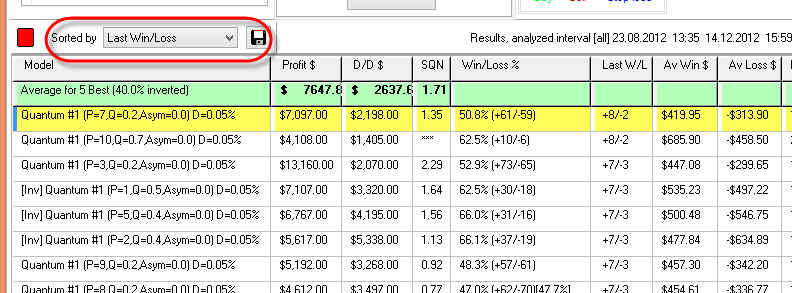
and choose the profitable model that provides good values for "Win/Loss" and "Last Win/Loss" together. I have chosen this one: