Natural cycles module
Natural cycles module allows to calculate fast and easy the most important cycles - like Annual, diurnal (for intraday data), monthly and other cycles.
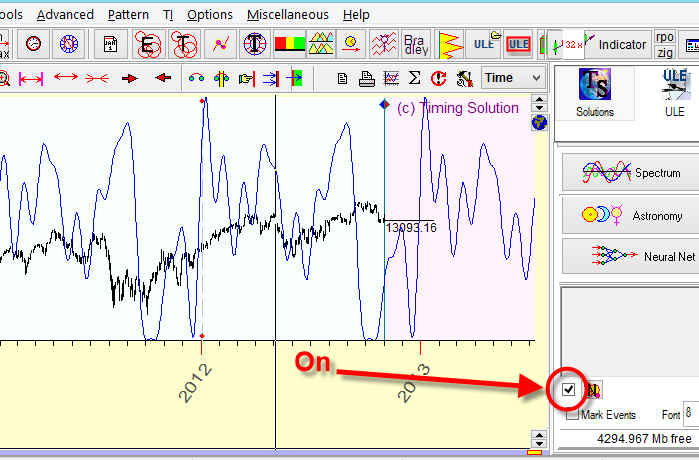
It works very simple: after downloading the price chart, set this option ON and watch for all these cycles together with the price chart:
Let's look at these cycles in details. Click this button:
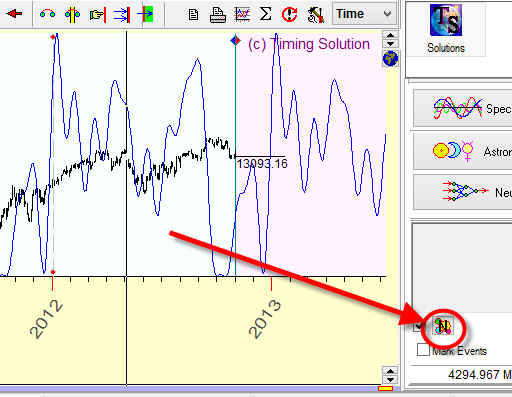
and you get this window with the list of available natural cycles:
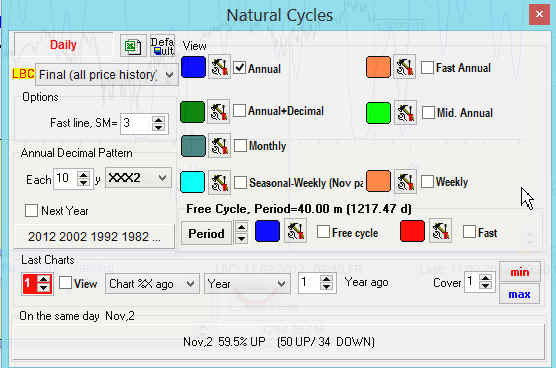
Remember that this window looks differently for daily and intraday charts. It is so because different cycles are used for daily (weekly, monthly) and intraday charts.
Let us start with the exploring natural cycles available for daily charts.
Annual cycle
![]()
This is Annual cycle which is based on all available price history data. For example, if you have downloaded 20 years of the price history, the program uses all that price history to calculate Annual cycle.
Parameters
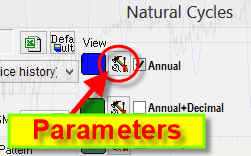
Pay attention to this button that is available for each cycle; it allows to modify the parameters for each cycle. Here they are:
You can modify the color and thickness of the projection line for any cycle as well as the amount of harmonics. For example, look at the Annual cycle calculated for Dow Jones Industrial Index with different amounts of harmonics:
One harmonic; it shows general seasonal tendency:
Four harmonics:
24 harmonics:
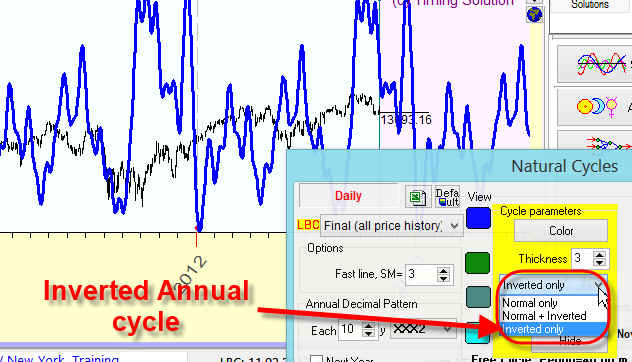
This option allows to display an inverted projection line only or both of them together, a normal and inverted one:
Fast Annual cycle
![]()
This is Annual cycle based on the last three years of the price history data.
Recommendation - Annual committee
Working with Annual cycles, pay attention to the moments when two Annual cycles - standard (blue) and fast (red) - show the same direction of the price movement:
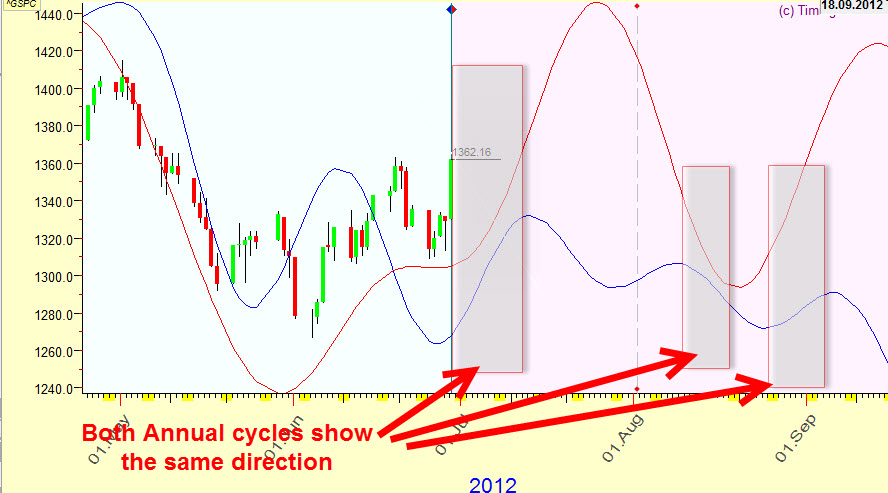
The probability of the price actually moving in that direction is higher when both Annual cycles go the same way.
Annual+Decimal, Annual+Presidential and other cycles
![]()
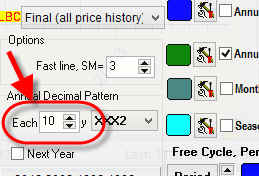
This option shows a patterned Annual cycle based on different patterns. The option was made as an opportunity to explore the basic Annual cycle in regards to some time patterns. Consider a decimal pattern. Some researchers claim that the market repeats itself (or its main tendencies) every 10 years. For example, to calculate Annual cycle for the year 2013, use these years: 2003, 1993, 1983, 1973... Following this theory, the program reveals the Annual pattern for these XXX3 years.
By varying this parameter:
you can calculate Annual patterned cycles based on other (not decimal) cycles. For example if you set this parameter to 4 this way:
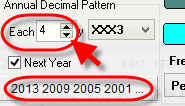
you will calculate Annual+Presidential (USA) cycle, i.e. to calculate Annual cycle for year 2013 these years will be used: 2009, 2005, 2001, 1997... in other words, only the second year of the Presidential cycle is used. The program reveals the Annual pattern for second Presidential (USA) year.
BTW, sometimes the situation like the one described further takes place: we calculate Annual+Decimal cycle in December 2012, so the program calculates the Annual cycle for XXX2 decimal, and we need to calculate Annual+Decimal cycle for the next year 2013, i.e. Annual cycle for XXX3 decimal pattern. In order to do that set "next year" option ON:
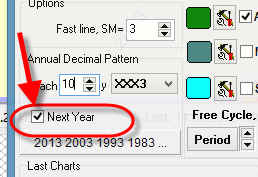
and program will use next year as a base to calculate the decimal pattern.
Mid Annual cycle
![]()
The program calculates the Annual cycle using the last 12 years of the price history.
Monthly cycle
![]()
The program calculates the typical price movement within one calendar day starting from the first day of the month and ending with the last day of this month,
Seasonal+Weekly cycle
![]()
This is patterned cycle, it calculates the typical weekly movement for each month of the year. For example, the program calculate the typical weekly price movement for July.
Weekly cycle
![]()
This is weekly cycle calculated for all available price history.
Free cycle
You can define your own cycle, and the program will calculate the projection line based on this cycle.
For intraday chart these cycles are available:
Diurnal cycle
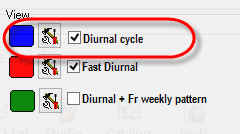
It shows the typical price movement within a trading day. All downloaded price history is used for calculation of this cycle.
Fast Diurnal cycle
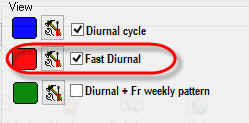
This diurnal cycle shows the typical price movement within last three trading days.
Diurnal + Weekly cycle
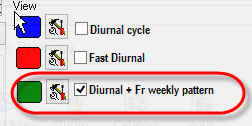
This is patterned cycle, it shows the typical price movement within some day, and it is based on the price movements at that specific day of the week. Consider diurnal cycle calculated for Monday. When we work with this cycle, we assume that a diurnal cycle works differently for different days of the week.
Shifted Charts module
This feature is available for both, daily and intraday, charts.
Here are the examples how this module can be applied:
One year ago price chart: i.e. we display the price chart one year ago overlaying the current chart:
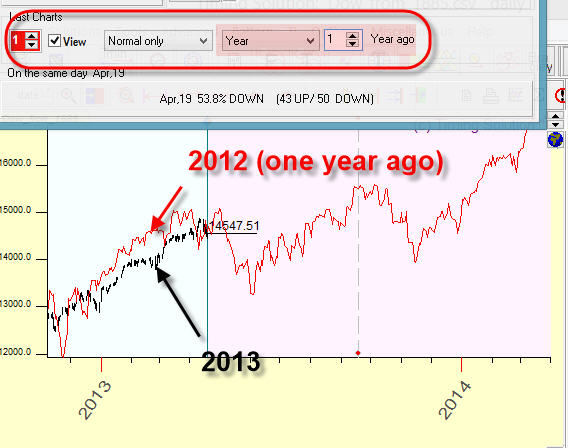
Take it as a simplest Annual cycle.
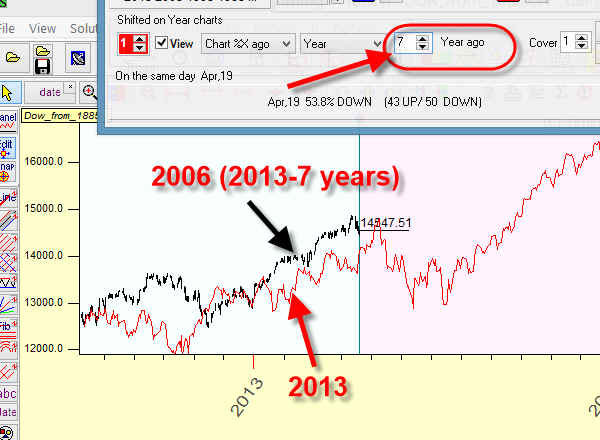
Seven years ago price chart: i.e. display the price chart seven years ago overlaying the current chart:
Inverted one synodic Moon cycle ago price chart: it displays the price chart one synodic month ago, i.e. full Moon phases cycle ago:
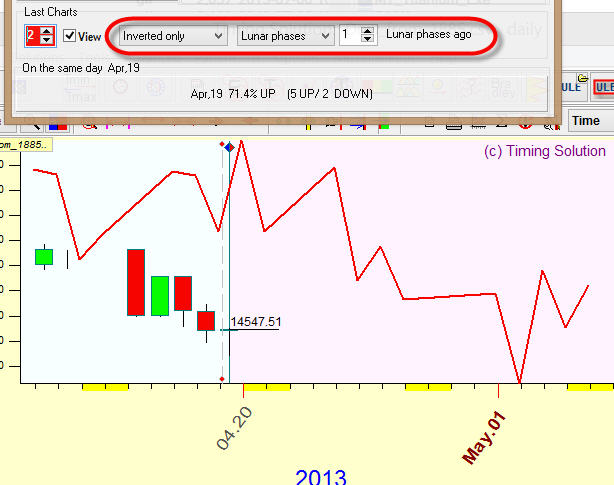
Pay attention, we use inversion procedure here, backtesting analysis shows that for some financial instruments inverted Moon cycle works better.
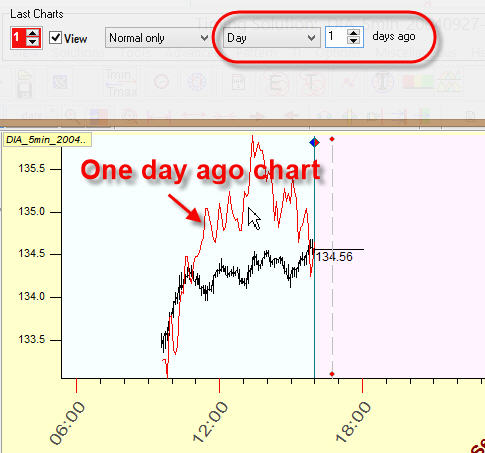
For intraday: one day (calendar day) ago price chart: i.e. display the price chart one day ago overlaying the current chart:
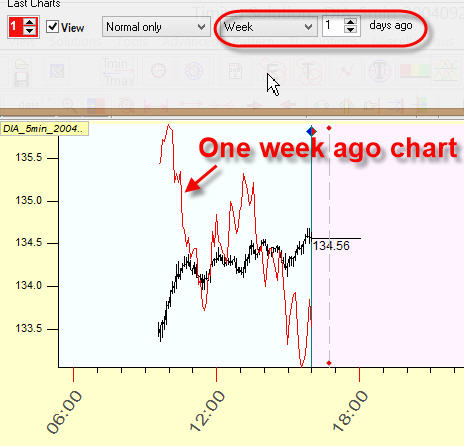
For intraday: one week ago price chart: i.e. display the price chart one week ago overlaying the current chart:
Default parameters
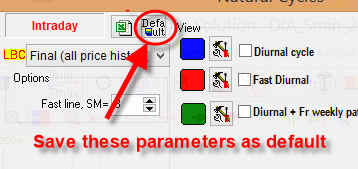
You can save parameters as default clicking this button.