Searching and verifying Neural Network models
applied for
retail breath index
Retail breath index
In this class I want to show how to verify projection lines calculated with Neural Network module in Timing Solution software. As an example
let's considered market breath index based on prices for 97 biggest retail
companies. Here is the list of those companies:
RAD,Rite Aid Corporation,
MW,The Men's Wearhouse Inc.,
CONN,Conn's Inc.,
AAP,Advance Auto Parts Inc.,
JOSB,Jos. A. Bank Clothiers Inc.
AMZN,Amazon.com Inc.
PSMT,PriceSmart Inc.
VSI,Vitamin Shoppe Inc.
AWAY,Homeaway Inc.
SUSS,Susser Holdings Corporation
ODP,Office Depot Inc.
PCLN,priceline.com Incorporated
EXPE,Expedia Inc.
HIBB,Hibbett Sports Inc.
ASNA,Ascena Retail Group Inc.
NILE,Blue Nile Inc.
NFLX,Netflix Inc.
SWY,Safeway Inc.
FL,Foot Locker Inc.
M,Macy's Inc
MNRO,Monro Muffler Brake Inc.
TRIP,Tripadvisor Inc.
DDS,Dillard's Inc. Class A
TJX,The TJX Companies Inc.
AZO,AutoZone Inc.
BWS,Brown Shoe Company Inc.
CST,CST Brands Inc.
CHS,Chico's FAS Inc.
FINL,The Finish Line Inc. Class A
TIF,Tiffany & Co.
CVS,CVS Caremark Corporation
GCO,Genesco Inc.
SPLS,Staples Inc.
DKS,Dick's Sporting Goods Inc.
SIG,Signet Jewelers Limited
MUSA,Murphy USA Inc.
TSCO,Tractor Supply Company
GNC,GNC Holdings Inc. Class A
SSI,Stage Stores Inc.
BBY,Best Buy Co. Inc.
HSNI,HSN Inc.
PAG,Penske Automotive Group Inc.
DG,Dollar General Corporation
GES,Guess? Inc.
KSS,Kohl's Corporation
JWN,Nordstrom Inc.
WMT,Wal-Mart Stores Inc.
WAG,Walgreen Co.
LB,L Brands Inc.
SBH,Sally Beauty Holdings Inc.
BKS,Barnes & Noble Inc.
COST,Costco Wholesale Corporation
KR,The Kroger Co.
KMX,CarMax Inc.
DSW,DSW Inc. Class A
ROST,Ross Stores Inc.
ANN,ANN INC.
DLTR,Dollar Tree Inc.
HTSI,Harris Teeter Supermarkets Inc
PETM,PetSmart Inc.
ABG,Asbury Automotive Group Inc.
CASY,Casey's General Stores Inc.
ORLY,O'Reilly Automotive Inc.
SAH,Sonic Automotive Inc. Class A
TGT,Target Corporation
AEO,American Eagle Outfitters Inc.
CAB,Cabela's Incorporated
LAD,Lithia Motors Inc. Class A
WFM,Whole Foods Market Inc.
ARO,Aeropostale Inc.
AN,AutoNation Inc.
BKE,The Buckle Inc.
PLCE,The Children's Place Retail Stores Inc.
GPS,The Gap Inc.
URBN,Urban Outfitters Inc.
FDO,Family Dollar Stores Inc.
FIVE,Five Below Inc.
RCII,RentACenter Inc.
ANF,Abercrombie & Fitch Co. Class A
GPI,Group 1 Automotive Inc.
ZUMZ,Zumiez Inc.
FRAN,Francesca's Holdings Corporation
GME,GameStop Corp. Class A
GRPN,Groupon Inc. Class A
BIG,Big Lots Inc.
EXPR,Express Inc.
SFLY,Shutterfly Inc.
TFM,The Fresh Market Inc.
SVU,SUPERVALU INC.
ULTA,Ulta Salon Cosmetics & Fragrance Inc.
SHLD,Sears Holdings Corporation
TUES,Tuesday Morning Corporation
WTSL,The Wet Seal Inc. Class A
JCP,J. C. Penney Company Inc.
PBY,The Pep Boys--Manny Moe & Jack
CATO,The Cato Corporation Class A
FRED,FRED'S Inc. Class A
This is how this index looks (it is calculated in the new module, "Market components analysis"):
This index shows the averaged oscillation of the stock prices for these companies around 50 days moving average line. In other words this index can be taken as
a breath of the retail sector.
I tend to use this index instead of standard S&P retail index because most standard indexes are weighted by market capitalization of involved companies. It makes this index more dependable of
several of the most capitalized companies.
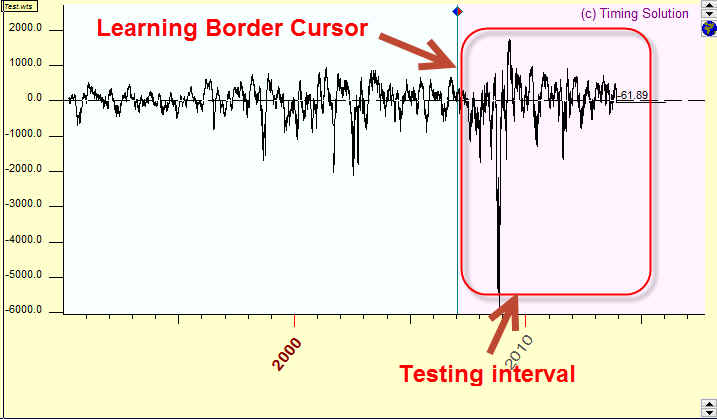
Learning Border Cursor (LBC) - Testing interval
Now we create the forecast model for this retail breath index. I have downloaded
it into Timing Solution. The first thing we have to do is to set Learning Border Cursor (LBC) to some
specific date. The price history after LBC is called TESTING interval, and we use this
portion of price history data to verify the workability of our projection line. I set LBC to
the beginning of the year 2007; in other words we have almost seven years after LBC to verify our projection
line:
Output - what to forecast
Next step: we need to decide what we are going to forecast. As you see, our "retail breath" index has
no trend, it is the oscillation around zero level. So in this particular case we can use this index itself as
a target/output for Neural Network. So set these parameters here:
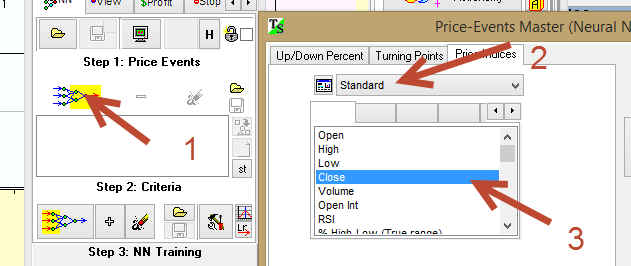
We use "Close" field; it is because this index has no trend, so the program puts the value of retail breath index
itself into Close field.
You may deal with a different situation - when your index is
trended. Look at this example: Neural Network model for Wall Mart (WMT) prices.
The price chart for WMT has a trend, this is how this price chart looks:
In this case it is better to use relative price oscillator as
the output for Neural Network:
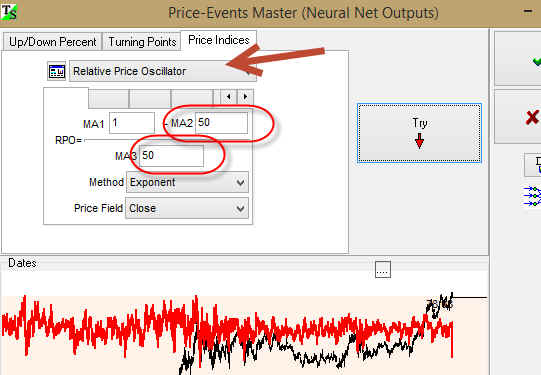
In other words the projection line will forecast not the Close index itself but
some oscillator based on this price chart. It is because Neural Network works
with detrended /normalized data only. You can play with smoothing window
parameter, though my experience shows that this parameter does not change the
projection line drastically.
Inputs=model - what forecast is based on
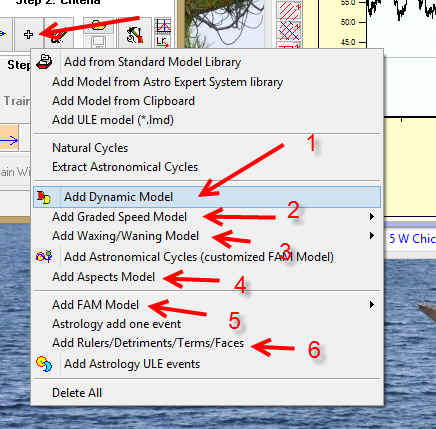
Next step is to define inputs, the components of the model for this Neural Network, i.e.
items this Neural Model is based on. It can be based on aspects events, or Moon phases, or regular cycles,
or many-many other events that take place in the Nature. What model to
choose? Usually I check several models. I check how each model works; if
some model does not work, delete it clicking "Clear events" 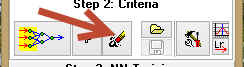 button and try another model. Do not forget to delete the old model before
creating a new one. Here are the typical models I employ:
button and try another model. Do not forget to delete the old model before
creating a new one. Here are the typical models I employ:
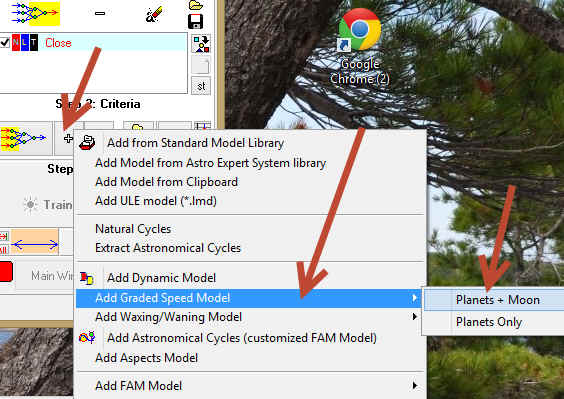
In this example I have chose graded planetary speed model. The events for this model are defined this way:
Now click this button:
and the program begins training our Neural Network, i,e. it creates the model for retail breath index based on
planetary speed astronomical phenomena by defining weights of the model's
components.
Verification
Now click these two buttons:
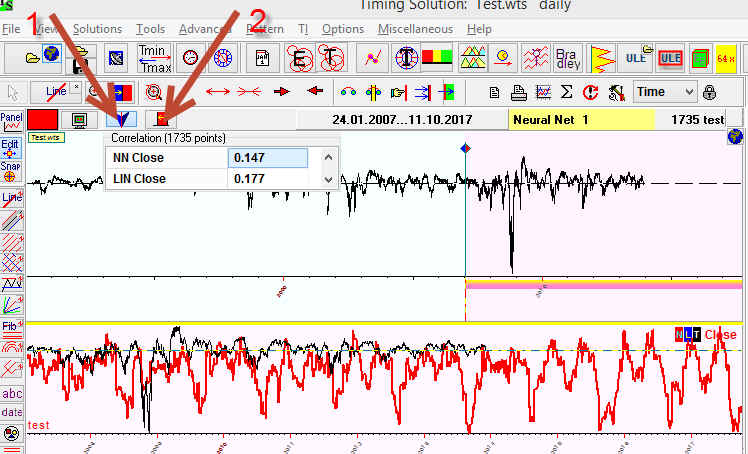
The first button serves to display the correlation coefficients of our retail breath index and Neural Network projection line for
the viewed interval:
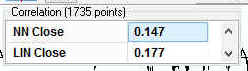
This correlation coefficient calculated for historical data after LBC shows the forecast ability of our Neural Network projection line, real non future leaks forecast ability.
It shows how good/not good our Neural Network model is.
You
can choose this viewed interval dragging the mouse cursor through different parts of
the price chart and browsing how well the Neural Network model works there:
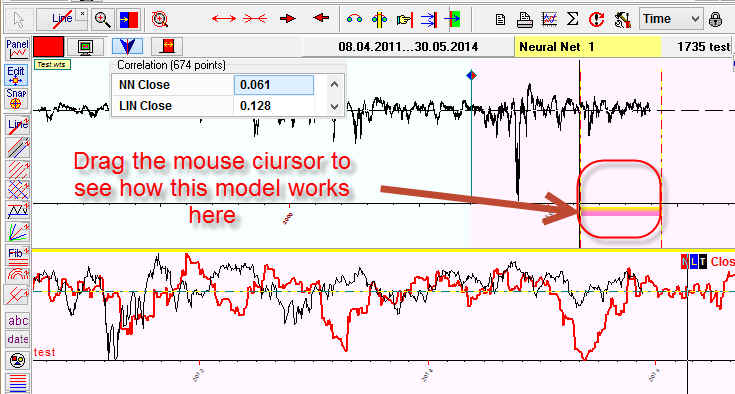
In this example I've highlighted the interval that covers years
2011-2013. We see how Neural Network projection line (red) forecasts the retail
breath index (black) and see the correlation coefficient of the price and the
projection line. You may use this table to estimate the quality of your projection
line:
| Correlation coefficient |
Quality of projection
line |
| 0.05-0.1 |
Poor but we can try to use it |
| 0.1-0.15 |
Not bad |
| 0.15 and higher |
Good |
Do not forget that the analyzed interval (viewed) should cover
at least one year of the price history (for EOD data), better three years and
more. I also highly recommend simply browsing this projection line and watching
how it fits the price chart. Sometimes visual analysis provides more information
than formal statistical criteria. For Moon based models that look for
oscillations with one month period the correlation coefficient may be lower.
You see in the example above that the values of correlation coefficients are positive. The correlation coefficient
0.147 (14.7%) for seven years of history is a pretty good value. It tells us that this model works. Of course it does not explain
every market movement: 85% of the movement of the retail sector are still driven by
some other forces. However, it is a good result as in financial analysis each and
every percent above Chaos counts.
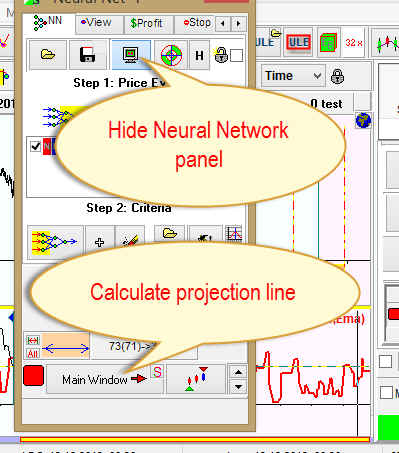
Final step
Now you can send this projection line to the Main screen, follow
these steps:
December 15, 2013
Toronto, Canada