Composite Module - preliminary description
This is the most impressive technology in Timing Solution. The composite module allows you to construct the projection line based on several astrocycles. So, you can consider this article as an express class that shows you the fast way to create the projection line based on astrocycles.
ALL NOTES ARE WELCOME. WE NEED TO FINALIZE THE INTERFACE OF THIS MODULE TOGETHER, TO PROVIDE THE MAXIMUM CONVENIENCE WHEN YOU ARE WORKING WITH TIMING SOLUTION. When this module will be finalized, I'll do the final version of these Classes.
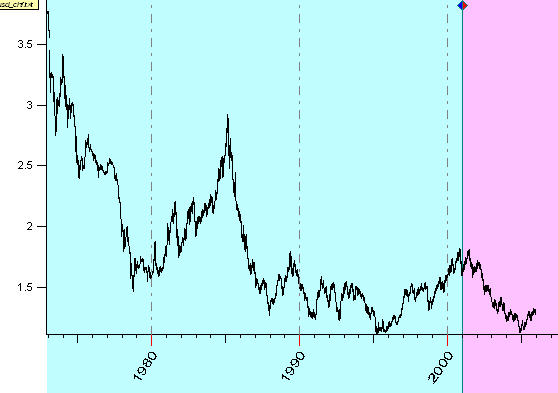
Let us create the forecast for some data. Let it be the latest data I have worked with: currency USD/CHF (1973-2006). This is the chart:
Click the "Astronomy" button: ![]() (By the way, I keep the name "Astronomy" instead of "Astrology" taking into
the consideration the chronic fear of the last word from the scientific community. Ok,
we can play with the toys they like.)
(By the way, I keep the name "Astronomy" instead of "Astrology" taking into
the consideration the chronic fear of the last word from the scientific community. Ok,
we can play with the toys they like.)
You immediately will get the Annual cycle diagram:
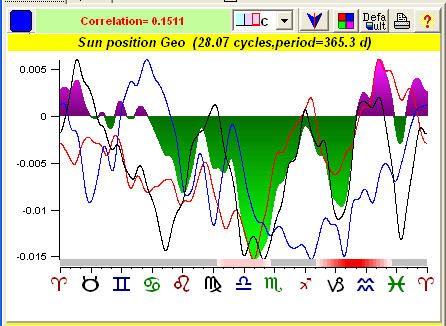
How to read this diagram? The colored diagram shows the price movement in respect to the Sun's position. To calculate this diagram, all price history before LBC (learning border cursor) is used.
Can we be sure that this Annual cycle reflects the true price movement? Can we trust this cycle?
Common sense says that we can use as hints several independent witnesses and see whether they confirm this Annual cycle. Where can we find these witnesses? We have them already: we can divide our almost 30 years of price history on 3 independent interval, each one being about 10 years long (do not be scared, the program does this work automatically). Here they are:
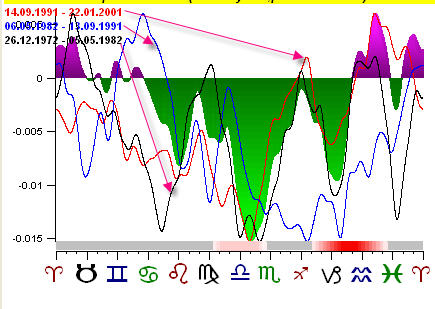
You see there now three additional diagrams (red, blue and black curves). These diagrams represent the same Annual cycles from the point of view of these three witnesses. Witness #1 watches the price history within the time frame 1991-2001 years, it works with the latest available price history data. Witness #2 works with the data of 1982-1991, while Witness #3 observes 1972-1982. What do they say to us?
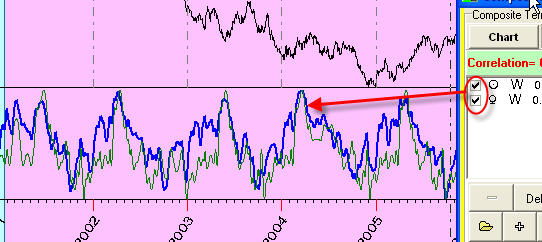
The common sense tells us that we need to consider those Zodiac zones where all three witnesses point at the same tendency in price movement. These zones are marked by red stripes in the bottom of the diagram. Here they are:
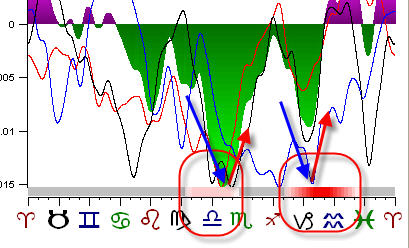
The red and blue arrows show the major trend directions in respect to the Sun's position. You can see that the Sun is responsible for the major drives approximately 4 months a year (only!). Any other time we have got mixed signals.
One additional fact that increases our confidentiality regarding Annual cycle is shown on the screen as well. Look at this label: Correlation=0.1511
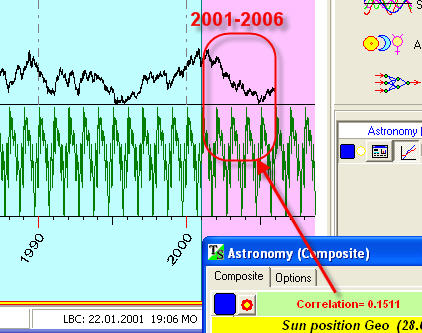
We did not use last 5 years of price history for the calculation of this cycle. This is Testing Interval (2001-2006) - shown as pink region on the chart. This label says that the projection line based on Annual cycle provides the correlation of 15% (actually, the program calculates the correlation between the projection line and the relative price oscillator with period = 71 days, to eliminate the trend component).
We can look at our Annual projection line in the Main window:
In Composite window we can set the color of our projection line or to hide it:
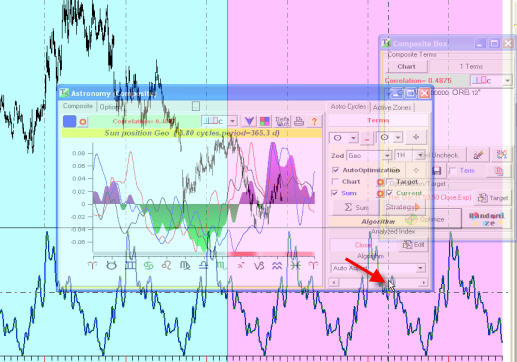
Ok, we may assume that this cycle is good enough and we decide to use it for our projection line. Click here:
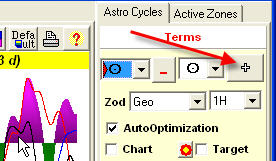
The program will immediately display one more window Composite Box. Here it is:
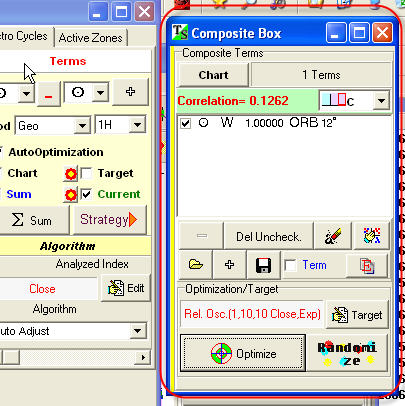
The Composite Box allows us to collect as many astrocycles as we like and calculate the summary projection line based on these cycles.
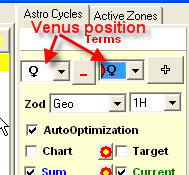
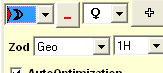
Now it is a time to play with other astrocycles. I've found that Venus cycle works for these data (though it is related to the annual, i.e., Sun cycle, it is still a different cycle). Set these parameters:
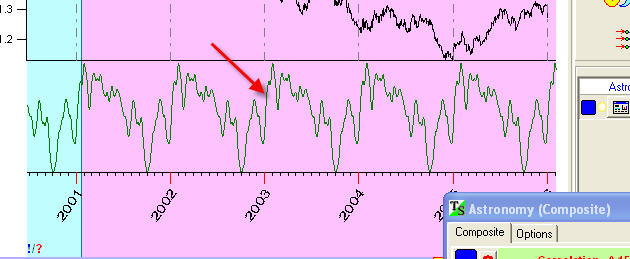
I got this Composite diagram:
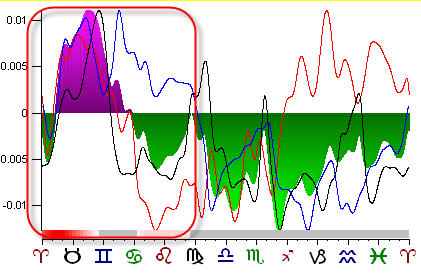
Venus forecasts the price better when it is in the first half of Zodiac. I have added this cycle to the Composite Box as well.
Look at the Main window. You can see here the thin blue line that represents the sum of Sun and Venus astro cycles:
The next cycle that might work for these data is the cycle of the angle between the Moon and Venus:
This cycle is added to the Composite, as well as the Sun - Neptune cycle.
Also, I would recommend to use the phase Zodiac. For example, see this Composite for Uranus phase cycle:
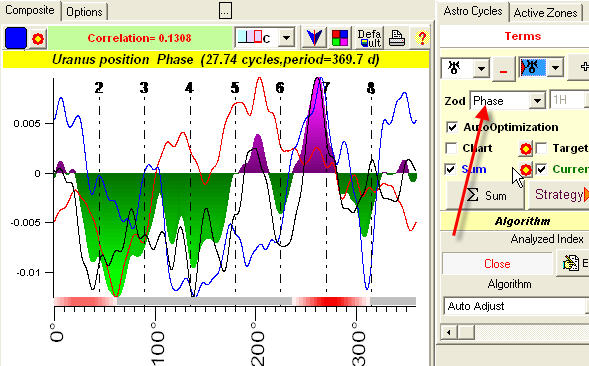
This is the cycle that is close to the Annual cycle (period=370 days).
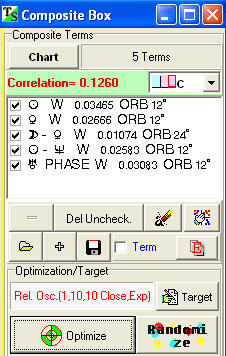
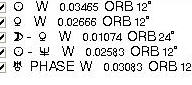
Look at the Composite Box now. We have selected 5 different astrocycles:
The program performs the huge work of revealing these cycles very quickly (I have spent more time describing this than actually doing this). Mark them all. The program will optimize these cycles and produce the resulting projection line. You can see it in the Main screen now:
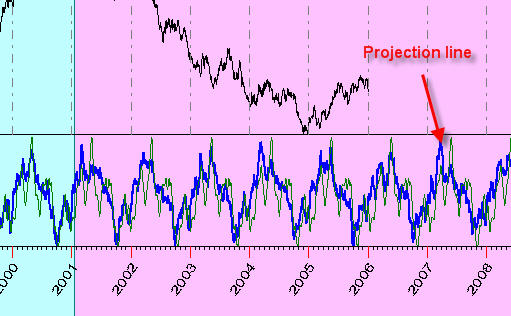
Because this model is based on astrocycles, we can prolong it into the future as far as we like. If, for some reason, we do not like the resulting projection line, we can go back to the Composite Box and disable one or several cycles there. The program will do the recalculation and re-optimization and will give a new projection line.
Sure we can manipulate with the screen image (magnify a part of the chart, shift it, etc.).
As I have said already, the program does this huge amount of calculation very quickly. My purpose was to find the appropriate math methods to make this easier for you.
When you click "+" button, the program calculates the astrocycle and optimizes the content of the Composite Box, trying to find the best input for each astrocycle. The information regarding the weight of each cycle is shown on the screen (like Sun W 0.03465):
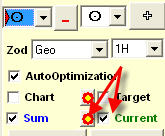
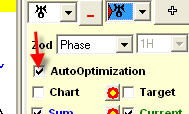
If you do not need this optimization, just disable "Auto Optimization"
option in Composite window:
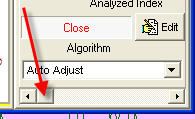
The program allows you to perform several scenarios of optimization (different optimizing intervals and different algorithms). You can set these options yourself in the Composite Box window:
Here are these options:
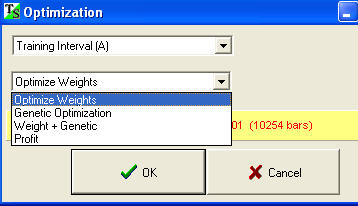
MY FRIENDS, I NEED YOU ASSISTANCE. PLEASE TRY TO PLAY WITH DIFFERENT VARIANTS. I STILL AM NOT SURE WHAT OPTIONS ARE MORE SUITABLE AS "DEFAULT".
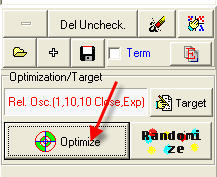
ALSO I NEED TO KNOW IS IT GOOD TO SET "AUTO OPTIMIZATION" AS THE DEFAULT OPTION. AS ALTERNATIVE, YOU CAN COLLECT ASTRO CYCLES WITHOUT OPTIMIZATION AND PERFORM THE OPTIMIZATION ON THE FINAL STEP CLICKING "OPTIMIZE" BUTTON IN THE COMPOSITE BOX.
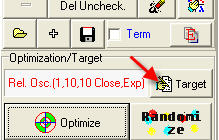
One more very important issue is Target. It is what we would like to forecast and what is used in the optimization process. Set the Target here (in Composite Box):
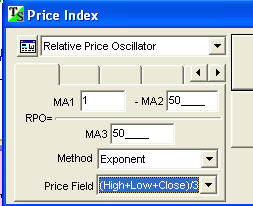
As an example, we can make a forecast for Relative Price Oscillator for (H+L+C)/3 with smoothing window=50 bars:
or we can try to forecast ADX (analyzing the trend's strength):

In the end, I would like to make some general notes regarding the interface.
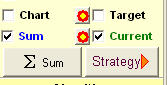
These options allow you to adjust the view of the Main window:
Also sliding this scroll bar:
you can make Composite window partially transparent. Thus you will be able to see the content of the Main window through the Composite: