Lesson 1
Universal Language of Events (ULE)
Timing Solution as an additional decision making tool for traders is based on one simple idea: explore the correspondences between market movements and some processes or phenomena we are familiar with. Why? - only because there is no a theory that explains market movements and is confirmed by practice. We have only collection of consistent data and some attempts to understand it through methods either Fundamental or Technical Analysis. Fundamental Analysis explores the correspondences between the market movements and fundamental factors (which are registered observations of economical life phenomena). Technical Analysis works with price charts and seeks for their inner relationships represented by TA indicators (which are speculations on price charts parameters). Timing Solution is a software designed to fill in the gap between the two; it analyzes past data, compares them to some known phenomena and simulates the relations between these phenomena and market data. We can do it, and we can do it easily - due to Universal Language of Events (ULE), the core idea of this software.
When I have met Alphee Lavoie 10 years ago, one of his first questions was: is it possible to calculate and register the dates when some astrological event has occurred and watch the market performance at those dates? This was possible, and we did it. This idea has been realized in the SuperSearch module of Market Trader series. At that time, we did a recording of many different astrological events. Then the idea of Astrological Language was born and developed later into Universal Language of Events. ULE has one very important feature: it is designed to deal with different events, not only with astronomical or astrological ones. As an example, now we can include price events as well. This module has a huge potential, and when some processes will be found that prove to be corresponding to markets' activity, we can add them to ULE and use for analysis.
As of today, astro events are the biggest group in ULE. It is not accidental. From one side, the movement of celestial bodies is a kind of a fundamental factor independent to our will or our activity. From the other side, it is one of the well-studied physical processes. The equations of planetary movement are used not only by astrologers. They have been studied and developed by the greatest scientists of the past (remember Sir Isaac Newton, Ticho Brahe, Kopernicus and Kepler?) and are applied now by rocket scientists, astronomers, physicists, etc. So, if there is any correlation between market performance and the astro factors, at least we can be sure that the astro part is calculated and recorded with great accuracy. (And we believe that such correlation exists - due to the assumption that market movements reflect mass psychology that is described very well by astrological factors.)
So, ULE is built from small bricks - different events. We can find when any of these events has occurred in the past and record the market condition at these moments. (Here and further in these lessons I call analyzed set of data as "analyzed market", "market" or "financial instrument"; it means the consistent data that we analyze with the help of Timing Solution. It could be data set on some stock, index or futures; I tried several times sun-spot activity data and temperature files for some locations as well.) As I said already, the huge part is made by astro events. I tried to include astro parameters that reflect a real process - such as planetary positions in Zodiac (space), angles between the planets, planetary speed, planetary phases; these astrological events coincide with regular astronomical events and are described by proper equations. Also, I have included pure astrological parameters - such as retrograde/direct movement, planetary positions in houses, Moon Nodes and other.
If you are familiar with Astrology already, you will easily understand how to work with this module (either SuperSearch in Market Trader or ULE in Timing Solution). If you are not, do not panic. You have no need to learn the whole great astrological lore, at least not now; it is enough for you to know the name and general meaning of any astro event included into ULE and be able to work with it. "Work with it" means being able to make the choice of necessary parameters and interpret the calculated results. You can trust the accuracy of calculations, Timing Solution and Market Trader do it well (plus the users of our astro software have checked it already many times:)). Later, and believe me, it will come - you will be fascinated by this Astro world, and you will read and learn a lot. But now - it will be enough to be able to work with these bricks of ULE. It is a very valuable ability: it will help you later to create your own models for projection lines and now it will help you to evaluate different ideas.
At least once a week I get a question like this: "What do you think will happen to the stock market when Mars ingresses Leo next time? Will it go up (down)?". When I ask in turn why this should happen, the best answer is something like this: "It has happened when Mars has ingressed Leo in September 1996". What do I think? Nothing. As my teacher, friend and partner Alphee Lavoie has said once, "The financial astrology is the precise science". Trading with astro cycles, we need to see the whole picture, all "pro et contra" of our statements, not just one side.
So, what would I do? I would run ULE (or SuperSearch) module. And there I would open the tab for the astro event in question, do the calculations and get all the moments when this event has occurred in the past. (By the way, "past" means my price data file, the historical data for the financial instrument that I do research for.) Then the program helps me again: it compares the event dates to the market conditions and does the statistical analysis. So, the unpleasant and boring job of calculating all ups and downs and comparing them to control groups is produced by the computer. I will do the honored job of thinking and making conclusions. And you can do it, too.
After learning this material, you will be able to check any astro related statements within seconds. Therefore, you will deal with astro finance info on a new level - you will have no need to trust or believe somebody or something, you will find the value of their statements. Next level will be making such statements yourself.
Let us start working. We begin with one practical example. This is a question that I have got recently from one of my correspondents: "What happens to Dow Jones Industrial Index (DJI) when Saturn is changing its movement mode from direct to retrograde?" (For your information, see the glossary at the end of this lesson; it explains astro terms used here.)
There are several ways to answer this question. We may guess (which is not my way). We may apply general astrology considerations (which I would not recommend; the general astrology's symbolism is designed for the needs of the personality; the core ideas behind it definitely work though sometimes their application is too vague; it is a theme for a special discussion and not a topic of this lesson). I prefer to do the thorough analysis.
Do it together with me.
We have here an object - DJI index. We will make a conclusion regarding its movement in respect to the outer factor - the movement mode of Saturn.
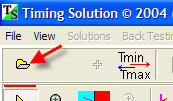
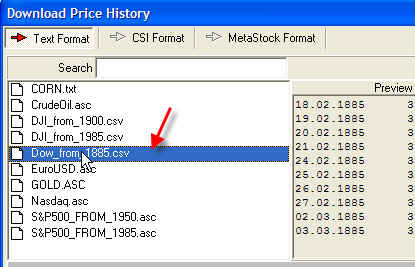
So, download the data. I have DJI from 1885 to 2006 year, 120 years of history! To do that you should click this button
and chose this file:
Now, do these steps:
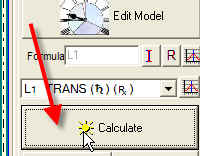
#1: Click "Calculate" button. The program will do all calculations related to astro events that may occur within our data file. It will save us time later, when we will look for the particular events and work with them. Then click this button:
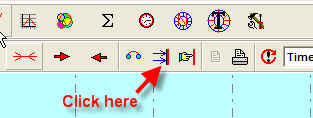
Doing this, we set the Learning Border Cursor (LBC) to the last price point available. This way we tell the program that we will use ALL available price history to analyze this astro phenomenon.
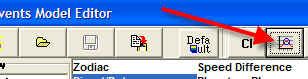
#2: Activate this to get the access to Universal Language of Events (ULE) components:
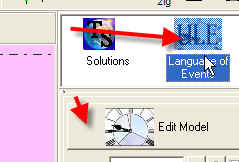
and then click "Edit Model" button.
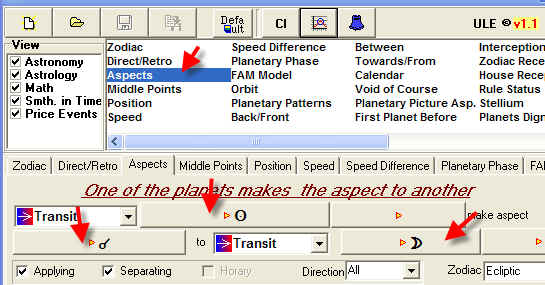
#3: The "Model Editor" window will appear:
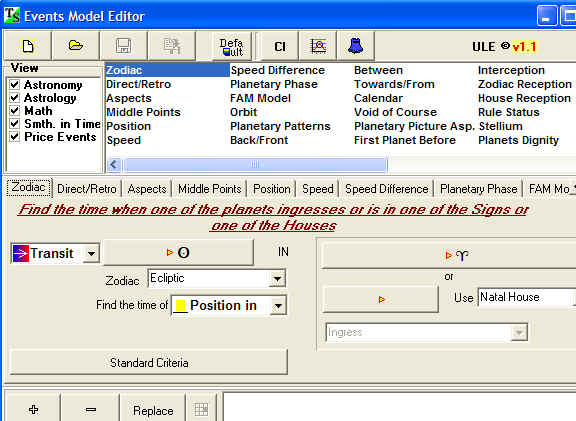
This is the central window for ULE. There are many tabs there; each of them corresponds to some astro event or a group of events. You define everything there. Every tab is like an astro sentence. I recommend spending some time to get familiar with each tab.
Let us record our event, "the transit Saturn changes direction direction from retrograde to direct".
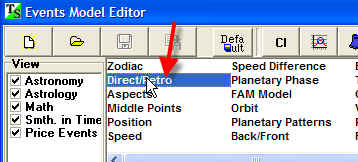
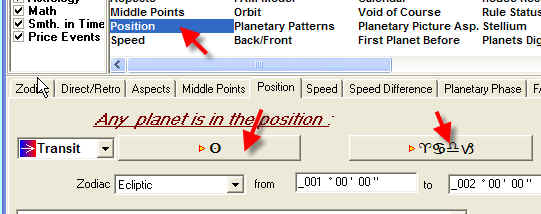
#4: Choose the tab that corresponds to the phenomenon we are interesting in. Click here for a change in a movement mode:
#5: The form will appear. It describes things related to the planetary movement mode: the mode itself, speed and acceleration types. You can do it for one planet only or for a group of planets. This one tab gives you ability to do a lot of research.
For our example, fill it this way:
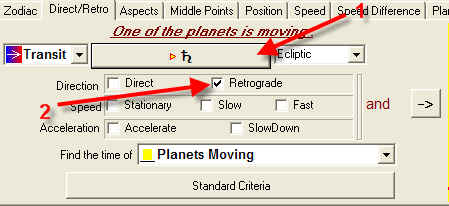
We have recorded this astro event, "transit Saturn is moving retrograde".
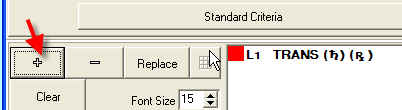
#6: Click "+" button to add this event to the list (it is necessary, the program works only with the events in this list; we do now a simple scenario consisting of one event only; you can add other events later - it is a way to create a model):
#7: It is almost done. Click "Calculate" button in the Main window:
#8: Now in the Main window you should get something like this:
The black line represents our data; the red zones correspond to the periods when transit Saturn is retrograde.
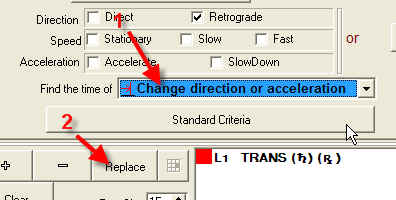
#9: OK, we did it. However, we were interested in the MOMENTS when Saturn becomes retrograde. It looks like we have made a mistake. If you would do it manually, you could be very upset as it means a lot of work done in vain. With our software, it is not a problem, you can fix it easily: choose "Change direction .." option, click "Replace" button and calculate it once again:
Now you should get a bunch of vertical lines instead of red stripes. These lines correspond to the moments when Saturn becomes retrograde:
We have got 116 lines within our data file. Now, we need to take them one by one and watch how the stock market (i.e., DJI) moved around these moments.
#10: Or, we can do it easier - running the "Efficiency Test" module:
We will get this diagram:
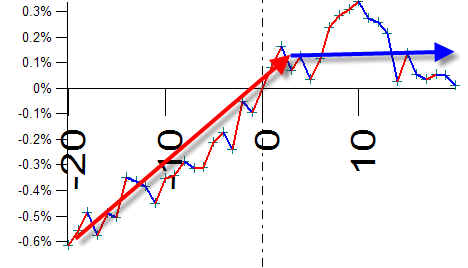
This diagram shows an average price change around the moment when Saturn becomes retrograde.
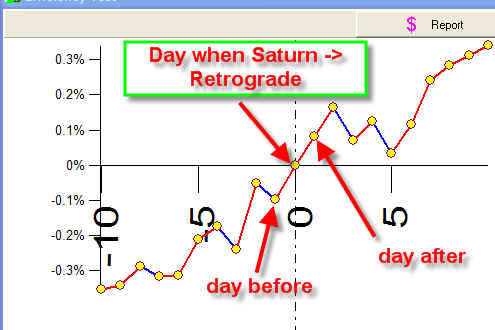
Thus you can see the average movement of DJI ten days before and ten days after Saturn becomes retrograde
What conclusion can be made? There is upward movement there; however, it has started before Saturn's change of direction, at least 10 days earlier.
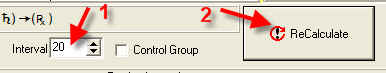
#11: Continue researching the impact of this phenomenon. Let us consider the bigger time span. Set the analyzed interval as 20 days and click "Recalculate" button:
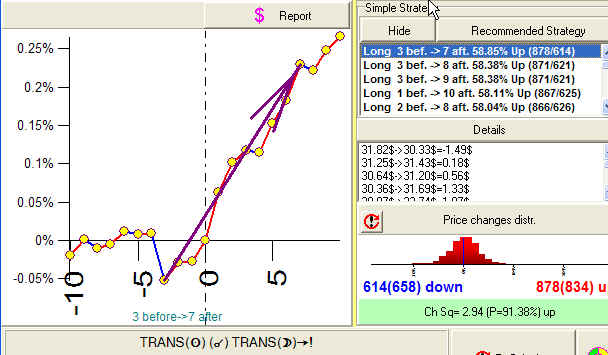
#12: Here is the new Efficiency Test:
We can locate two clusters here:
Before Saturn going retrograde, the DJI goes up mostly, though there are some insignificant fluctuations. However, the next day after this phenomenon occurs, the DJI loses its energy to grow. The stock market needs some time to "recover the breath".
#13: We are able not only register the existence of the upward trend before Saturn becomes retrograde; we can evaluate the strength of this trend as well.
Let us compare the DJI value 2 days before Saturn becomes retrograde to its value 20 days before this event. As you remember, it has occur 116 times within our data file. How many times there was increase in the value of DJI? And how many times did it go down?
We can get the answer to this question very easily: A-push left mouse button on "A" point (20 days before retrograde); B-drag the cursor while holding left mouse button from point "A" to point "C" (2 days before retrograde) C - release mouse button. The program looks through each one of these 116 moments and compares values 2 days and 20 days before Saturn becoming retrograde.
Here is the result:
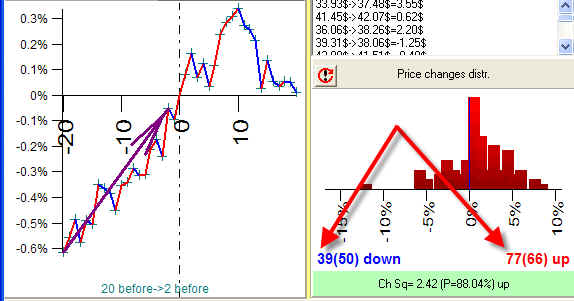
You see that the price went up 77 times, while it went down 39 times only. Plus, these results differ from the results provided by the control group (see the figures in brackets). So, I would say that the existence of upward trend for DJI, at least 20 days before Saturn going retrograde, is obvious.
However, you should be extremely cautious in making conclusions like this. The tricky part here is related to the control group issue, a very important thing in Statistics. The control group helps to eliminate natural trends. (Here is the example of a natural trend: a person is getting married; the main reason for this marriage is that they love each other. It is nothing surprising if the person is in the age 25 - 40. What if the person is 92? The control group for this age will show that this is an extraordinary event.) There are many ways of forming the control group. I chose the simplest one: we consider fictive event that happens totally randomly and watch how this event (so called "null hypothesis") affects the stock market.
You see the control group figures in brackets:
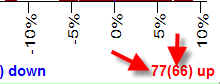
It means that the control group shows that DJI may go up 66 times against 50 down. In other words, the up movement is more typical for DJI under these conditions.. So we need co compare these values.
In any case, the DJI went up 77 times against 66 times caused by general trend. This tendency is rather strong. Click here to read more regarding this issue.
#14: Analyze the second cluster, downtrend movement. We will get this:
DJI went down 58 times against 53 caused by other reasons than Saturn's change of direction So the downtrend movement is not so strong.
These 14 steps above represent the method of analyzing any astronomical/astrological phenomena. Learn the whole sequence. It is one time effort, the routine is pretty obvious, and you will get used to it very quickly. (In brief, it is just downloading the data, choose the proper tab, record the event itself, calculate it, and do the Efficiency Test.)
Let us do one more example: analyze the effect of the New Moon. In Models Editor (you know now that this is a central window dealing with ULE), define this event:
Here is the Efficiency Test for the New Moon:
It shows the upward trend starting about 5 days before the New Moon. But this tendency is mostly due to some other reasons than New Moon effect: 878 against 834. The New Moon input is not significant. If you would decide to trade using this factor only, you are in risk. (Those who are familiar with astrology will not be surprised: the Moon is not an active player, it is rather a trigger, it gives the last touch to the big picture formed by the other players.)
By the way, an interesting thing is that the Full Moon does not provide any consistent results.
One more example before the end of this lesson: the Sun ingresses any Cardinal sign:
This is the Efficiency Test for this event:
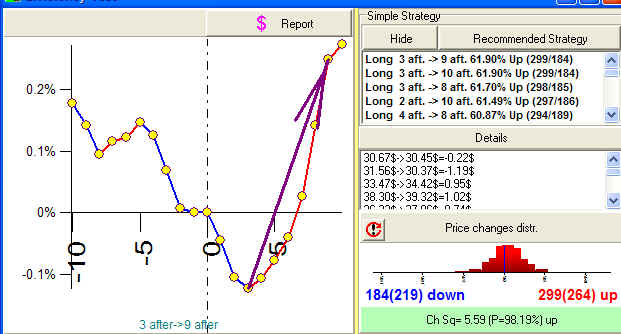
It means that the DJI starts its uptrend movement 3 days after the Sun ingresses Cardinal signs (Aries, Cancer, Libra and Capricorn); the probability of DJI going up for the next 6 days is 62%.
Note: sometimes we have a discrepancy between the arrow on Efficiency Test diagram and the statistical info:
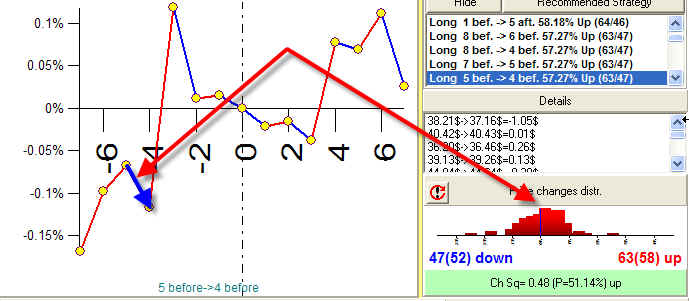
Here we explore this downtrend arrow, while the statistics shows that the price went up 63 times against 47. It means that our downtrend movement takes place in the uptrend environment; it might be a strong one, however it is at least only one strong down among these 47 downs, not enough powerful to change the trend.
Now, your homework. See here.
Resume: We have learned to record astro events and analyze our data in respect to these events. Now you are able to evaluate any astro info published in books, magazines, newsletters and in the Internet.